* price as on January 01, 0001
India
Consensus ratings*: Buy 2 Hold 1 Sell 0
Previous target: NA
Up/downside: 73.4%
Reuters
Bloomberg: HEG IN
Market cap: US$667m
Rs 54,786m
Average daily turnover: US$ 4.9m
Current shares o/s: 38.6m
Free float: 44.2%
*Source: Bloomberg
*Source: Bloomberg

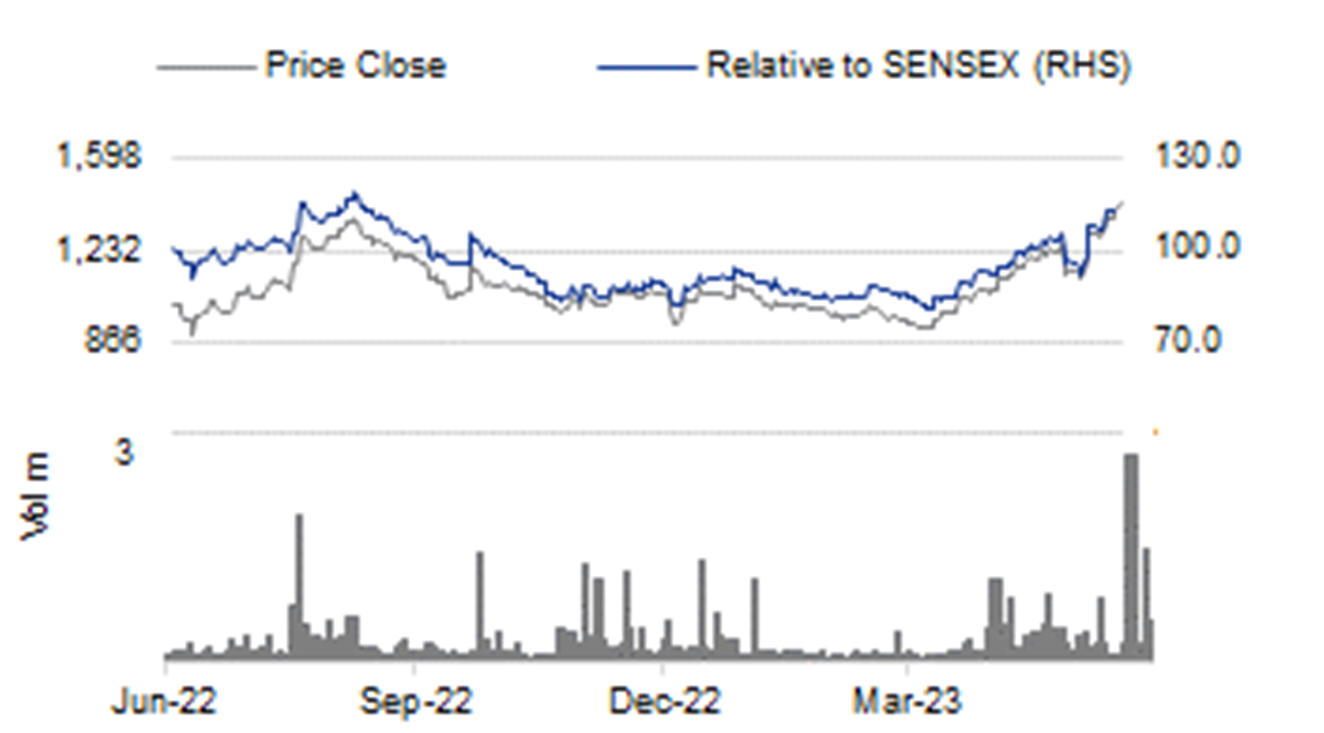
Price performance
1M 3M 12M
Absolute (%) 18.2 46.6 40.4
Relative (%) 16.5 33.4 16.7
Major shareholders
% held
Promoter & Promoter Group 55.8
FII 6.2
Insurance Companies 4.8
Analyst(s)

Satish KUMAR

T (91) 22 4161 1562
E satish.kumar@incredcapital.com

Vipraw SRIVASTAVA

T (91) 22 4161 1500
E vipraw.srivastava@incredcapital.com

Decarbonization shift and dawn of a new era

HEG is a manufacturer of graphite electrodes which are used as a raw material in steel production via the EAF route, significantly less polluting (three-fourths reduced emission) vs. the more traditional blast furnace or BF route.

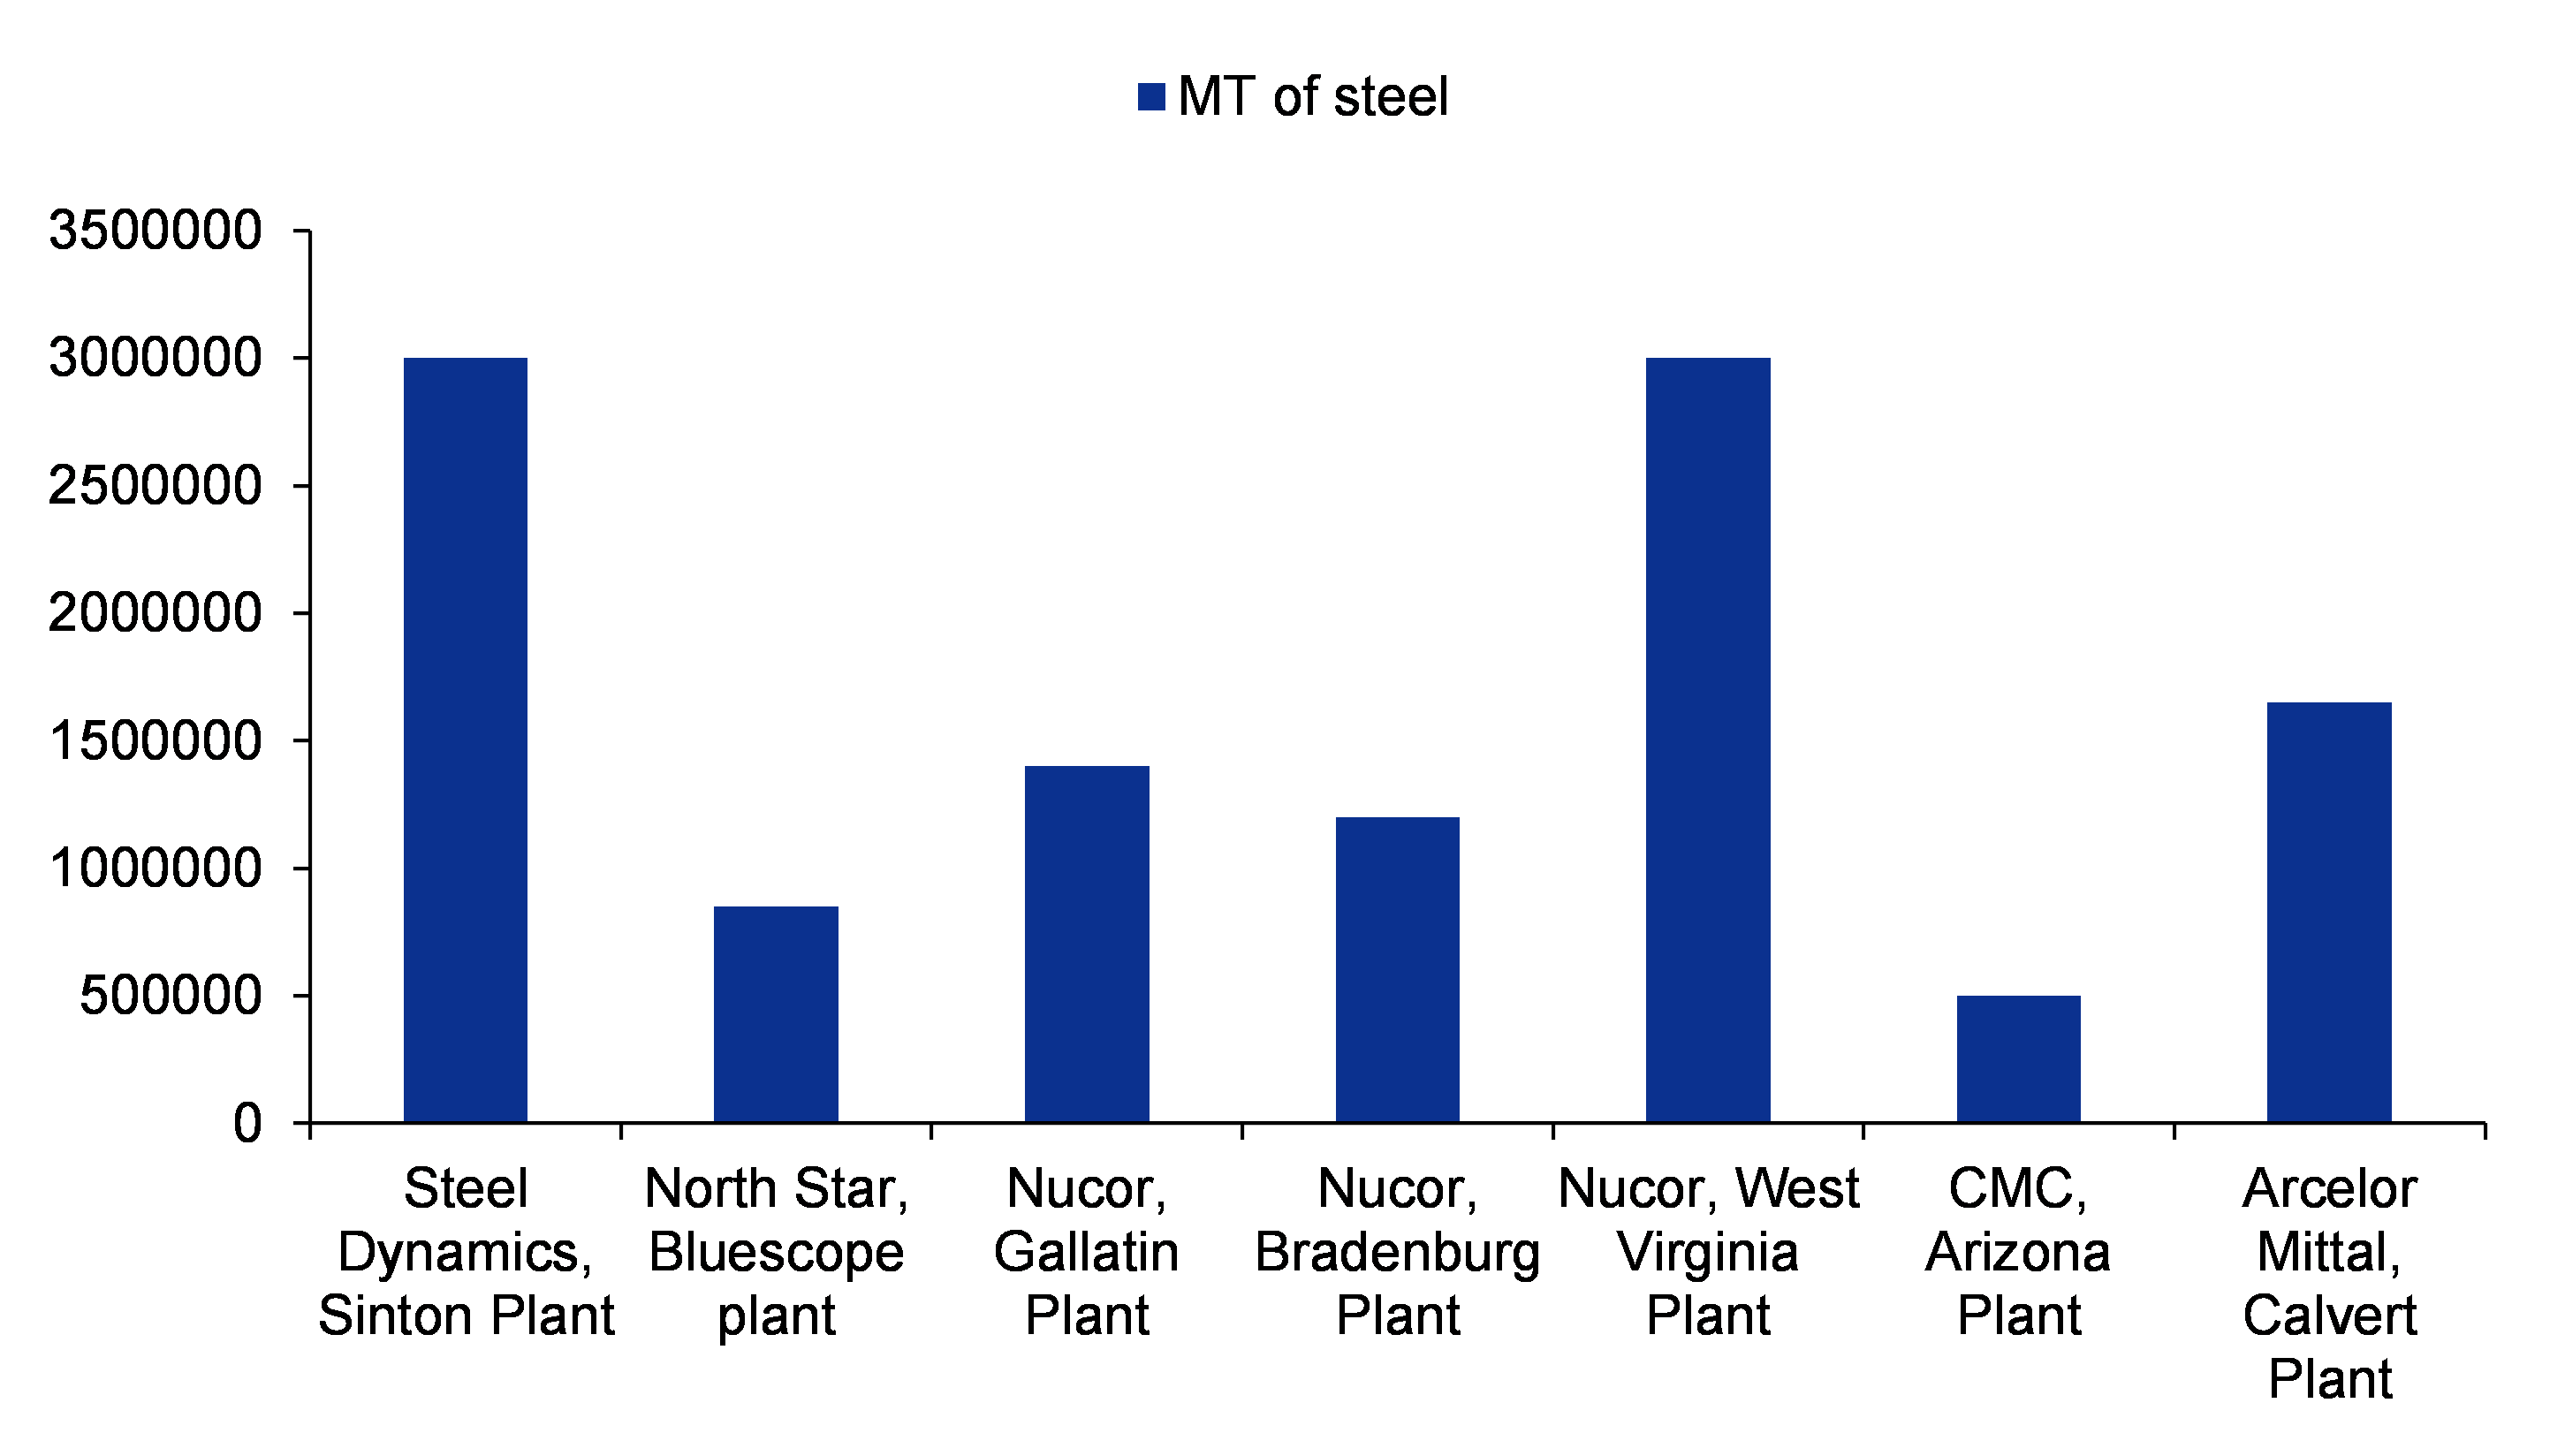
The beginning of inventory cycle decline for US steel mills, new EAF capacity addition in the US (11.45mt) and HEG’s foray into making graphite anodes for lithium-ion batteries makes it a strong bet in the next 12 to 18 months.

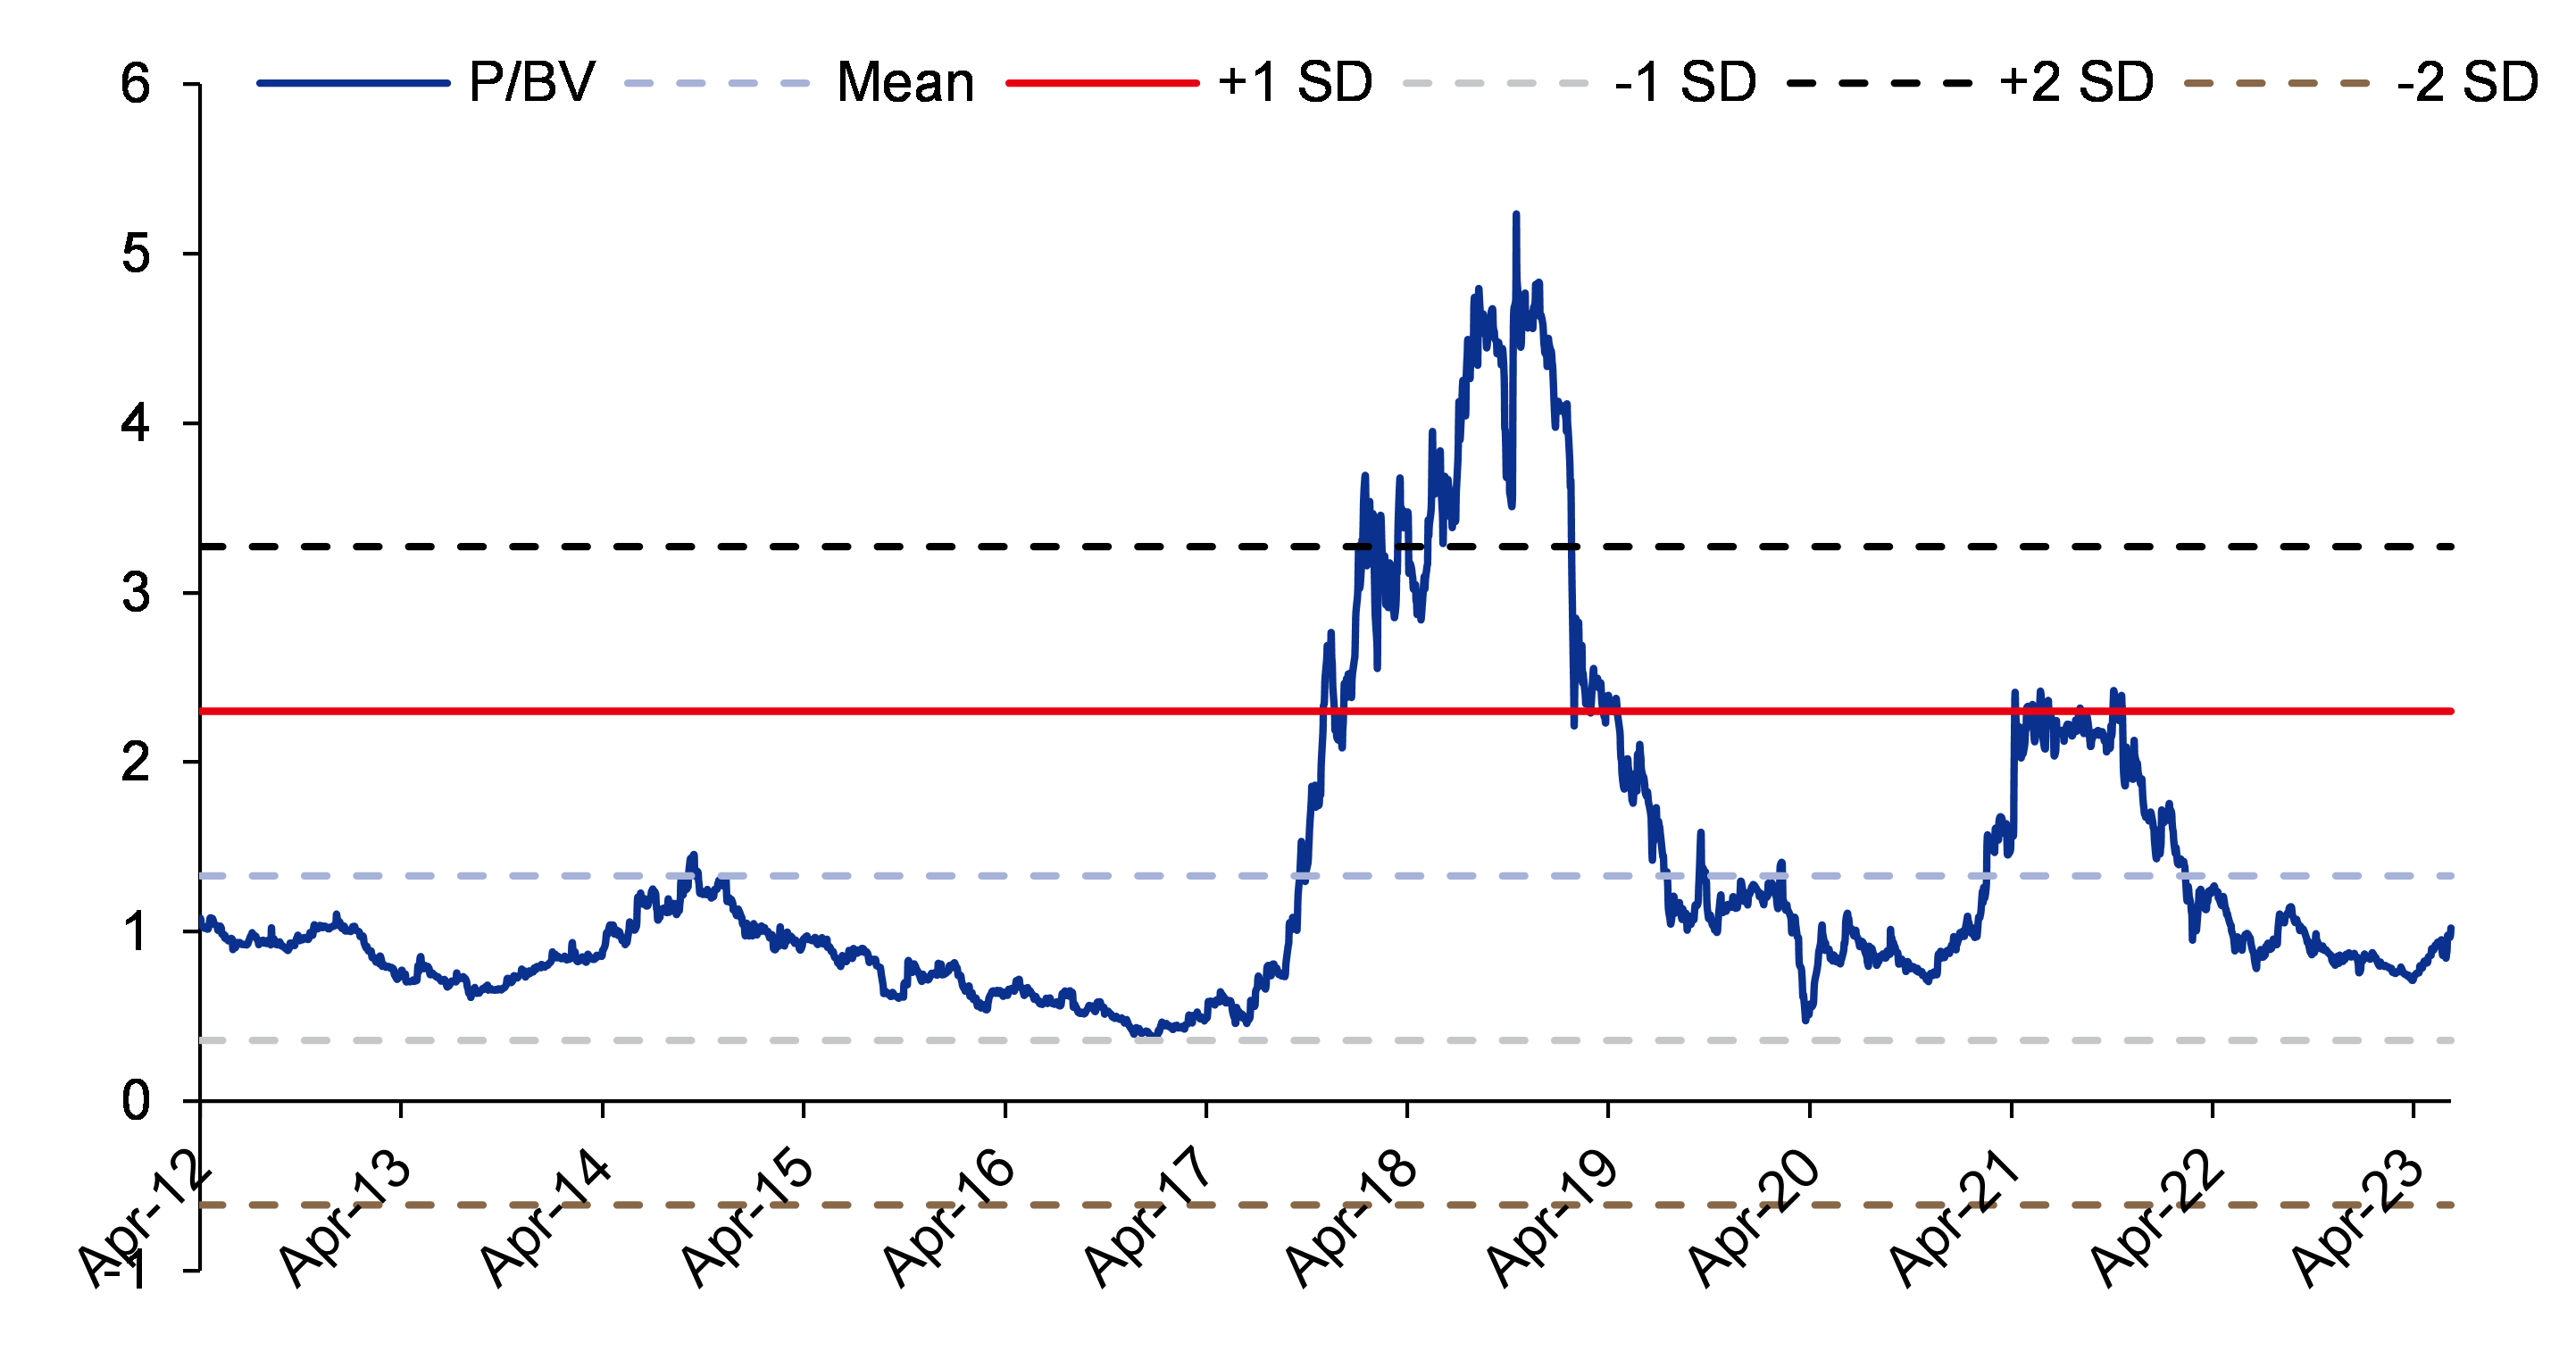
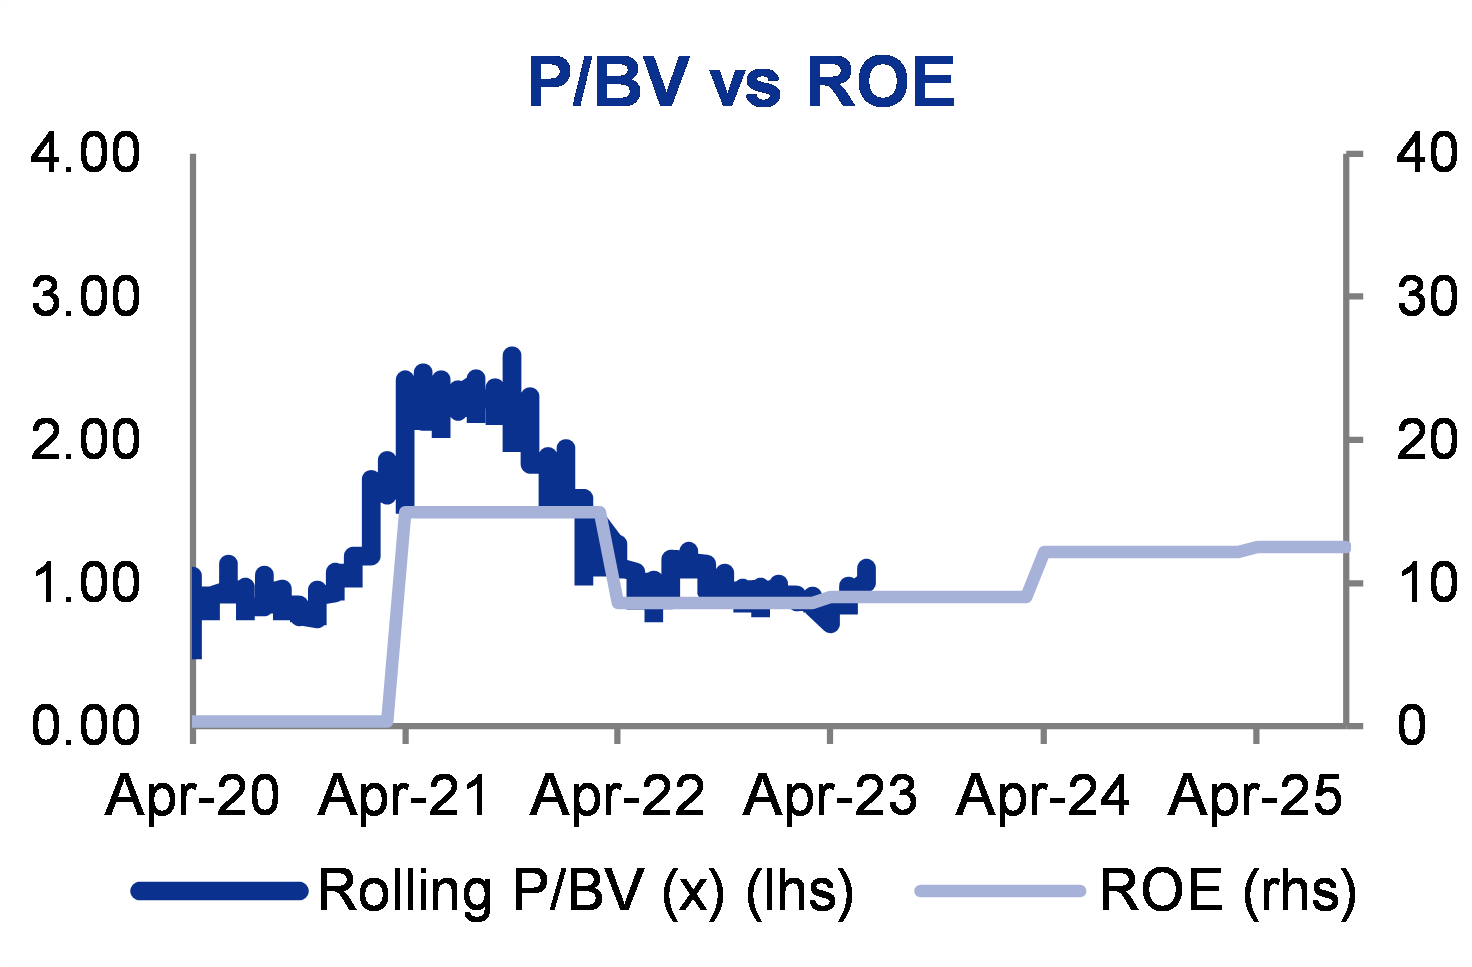
We value HEG at 1.8x P/BV, 0.5 SD from the historical mean of 1.3x, and initiate coverage on it with an ADD rating and a target price of Rs2,462.

Decline in US steel inventory and new EAFs provide growth visibility

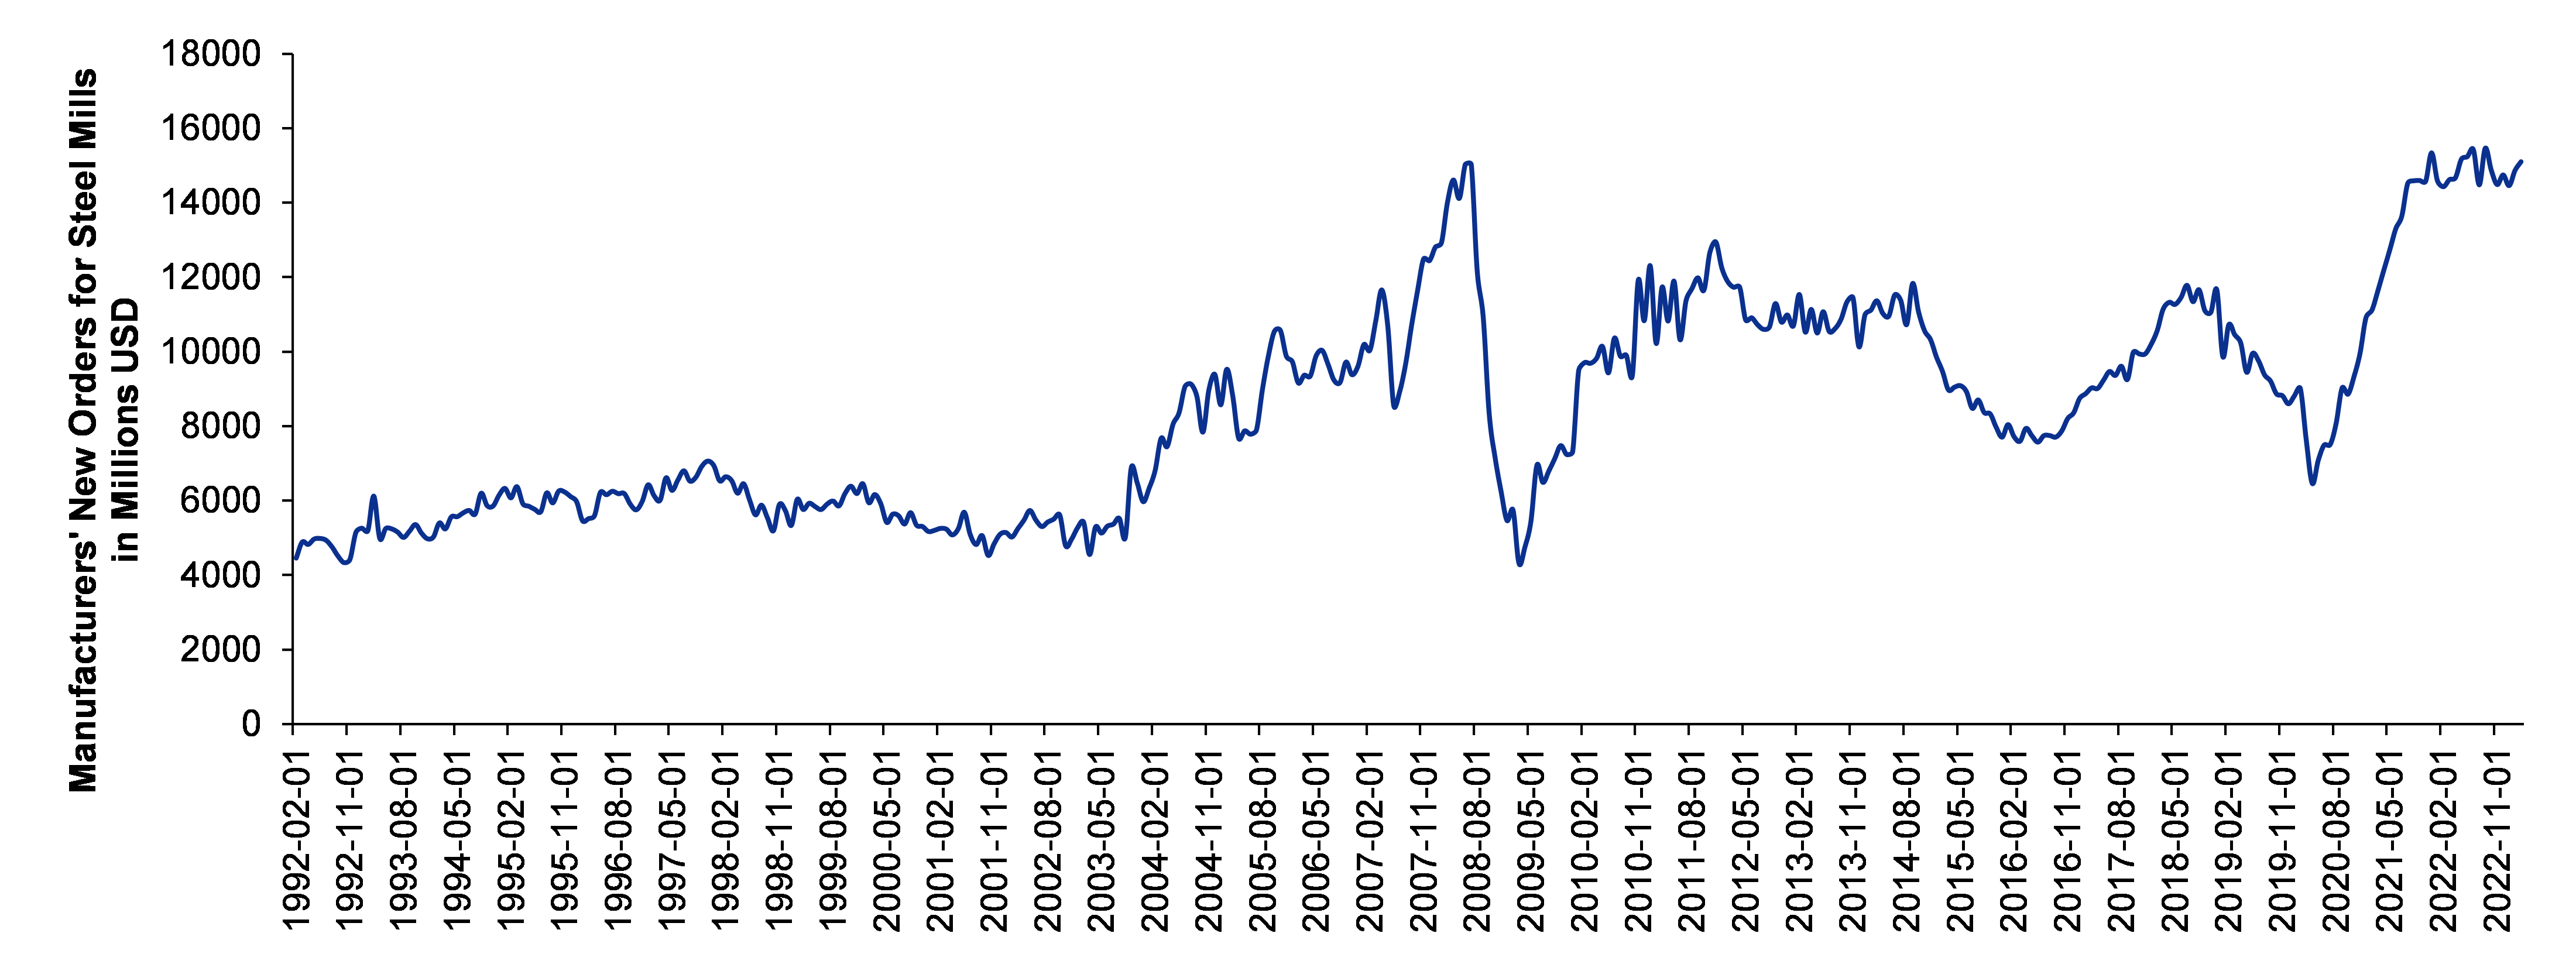
HEG, which manufactures graphite electrodes for steel manufacturing via the electric arc furnace or EAF route, is expected to see a rise in volume as the inventory at US steel mills declines. The monthly production data for US steel mills suggest a declining volume (YoY), from the beginning of this calendar year. However, the new order book for US steel companies has remained constant for the last one year (equal to the 2008 global financial crisis levels). Moreover, HEG’s foray into making anodes for lithium-ion batteries by FY25F will also be a growth trigger.

Global decarbonization trend is yet another positive for HEG

As the decarbonization trend catches up globally, the EAF route will be the preferred route for steel production. The industry is cyclical in nature, and it’s important to start at the beginning of an upcycle. We expect the graphite electrode cycle to play out in the next 12-18 months. However, in the medium term, muted Chinese demand will lead to some headwinds.

Significant entry barriers to protect margins

The graphite electrode business is one such industry which has significant entry barriers, mainly because of the technology required to manufacture the electrodes. In fact, Chinese players have been trying to replicate on the quality front, but to no avail. They still lag significantly behind global players, as a result of which companies like HEG can command a premium over their Chinese counterparts. In fact, there are only seven graphite electrode players in the world, namely Showa Denko, Graftech, HEG, Tokai, Graphite India, CK and SEC (ranked in order of their capacity).

We value HEG at 1.8x P/BV; initiate coverage with an ADD rating

HEG is likely to register a 6% volume CAGR over FY24F-26F, and in the meantime its RoE is expected to rise from 8.6% in FY23 to 12.2% in FY25F. We have assigned an ADD rating to the stock with a target price of Rs2,462 and a P/BV of 1.8x, 0.5 standard deviation (SD) from its historical mean of 1.3. Moreover, there was no capex addition by the global peers of HEG in the last decade, barring HEG itself which increased the capacity of its graphite plant from 80,000mt to 100,000mt, making it the single-largest graphite plant in the world.

Financial Summary
Mar-22A Mar-23A Mar-24F Mar-25F Mar-26F
Revenue (Rsm) 22,016 24,672 21,036 29,442 34,914
Operating EBITDA (Rsm) 7,515 6,197 7,363 11,188 13,267
Net Profit (Rsm) 5,354 3,464 4,175 6,626 8,057
Core EPS (Rs) 138.7 89.7 108.2 171.7 208.7
Core EPS Growth 4,877.5% (35.3%) 20.5% 58.7% 21.6%
FD Core P/E (x) 10.23 15.82 13.12 8.27 6.80
DPS (Rs) 3.1 39.9 31.1 31.1 31.1
Dividend Yield 0.22% 2.81% 2.19% 2.19% 2.19%
EV/EBITDA (x) 7.37 8.92 7.68 4.51 3.17
P/FCFE (x) 30.05 141.47 10.87 1,101.56 73.98
Net Gearing 1.8% 1.3% 3.7% (7.2%) (18.1%)
P/BV (x) 1.45 1.28 1.10 0.93 0.78
ROE 14.9% 8.6% 9.0% 12.2% 12.5%
% Change In Core EPS Estimates
InCred Research/Consensus EPS (x)
INCRED RESEARCH, COMPANY REPORTS, PRICED AS AT January 01, 0001

Decarbonization shift and dawn of a new era

HEG manufactures graphite electrodes. These electrodes are used in manufacturing steel via the electric arc furnace or EAF route (more on this subject later). HEG also has power plants for generating electricity that is consumed in the manufacture of graphite electrodes, thus acting as backward integration for the company.  What is important to note is the fact that the fate of this company is closely linked with the steel industry and the macroeconomic factors driving this industry. HEG caters to the Indian market (33% of sales) and exports its products to 30 other countries (66% of its sales). Its major export partners include the US, the Middle East, and Turkey. As far as US steel companies are concerned, their inventories are at an all-time high, which is impacting the sale of graphite electrodes in that country. It is also important to note that HEG sells lower-priced HP (high power) electrodes in India, whereas its exports mainly comprise higher-priced UHP (ultra-high power) electrodes and hence, this makes the US steel industry even more important. However, once the macroeconomic conditions improve, HEG has the potential to create value for its shareholders. The company’s investment in making graphite anodes for lithium-ion batteries, which would be operational by FY25F, could be a potential game changer, although it has certain risks.

Business analysis

Manufacturing of steel  

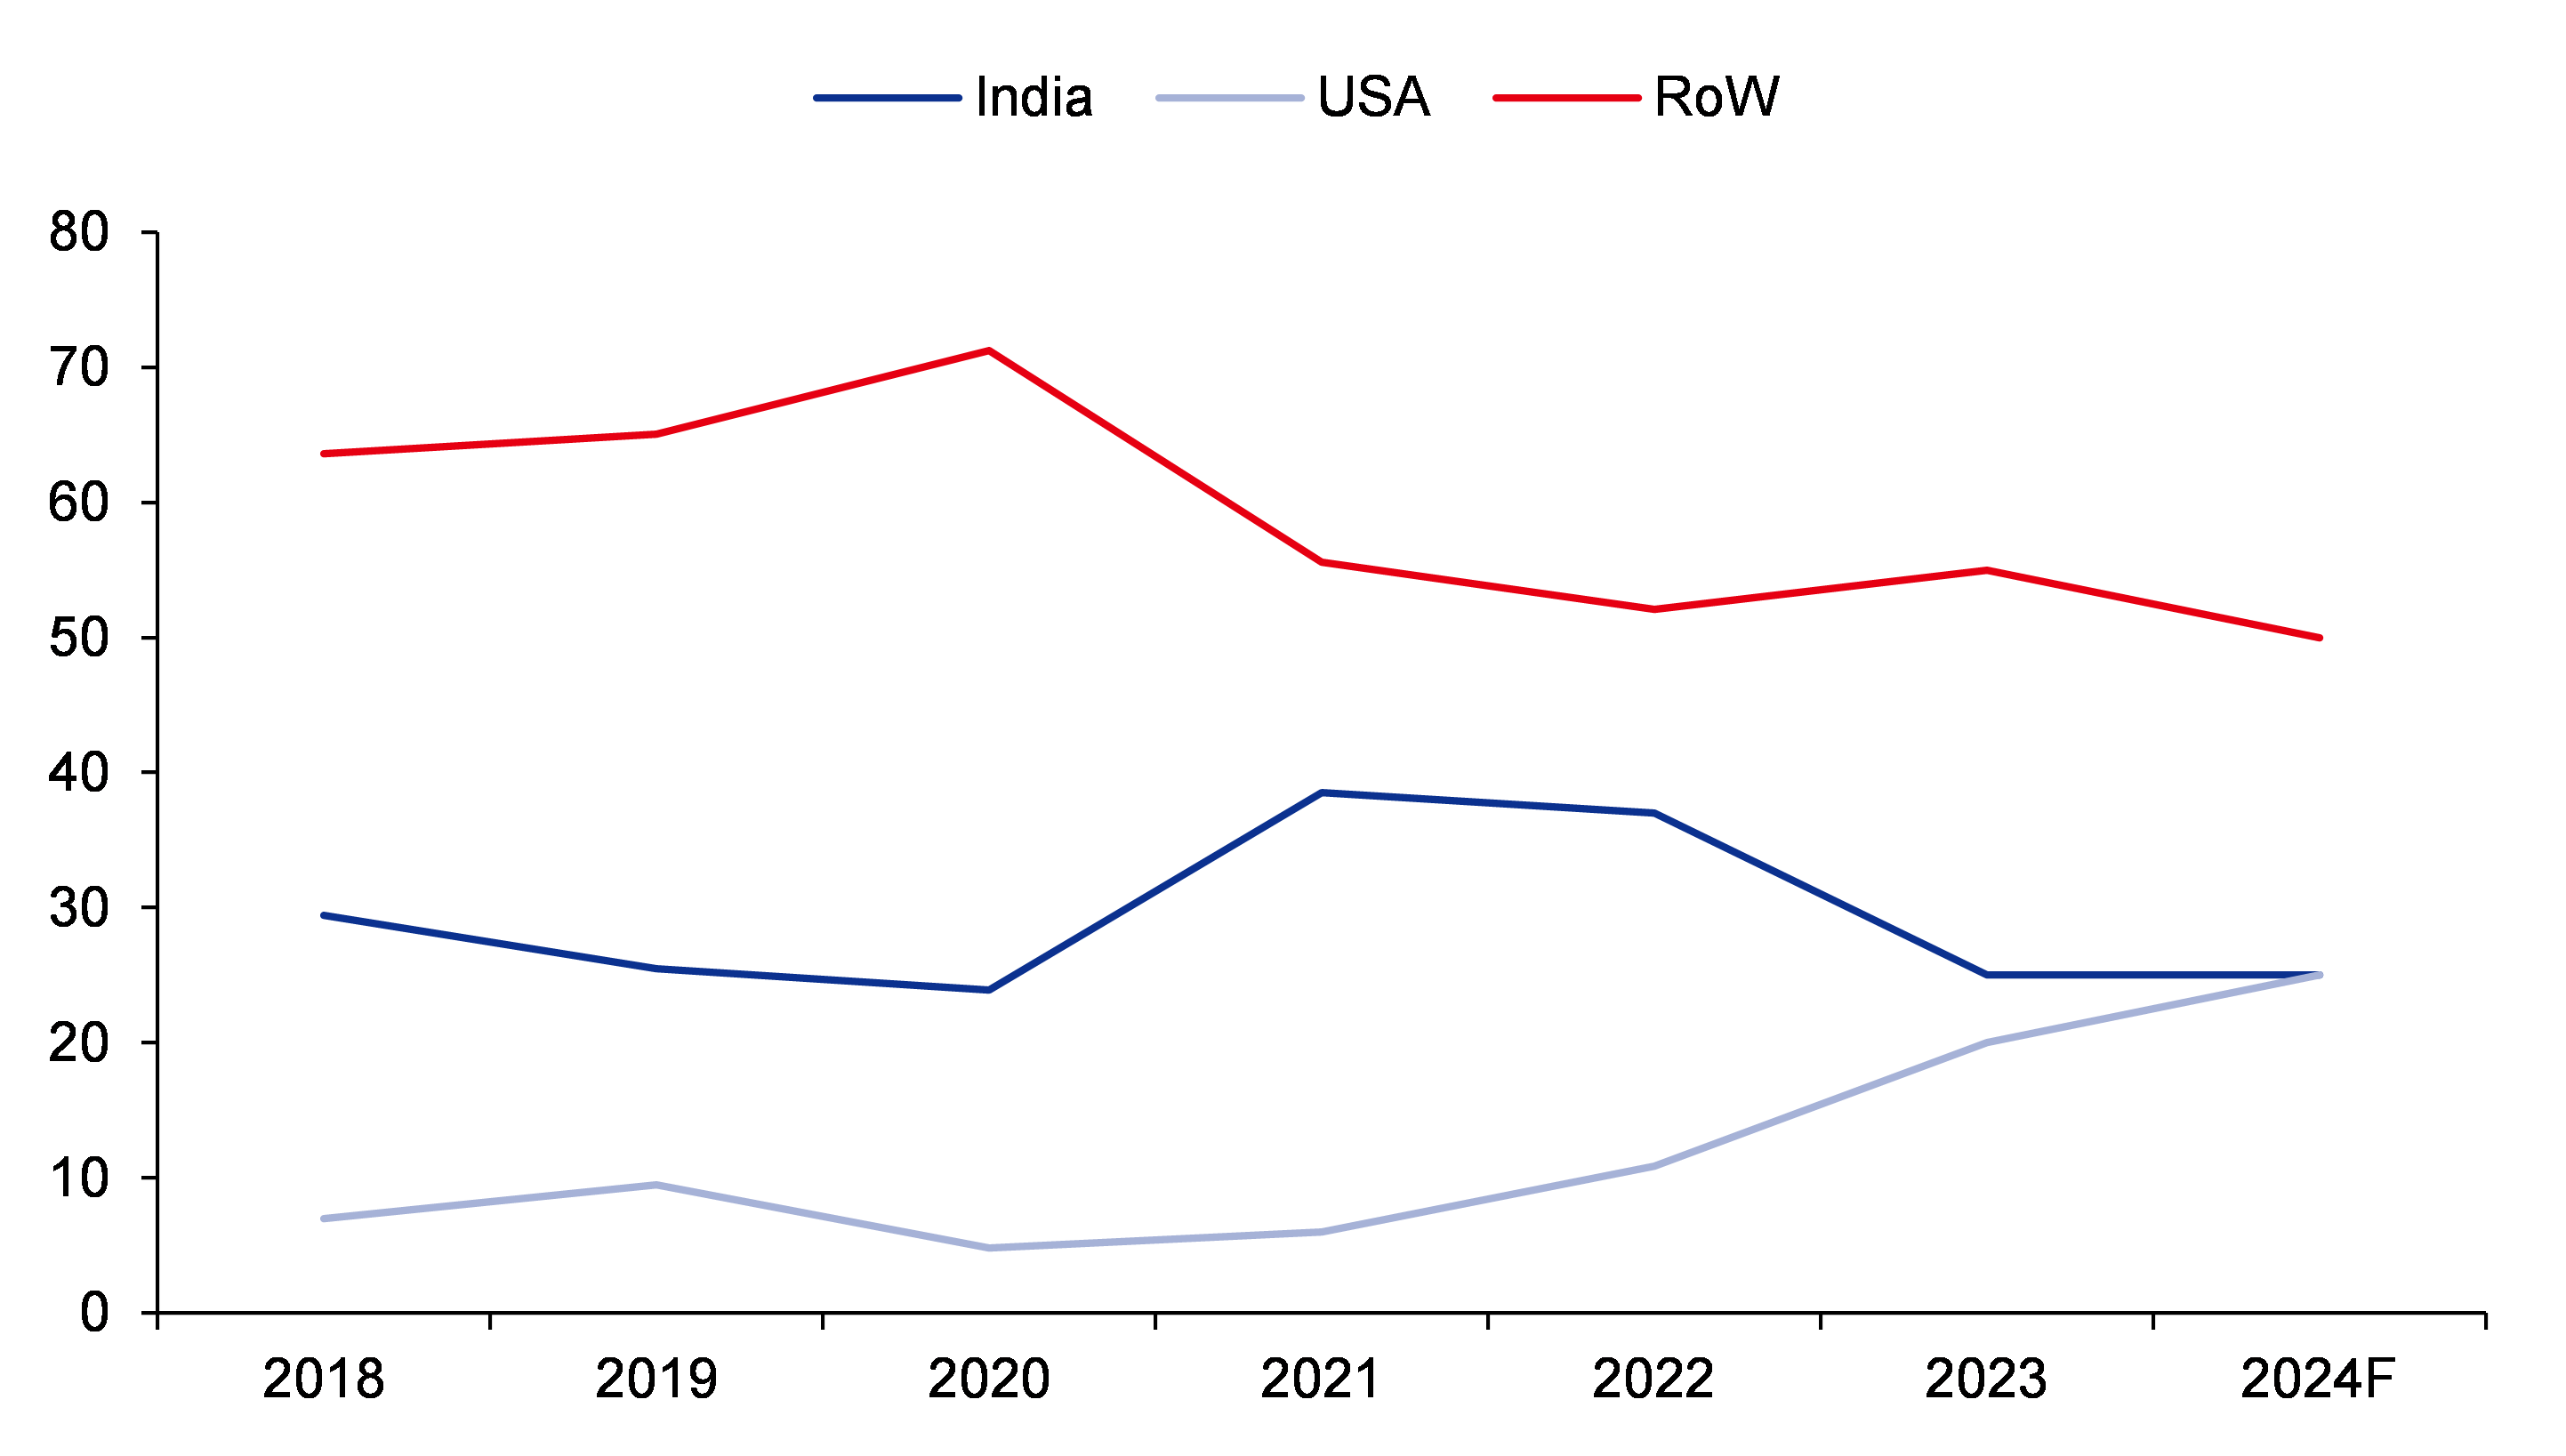
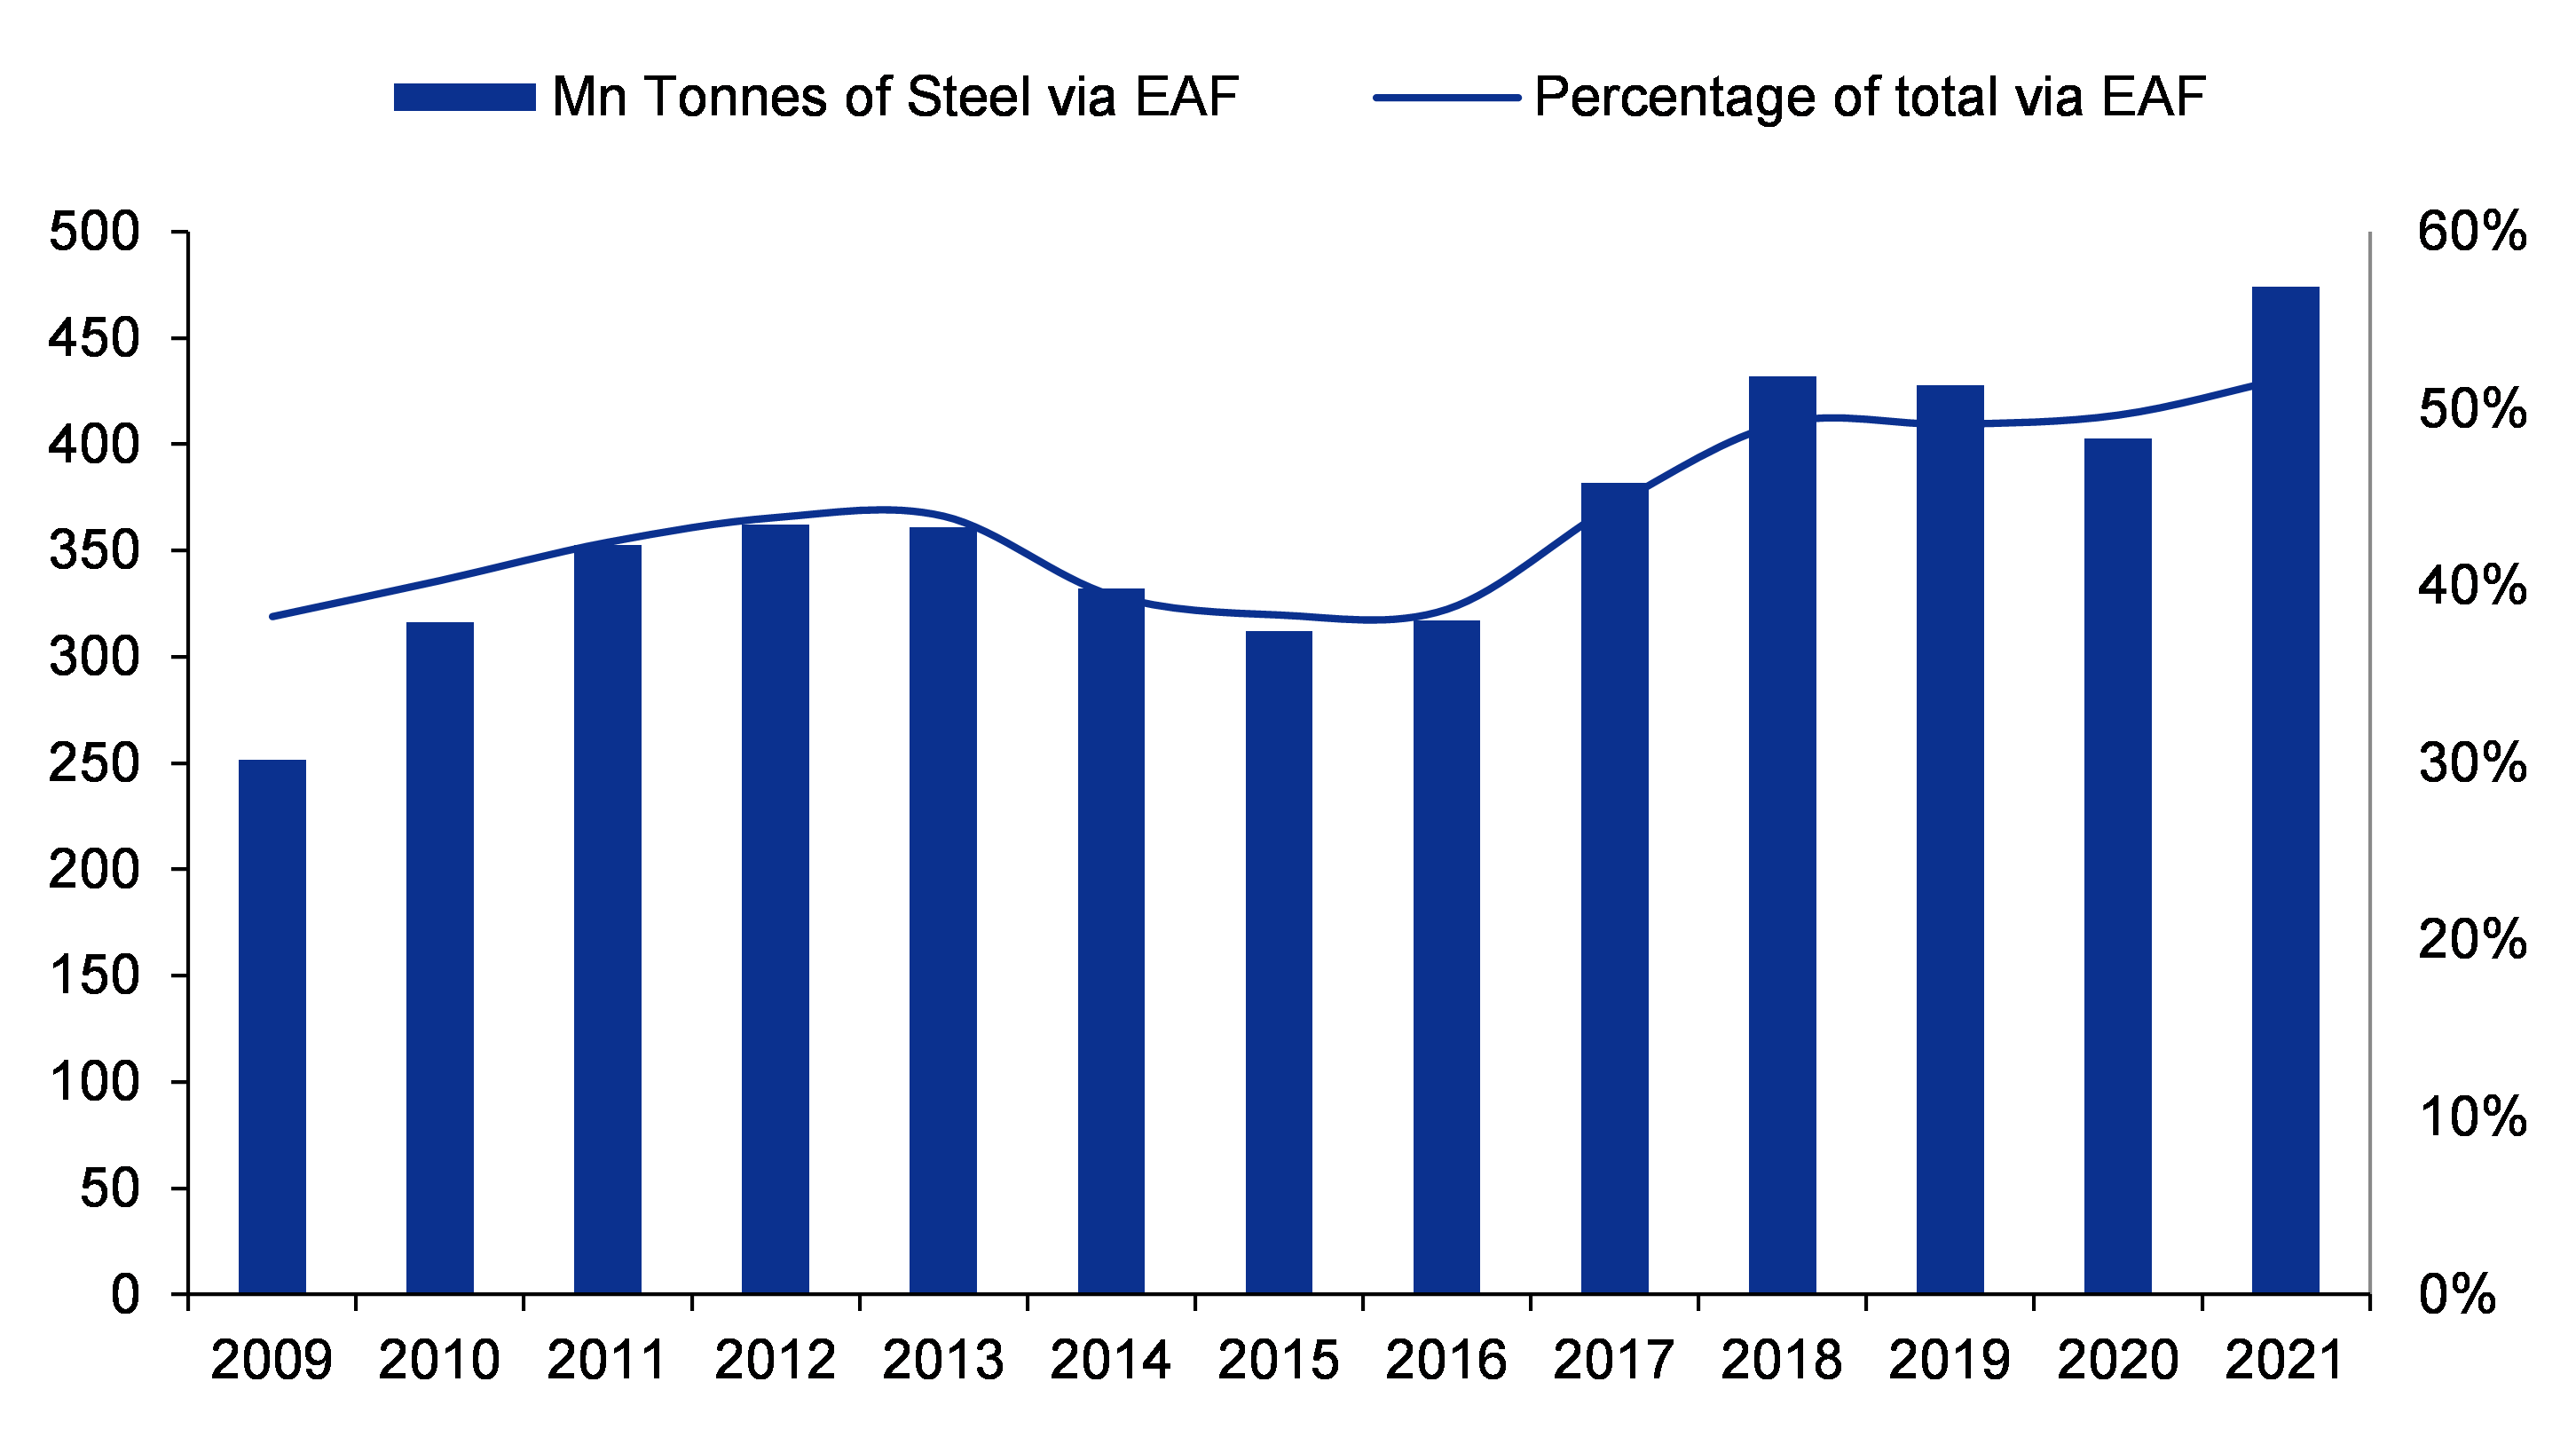
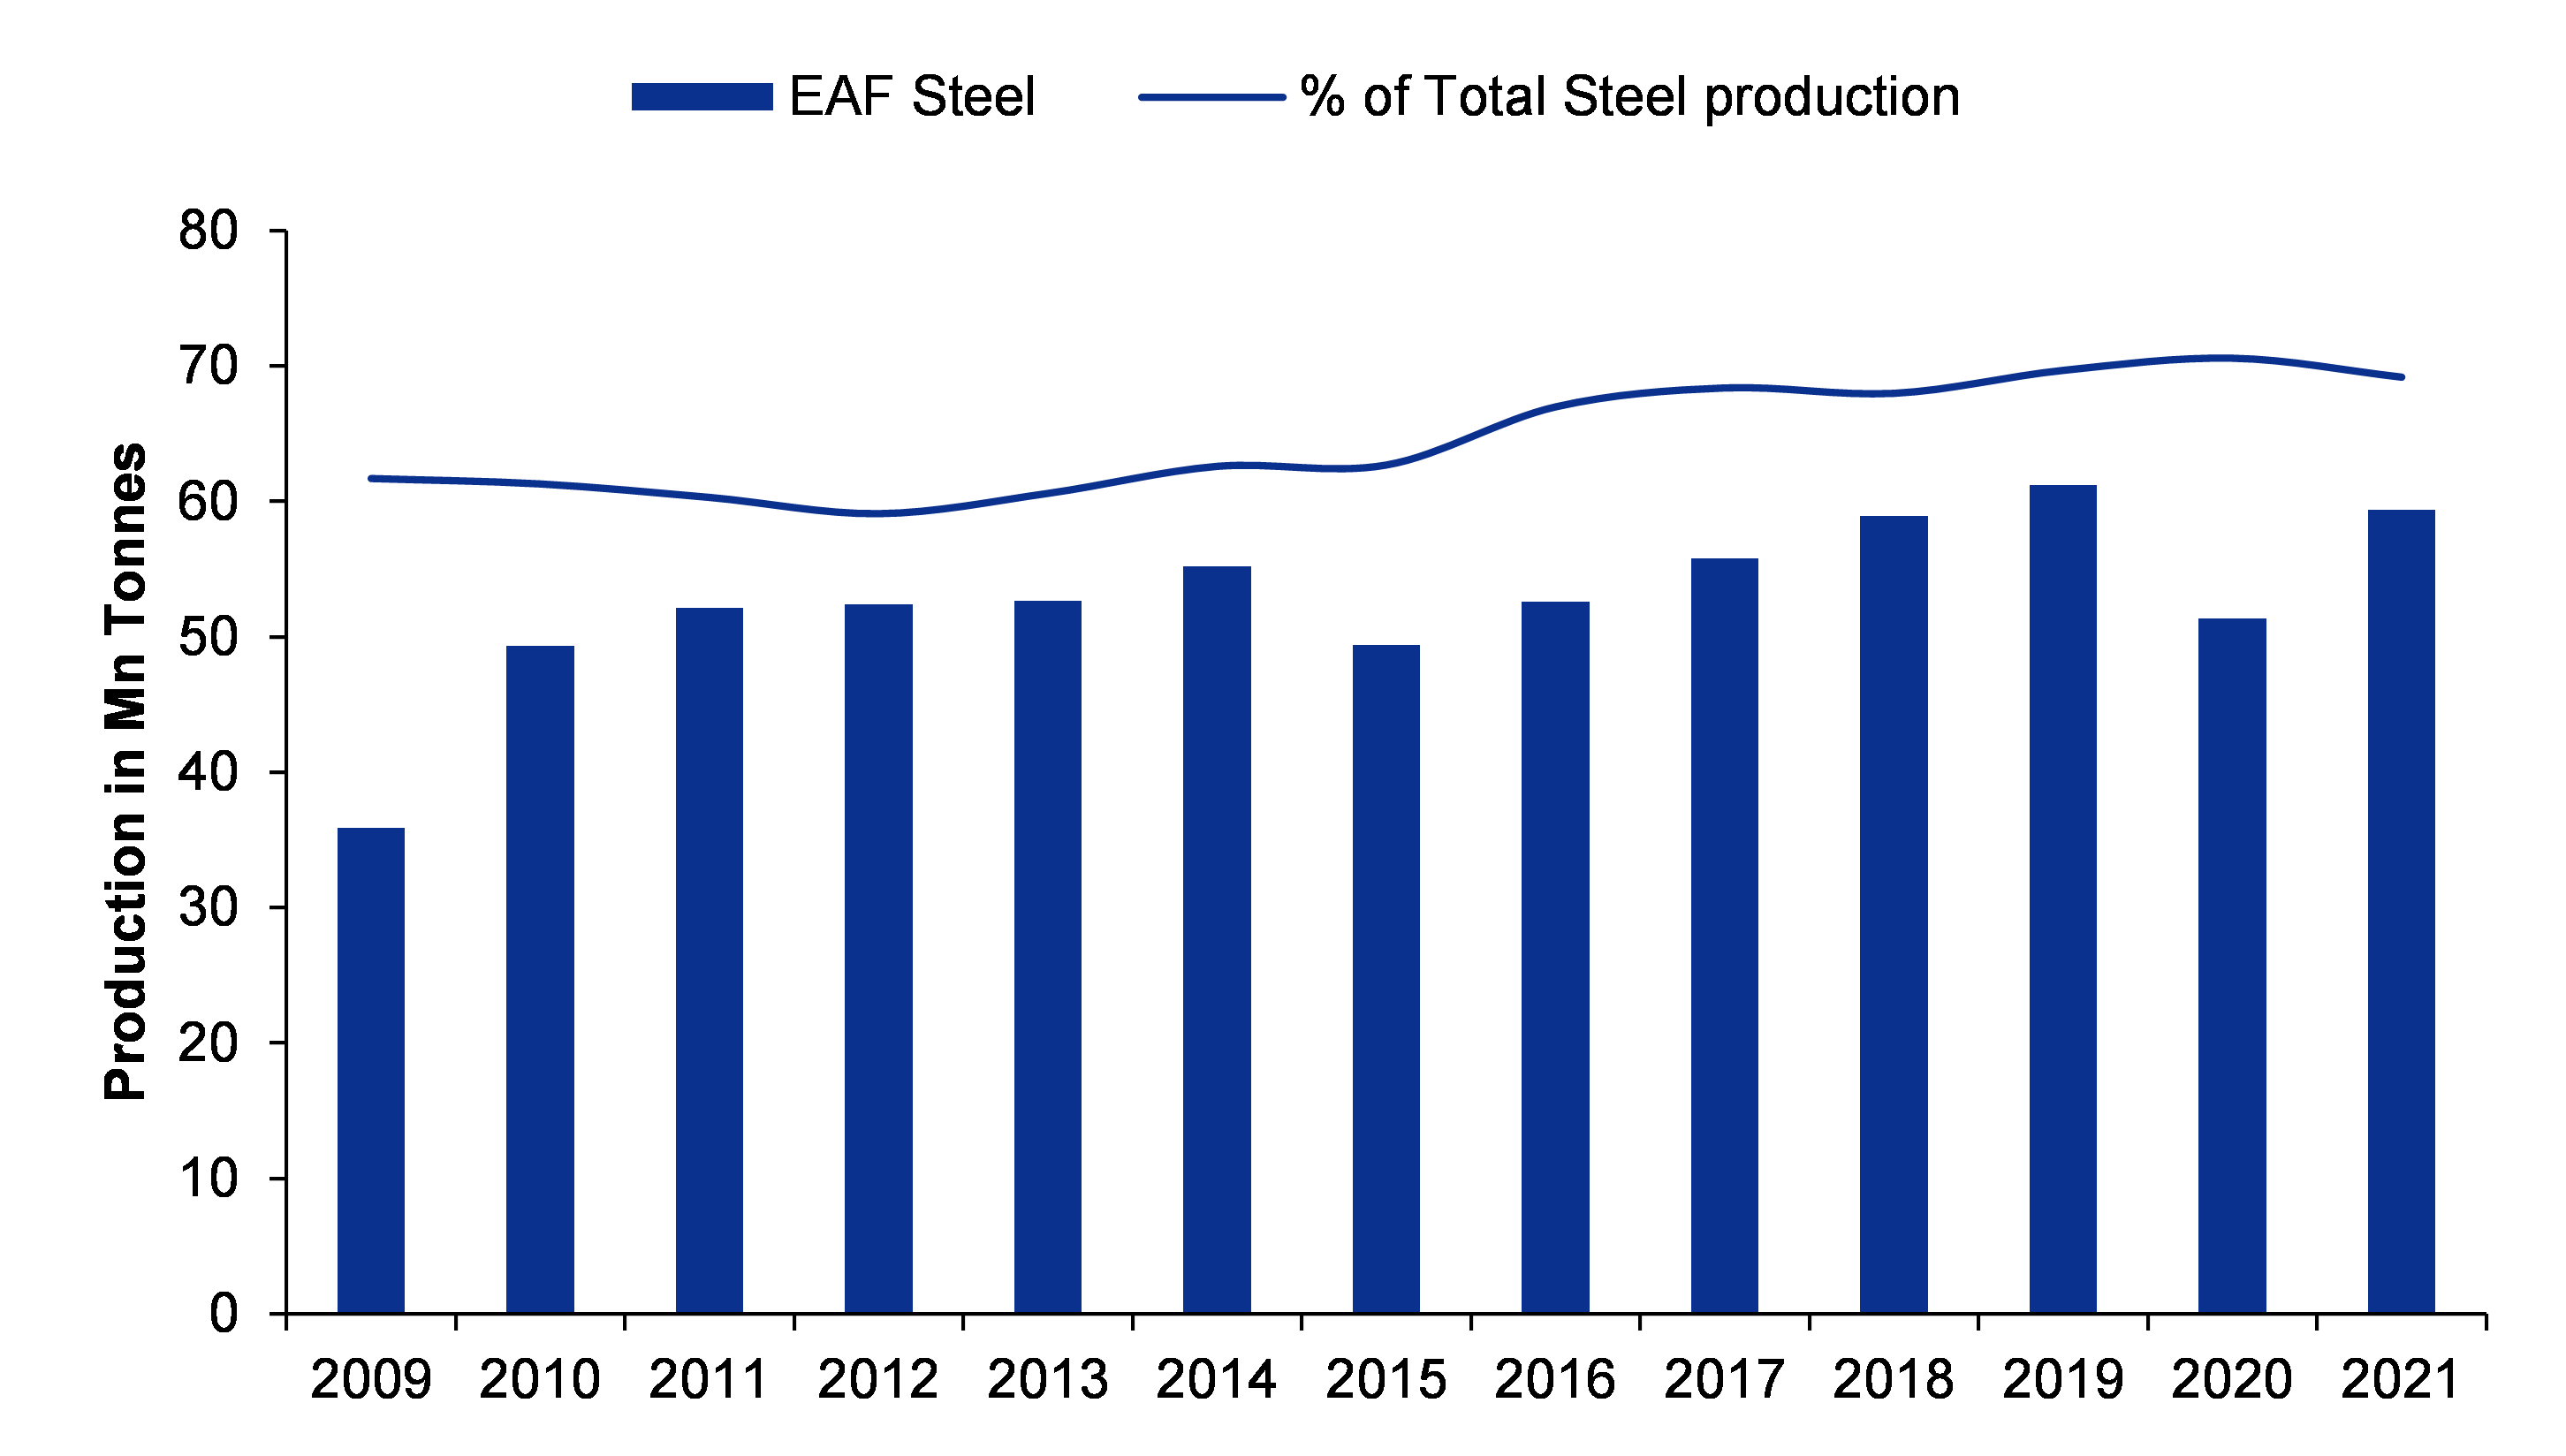
Steel can be manufactured in two ways – the electric arc furnace (EAF) route or the blast furnace (BF) route (also called basic oxygen furnace). Around 49% of the world’s steel (ex-China) is manufactured using the EAF route. In China, 89% of the steel is manufactured using the BF route and the remaining 11% is produced via the EAF route, which it plans to increase it to 25% (although the progress has been quite slow on that front). Outside China, EAF production accounts for a far greater proportion of overall steel production, with North America at around 70%, and Europe at 40%. As far as India is concerned, 25% of the steel is manufactured via the EAF route, and this percentage has remained constant for the last five years. To meet global climate goals, there’s a push to build more EAF capacity and develop even cleaner processes.

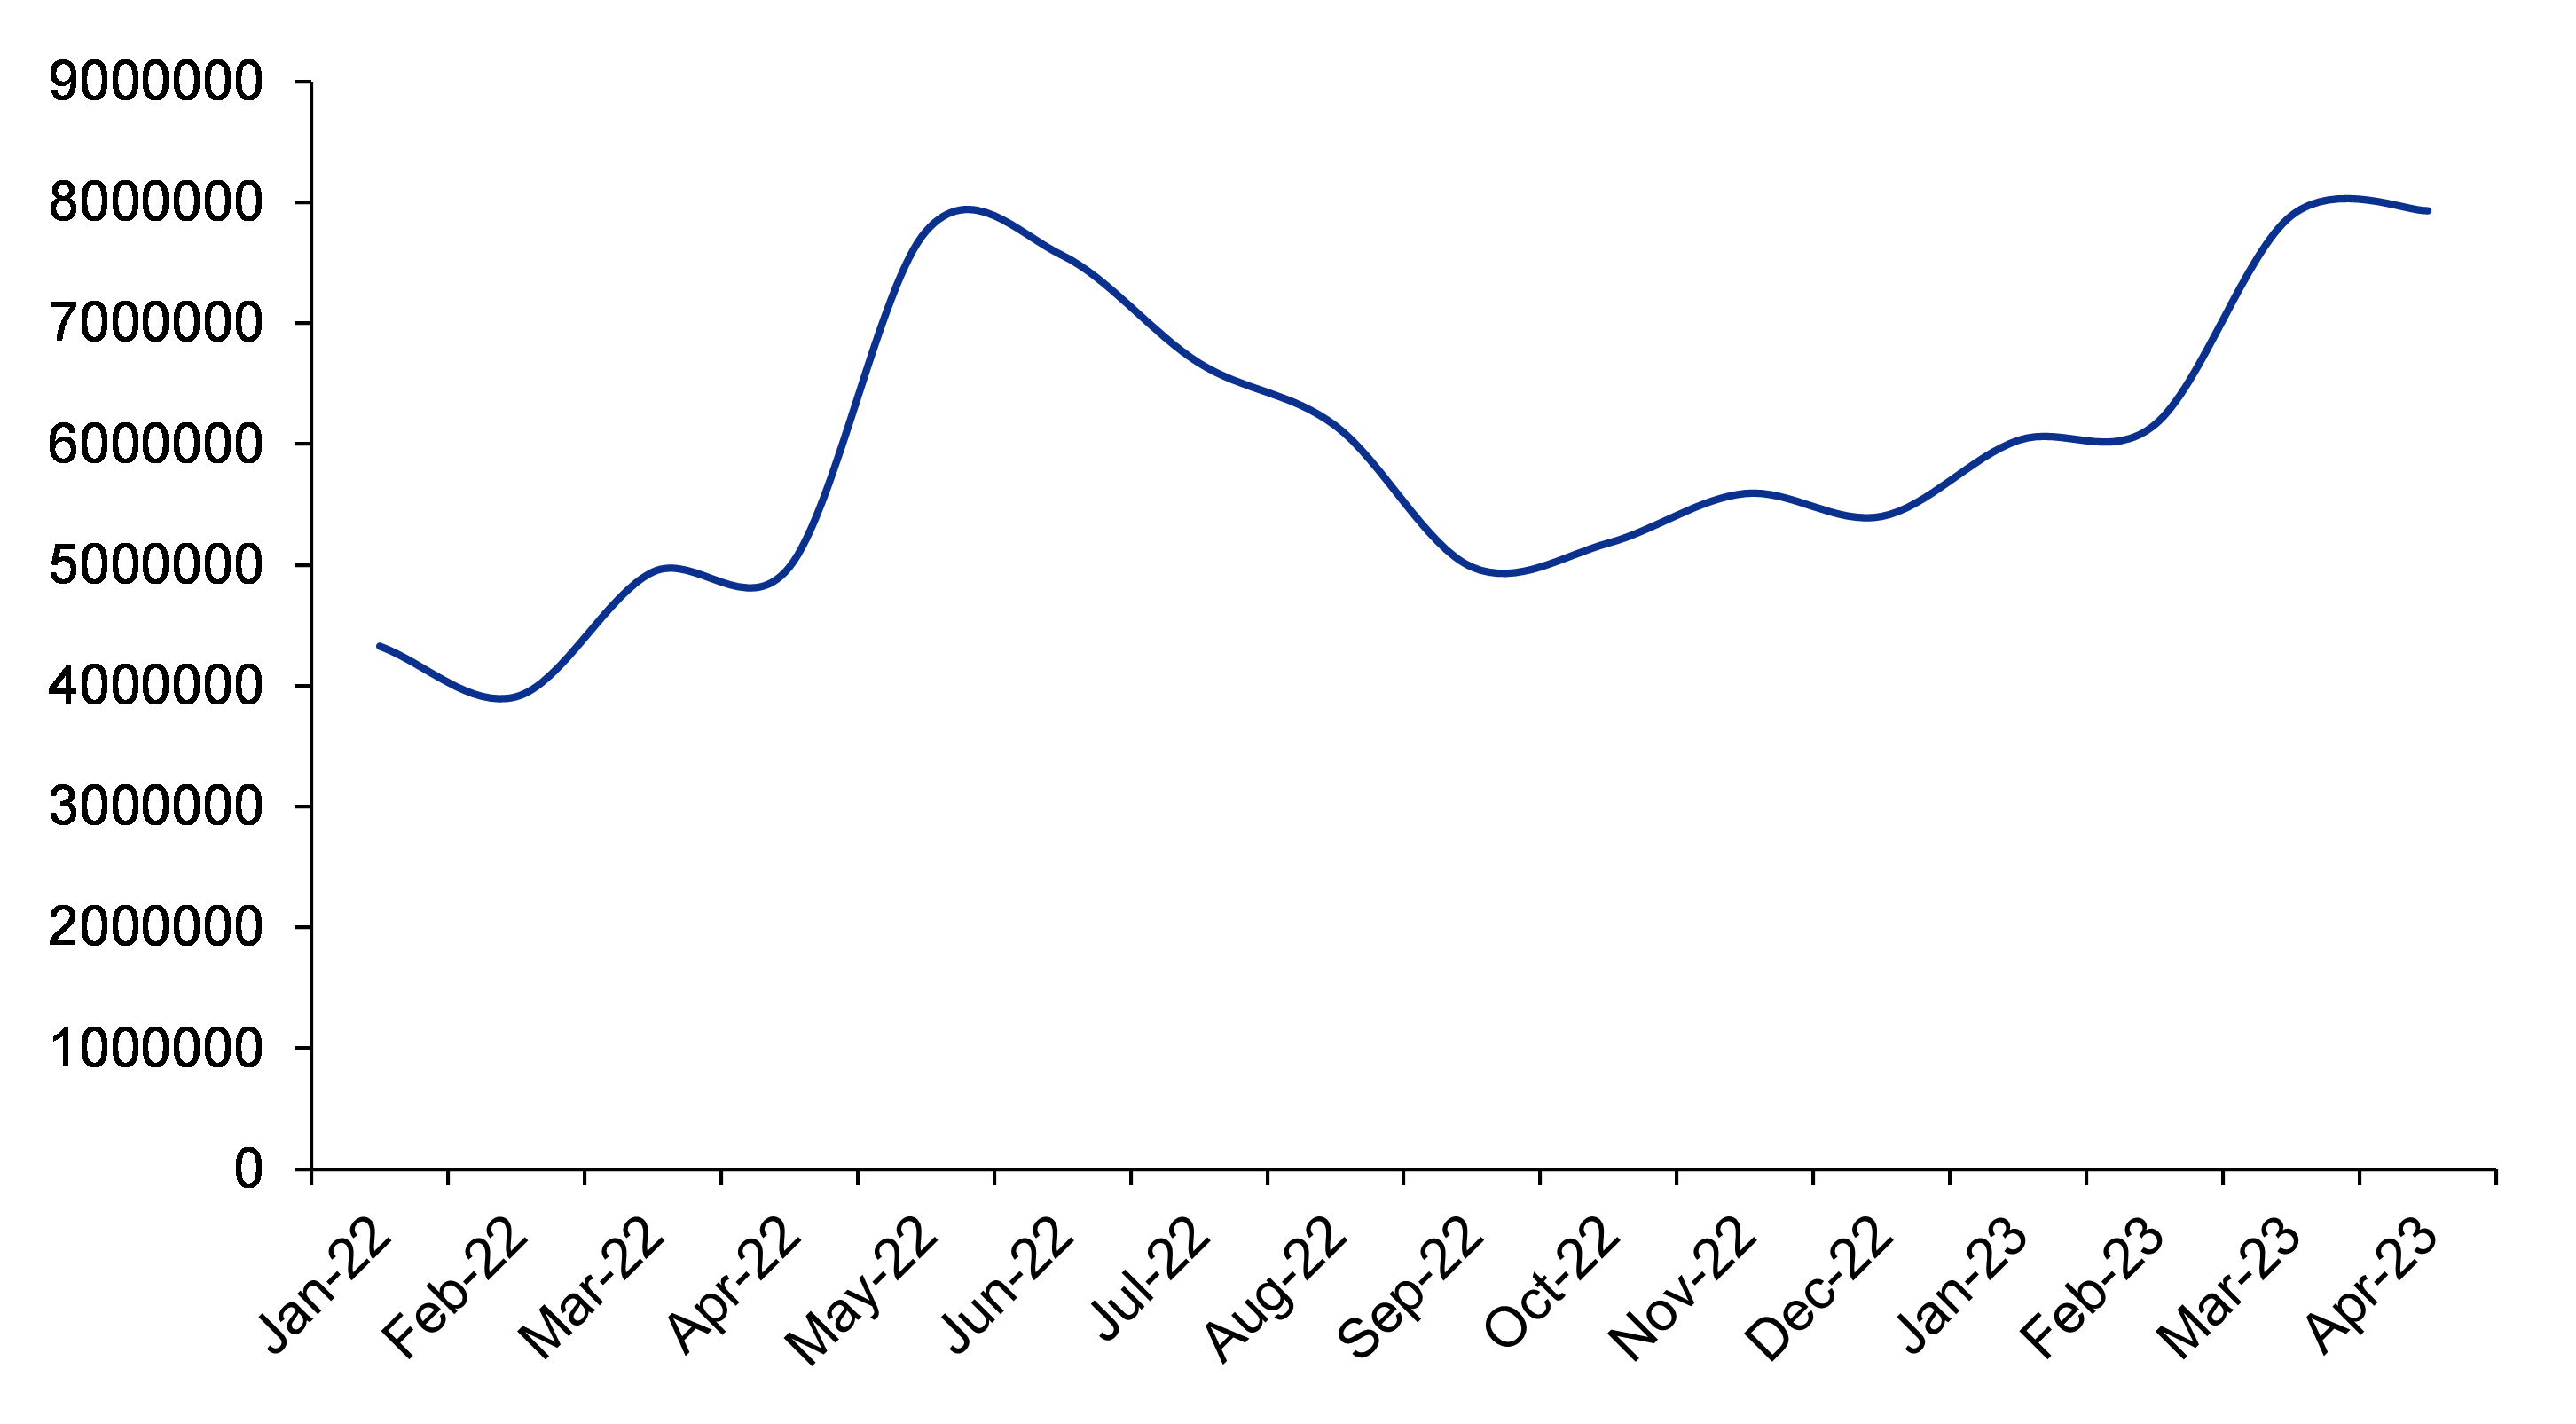
Figure 1: Location-wise revenue break-up for HEG - as we can see, sales to the US are rising consistently and have doubled in the last two years

SOURCE: INCRED RESEARCH, COMPANY REPORTS  


Figure 2: Steel manufactured via EAF route (ex-China)

SOURCE: INCRED RESEARCH, COMPANY REPORTS  

The blast furnace route - a polluting route

Blast furnace and electric arc furnace routes both produce identical quality steel. However, the amount of carbon released in the environment in both these processes is markedly different. Steel production is a major contributor to global CO2 emissions, accounting for 7% of the total emissions. Hence, it becomes imperative to decrease the carbon footprint, as far as steel manufacturing is concerned.

The difference in both these processes stems from the raw materials used in either case. The integrated steel-making route, based on the blast furnace method, uses iron ore, coking coal, limestone, and recycled steel. On an average, this route uses 1,370kg of iron ore, 780kg of metallurgical coal, 270 kg of limestone, and 125kg of recycled steel to produce 1,000kg of crude steel.

Coking coal is a key raw material in steel production via the blast furnace route. As iron occurs only as iron oxide in the earth’s crust, the ore must be converted, or ‘reduced’ using carbon. The primary source of this carbon is coking coal. Coke, made by carburizing coking coal (i.e., heating in the absence of oxygen at high temperatures), is the primary reducing agent of iron ore. Coke reduces iron ore to molten iron saturated with carbon, called hot metal.

Around 1bn tonne (1bnt) of metallurgical coal is used in global steel production, accounting for around 15% of the total coal consumption worldwide. Coal reserves are available in almost every country worldwide, with recoverable reserves in around 80 countries. Although the biggest reserves are in the US, China, Russia, Australia and India, coal is actively mined in more than 70 countries. China is by far the biggest producer of coking coal in the world. Australia dominates metallurgical coal exports, accounting for about 200mt of the total 310mt metallurgical coal exports globally.

Around 30% coal can be saved by injecting fine coal particles into the blast furnace through a technology called pulverized coal injection (PCI). 1t of PCI coal used for steel production displaces around 1.4t of coking coal. The coal used for pulverized coal injection into blast furnaces has more narrowly defined qualities than the steam coal used in electricity generation.

EAF is the greener alternative to make steel  

The electric arc furnace (EAF) route uses primarily recycled steel and electricity. On average, the recycled steel-EAF route uses 710kg of recycled steel, 586 kg of iron ore, 150kg of coal and 88kg of limestone and 2.3GJ of electricity, to produce 1,000kg of crude steel. It is to be noted that recycled steel is used in both the processes, but in varying quantities. It has a peripheral use in the blast furnace route; however, it is the most important raw material under the EAF route.

EAFs can be charged with up to 100% recycled steel and basic oxygen furnaces with approximately 30% of such steel. Recycling this steel accounts for significant energy and raw material savings: over 1,400kg of iron ore, 740kg of coal, and 120kg of limestone is saved for every 1,000kg of steel scrap made into new steel.

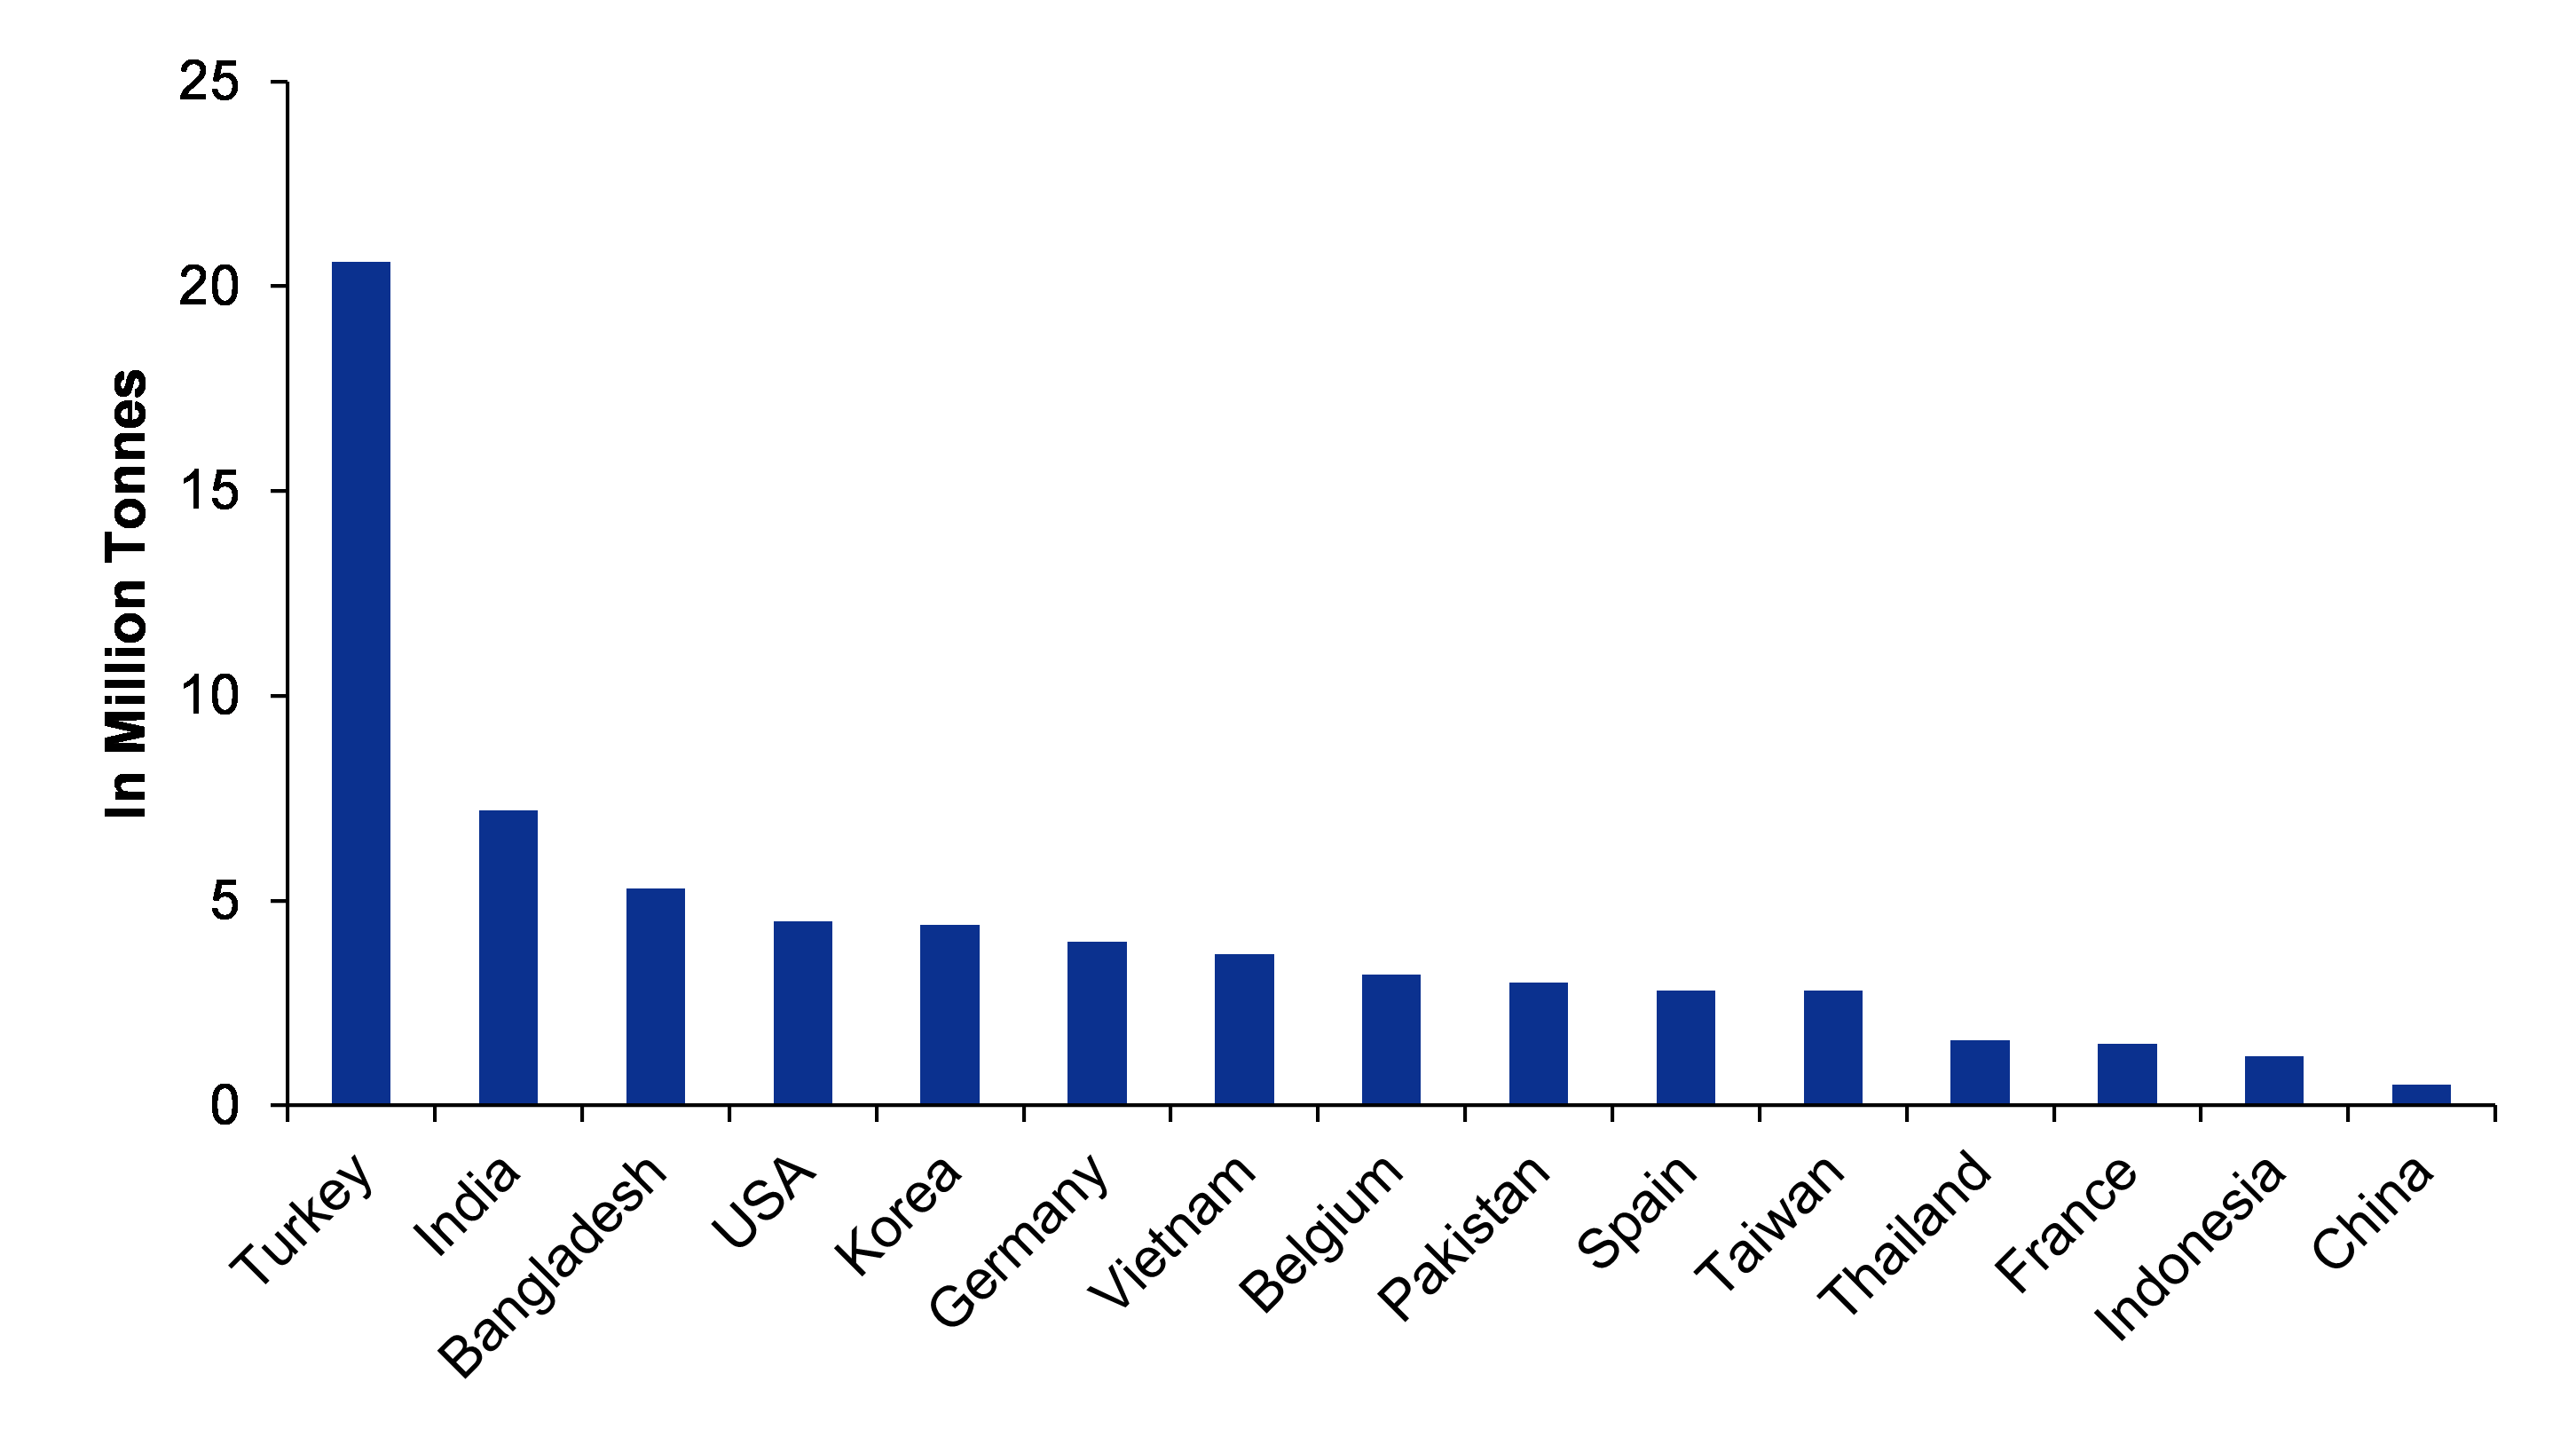
What complicates the matter for the EAF route is the availability of scrap steel, which is a major hurdle in developing countries like India and China adopting the EAF route. As developing countries mostly use all their steel, thus generating limited scrap, they have to import most of the scrap, thereby increasing the raw material cost. Moreover, as an EAF also requires electricity for power generation, the rising electricity cost problem, exacerbated by the Russia-Ukraine war, rendered almost all EAF plants unprofitable.

To counter this, developing countries like China are opting for increasing the percentage of short steel over long steel in their annual steel production. China is aiming to move the ratio up to 20% by 2030F, compared with 10% in 2020. Short steel refers to literally short lengths of steel -- typically less than 3 feet in length. Short steel is paid more than long steel because it is easier to handle, separate and ship.

The short steel production process, which uses scrap as a feedstock, emits less sulfur dioxide and nitrogen oxide than the long steel production process. The short steel production process has also an economic edge over the long steel production process, as the investment cost for short steel production is only around 7%-8% of the cost for long steel production, while the per tonne environment protection operation cost is also just one-eighth of the cost of long steel production.

Further, there are also quality issues with scrap steel, as not all scrap can be used for steel production. Metal scrap is classified into two categories: shredded scrap and non-shredded scrap. Shredded metal scrap refers to metal scrap that has been mechanically processed into small pieces or shreds. Shredded metal scrap is often used as a raw material in steel production. As obvious as it gets, it is easier to convert short steel into shredded scrap. Non-shredded metal scrap refers to metal scrap that has not been processed into small pieces or shreds. Non-shredded metal scrap includes railway tracks, pipes, and plates.

Figure 3: Top steel scrap-importing countries - as you can see, the majority in this list are developing nations with Turkey leading the pack, as it produces 100% of its steel via the EAF route

SOURCE: INCRED RESEARCH, COMPANY REPORTS  


Adjusted for carbon cost, EAF is a much cheaper route to produce steel  

Figure 4: Cost analysis for producing 1 tonne of steel via the blast furnace route - please note the high carbon credit cost

Item

Unit

Factor

Unit Price ($)

Cost ($ per tonne)

Iron Ore

tonne

1.5

117.4

177.15

Iron Ore Transport

tonne

1.5

99.08

149.51

Coal

tonne

0.8

194.3

165.15

Coal Transport

tonne

0.8

8.34

7.08

Steel Scrap

tonne

0.1

399.25

59.08

Steel Scrap Delivery

tonne

0.1

5

0.74

Industrial Gases

cubic m

170

0.27

45.9

Ferro Alloys

tonne

0.01

1496.97

20.95

Fluxes

tonne

0.5

67.66

35.45

Refractories

tonne

0.005

1837.66

9.18

Other Costs

unit

1

23.67

23.67

By-product Credits

unit

1

-14.09

-14.09

Thermal Energy

GJ

-6.3

9.16

-58.17

Electricity

Mwh

0.13

143.41

19.50

Carbon Emission

tonne

2.1

90

197.1

Labour Cost

hours

0.5

43.97

25.72

Capital Charges

unit

1

64.89

64.89

Total


928.86


SOURCE: INCRED RESEARCH, COMPANY REPORTS  


Figure 5: Cost analysis for producing 1 tonne of steel via the electric arc furnace route - please note that steel scrap acts as the major raw material

Item

Unit

Factor

Unit Price ($)

Cost ($ per tonne)

Steel Scrap

tonne

1.117

399.25

445.96

Steel Scrap Transport

tonne

1.117

5

5.58

Industrial Gases

cubic m

56

0.25

14

Ferro Alloys

tonne

0.016

0.27

0.004

Fluxes

tonne

0.066

194.28

12.82

Electrodes

tonne

0.001

4414.46

4.41

Refractories

tonne

0.006

1837.66

11.02

Other Costs

unit

1

16.24

16.24

Thermal Energy

GJ

-0.065

9.16

-0.59

Electricity

MWh

0.441

143.41

63.24

Carbon emission

tonne

0.026

90

2.34

Labour Cost

hours

0.286

43.97

12.57

Capital Charges

unit

1

31.32

31.32

Total


618.93


SOURCE: INCRED RESEARCH, COMPANY REPORTS  

Carbon cost is rising in the world, which makes EAF a viable alternative choice to make steel  

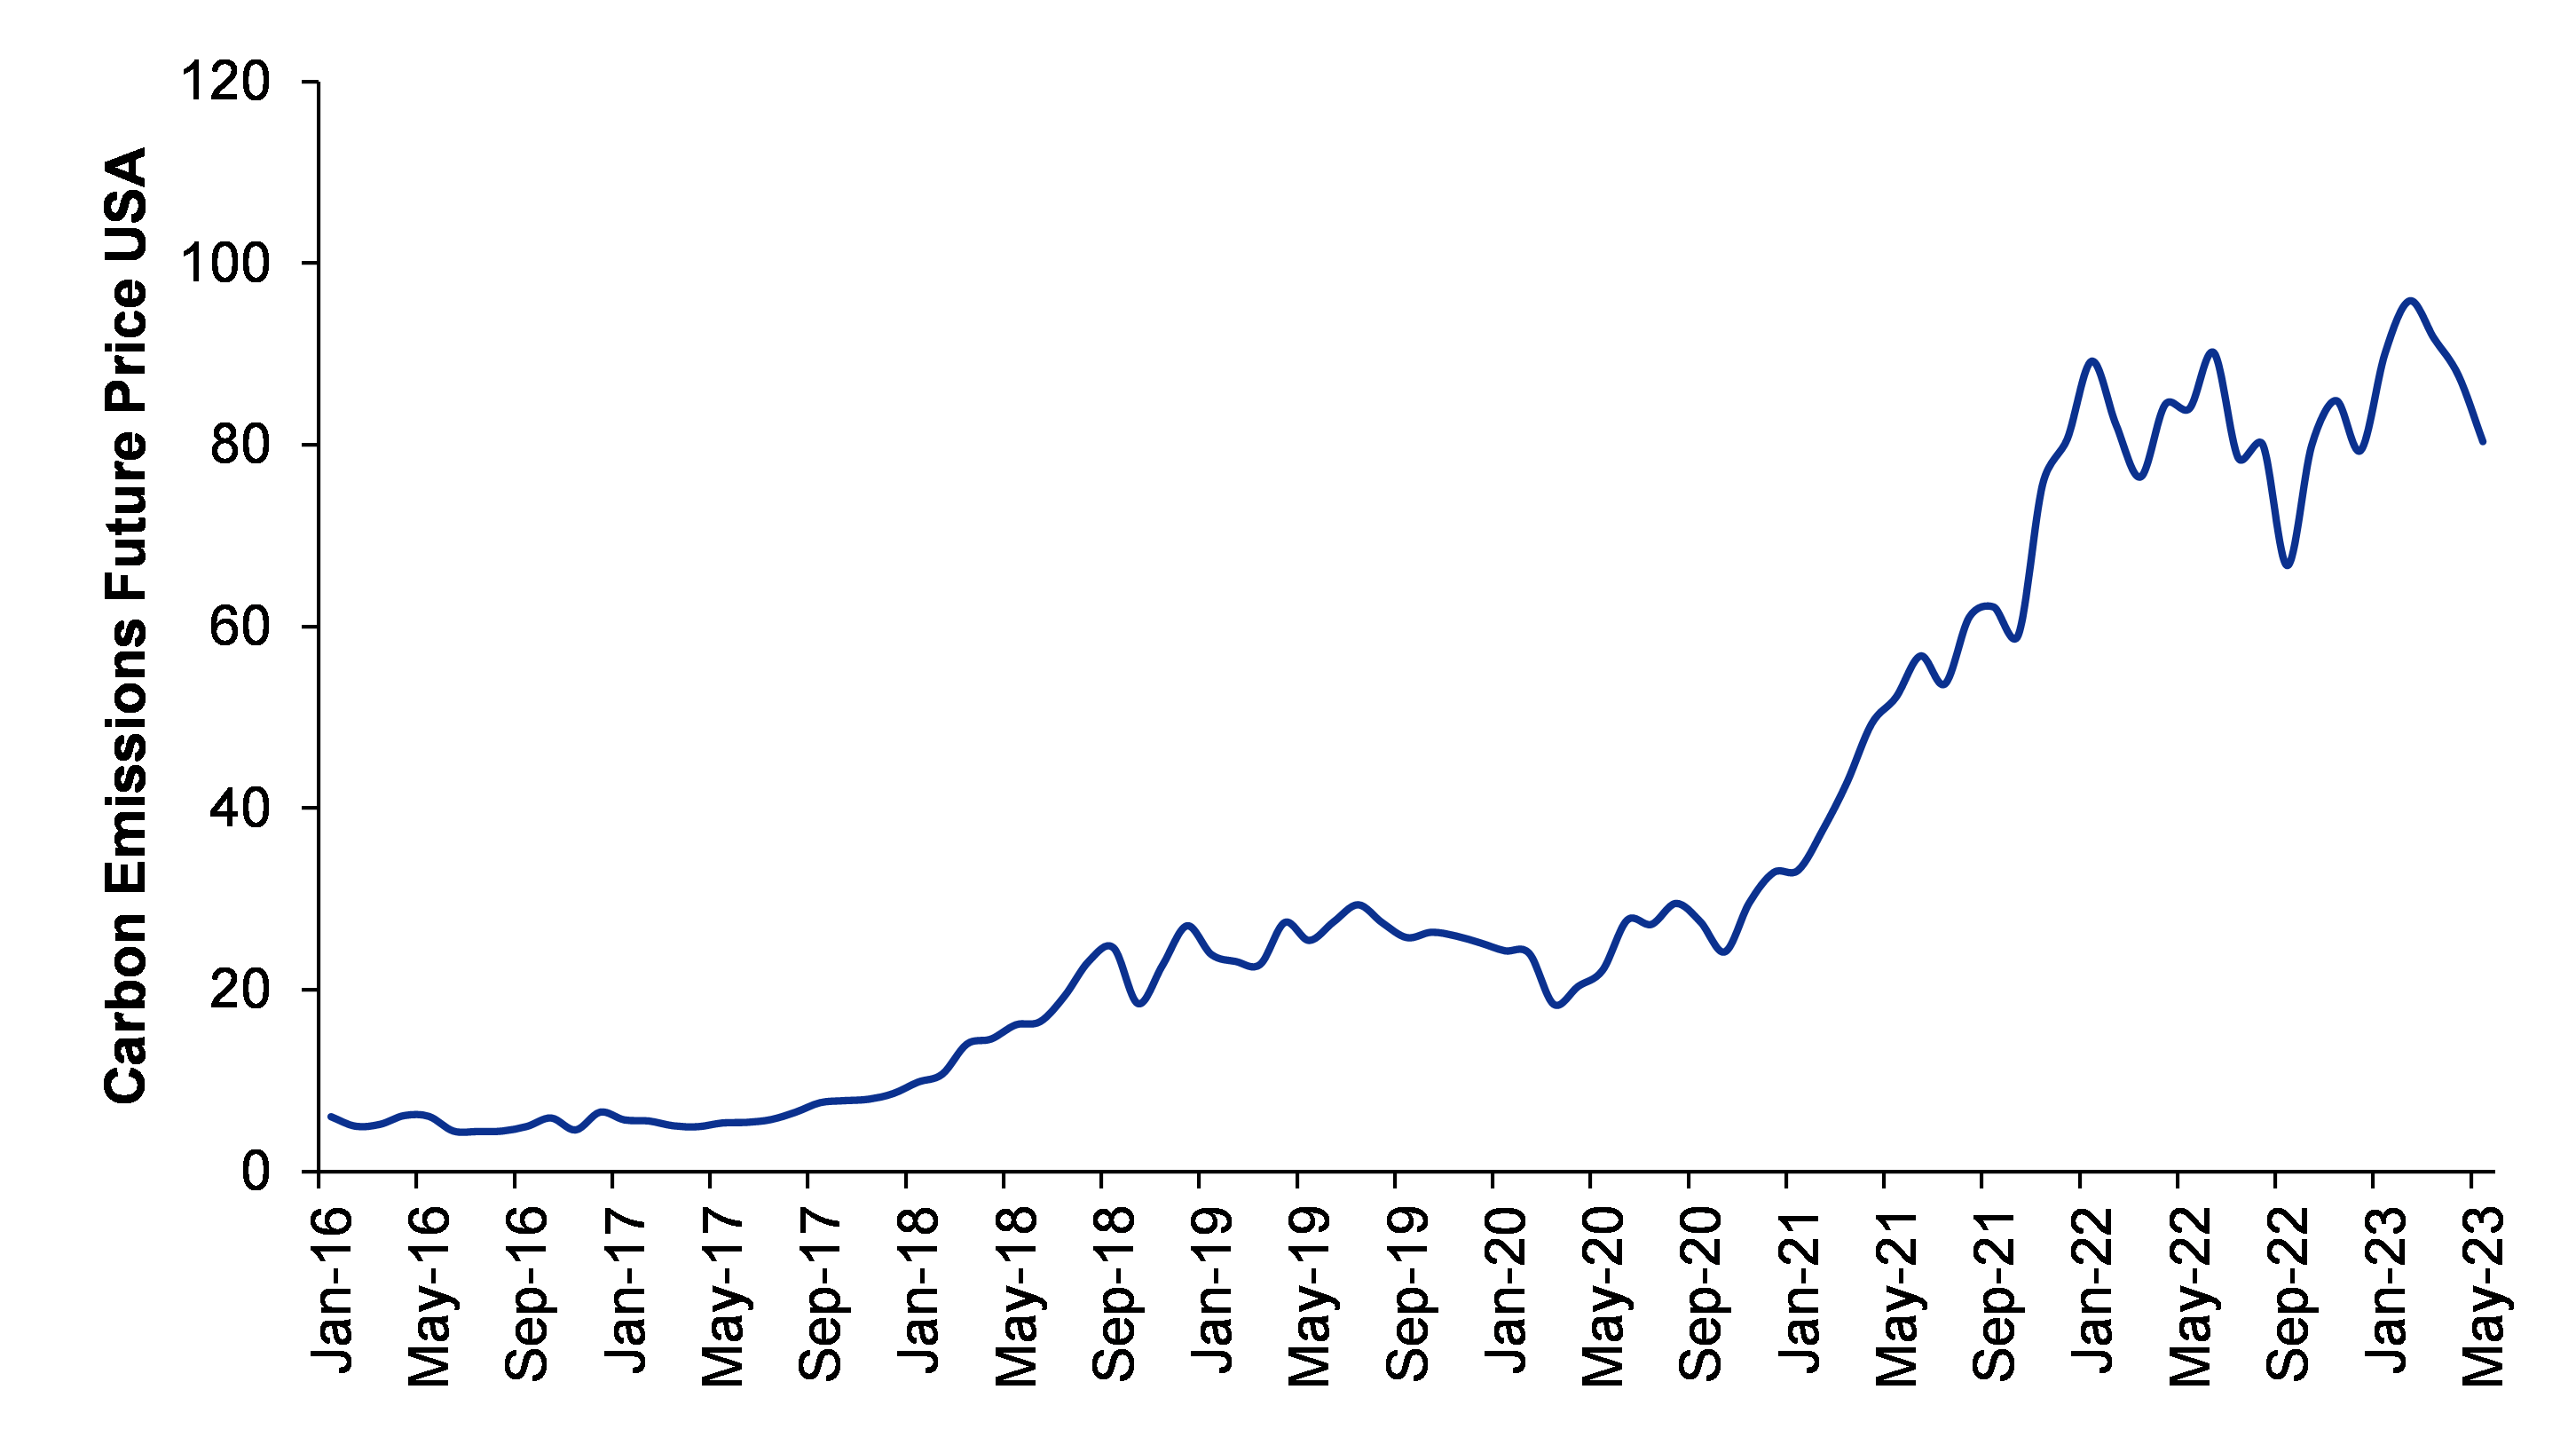
As we can see, in the case of blast furnace route, iron ore and coal are the main determinants for determining the price/tonne. However, even lower iron ore and coal costs will be offset by particularly high carbon credit cost. Hence, everything else being constant, a steel mill using the EAF route will enjoy a higher spread of around US$195/t, compared to the BF route.

Figure 6: Carbon emission futures price in the US; one carbon emission future allows the emission of 1t carbon dioxide

SOURCE: INCRED RESEARCH, COMPANY REPORTS  

HEG manufactures the graphite electrode which is an essential part of EAF

On going through the raw materials required for producing steel via the EAF route, a relatively minute but significant raw material is the graphite electrode.

Graphite electrodes are the principal heating materials in an EAF. They are currently the only products that possess a high level of electrical conductivity and capability of sustaining extreme heat generated in an EAF. They are also used in ladle furnaces (used for refining and other smelting processes). As a result, the steel industry accounts for more than 90% of the global demand for graphite electrodes.

Graphite electrode channelizes electrical energy from the power supply to the supply melt in the EAF tank. The key raw material to make graphite electrodes is needle coke, coal tar pitch and some additives.

During the years 2010-17, electrode prices dropped to unviable levels due to lower demand compared to their capacity. As a result, six plants in the western world closed, thereby taking out 200,000t of excess capacity. When the capacity got balanced, came the sudden clampdown on the steel industry and the graphite industry in China over pollution concerns. As the western world’s electrode capacity was already balanced with demand because of closures and also as the western world’s steel plants started producing more due to a drop in steel exports from China, there was a sudden spurt in demand for electrodes which led electrode prices to shoot up.

In 2021, resurgence in the demand for graphite electrodes continued to strengthen as the fortunes of the steel sector across the world improved. What was more pertinent was that steel production across the world, other than China, rose at a healthy pace. This segment of the steel industry produces a large quantity of steel using the EAF route. As a result, the demand for graphite electrodes continued to scale northwards.

The BF method requires 0.2kg to 0.3kg of graphite electrodes to make 1t of steel (not used in the main furnace but as a peripheral raw material - there is a name for such type of electrodes, but we will come to that later). The EAF method, on the other hand, needs around 1.7kg to 1.8kg of it to produce the same quantity of steel (used in the main furnace).


Figure 7: Graphite electrode prices (in US$/t) from 2014 to 2018 - they saw a rapid rise due to pollution-related clampdown in China

SOURCE: INCRED RESEARCH, COMPANY REPORTS  


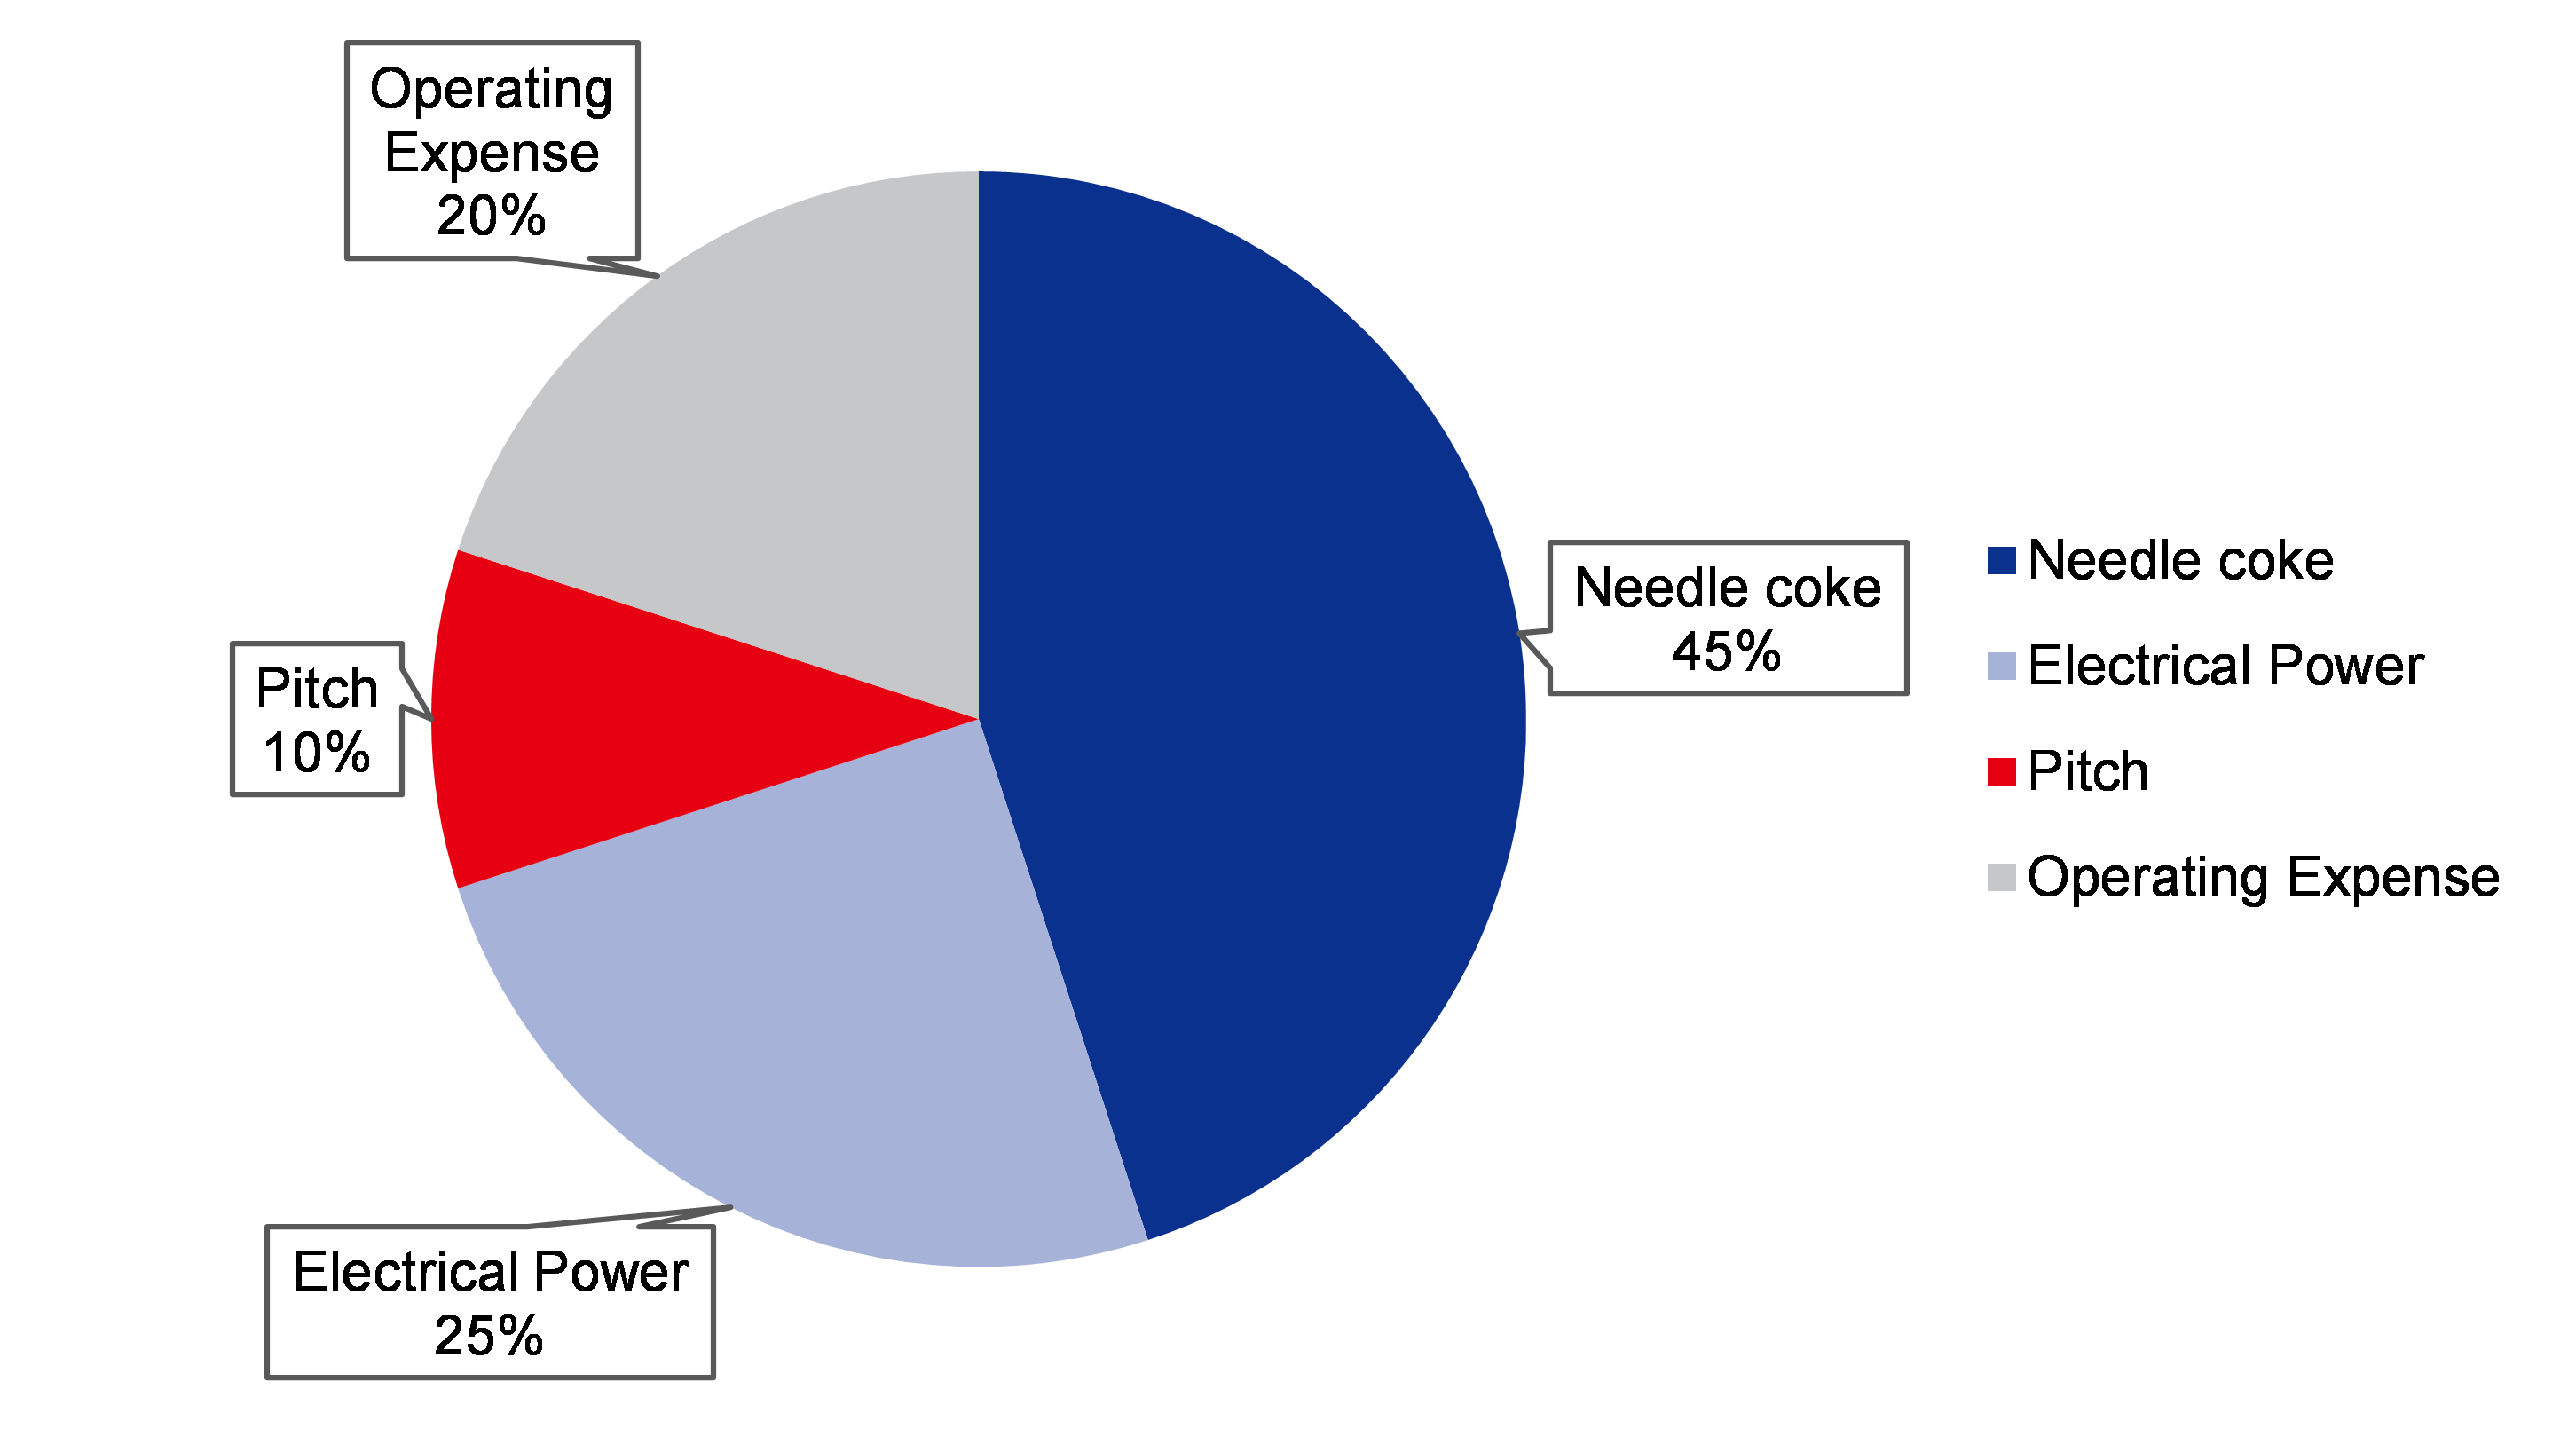
Needle coke is the main cost component of graphite
electrode

Figure 8: Raw material break-up for graphite electrodes - needle coke is the most important raw material; the pitch here is not a crude oil derivative, but a by-product of coal

SOURCE: INCRED RESEARCH, COMPANY REPORTS  

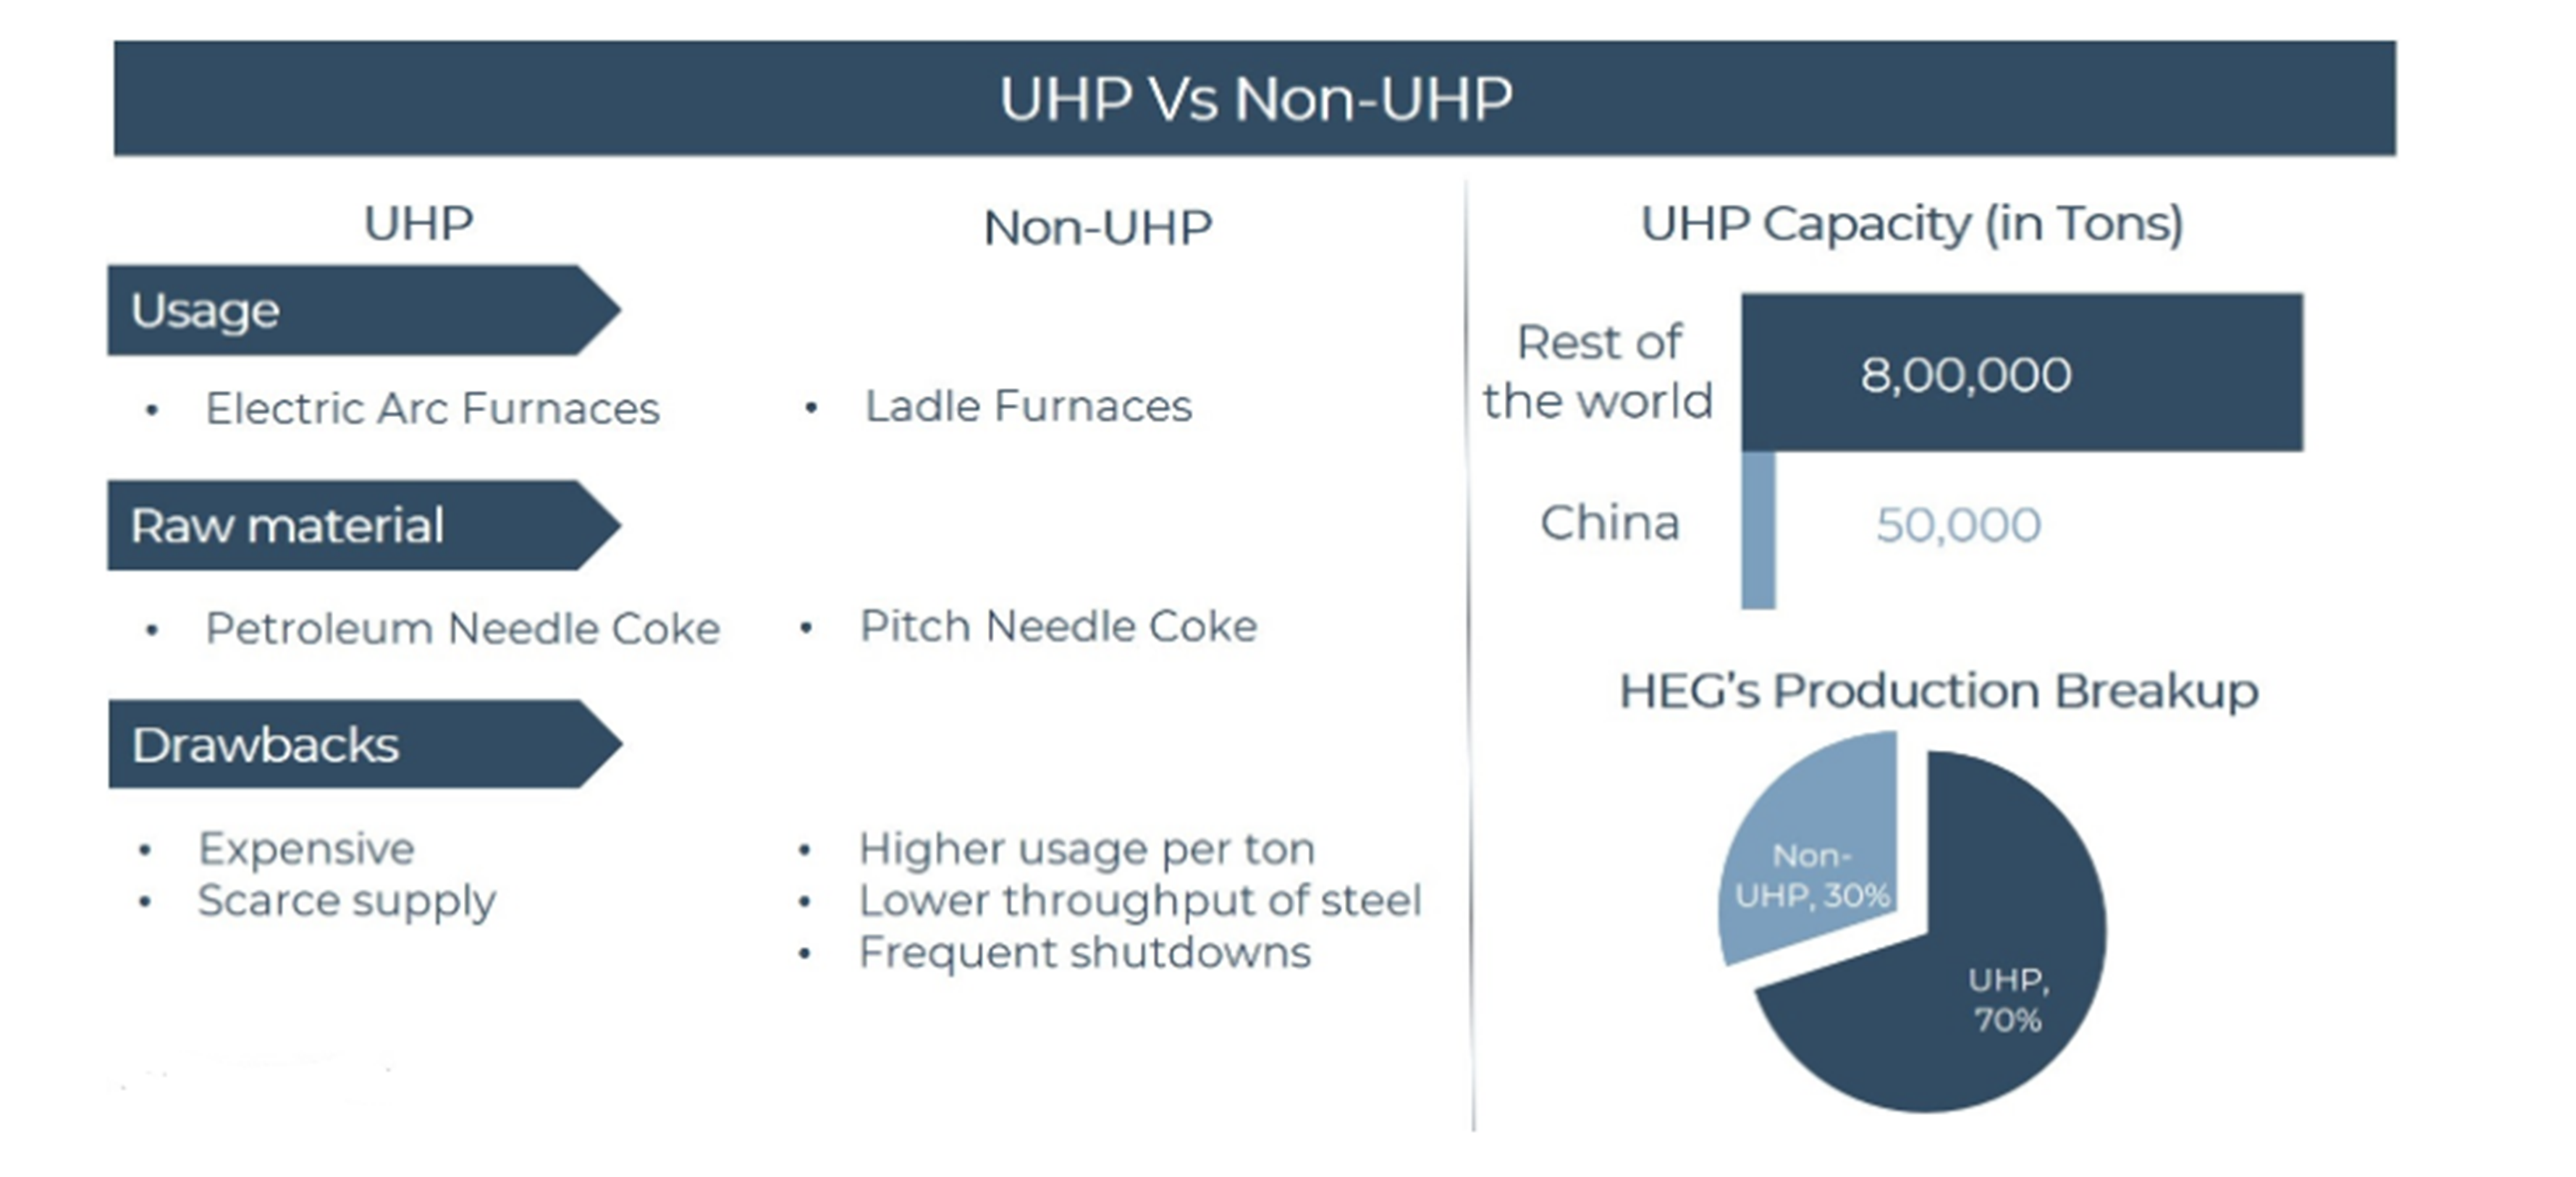
Graphiteelectrodes are of two types - UHP and HP

All major graphite electrode production in the world consists of two types - UHP or ultra high-power and HP or high-power. UHP is the more expensive one and is used in the main furnace for production of steel, and the HP, which is relatively of a lower quality, is used in ladle furnace for purification of steel.

The raw material for these two types of electrodes is also different. UHP electrodes can only be produced by high-quality needle coke, a crude oil derivative, which is sourced directly from Philip 66, a US-based refinery. Apart from Philip 66, there are only two other players based in Japan and South Korea which produce this type of coke. It must be noted that China’s needle coke is not a substitute for the high-quality needle coke produced by these players and hence, China only has HP capacity and no UHP capacity. The coke produced by China is pitch coke (a by-product of coal tar and not crude oil). The technology required for producing this high-quality coke is a closely guarded secret and hence, it is very difficult to replicate. HEG also procures this high-quality needle coke from Phillip 66 for manufacturing UHP electrodes.

Figure 9: The difference between UHP and HP electrodes

SOURCE: INCRED RESEARCH, COMPANY REPORTS  


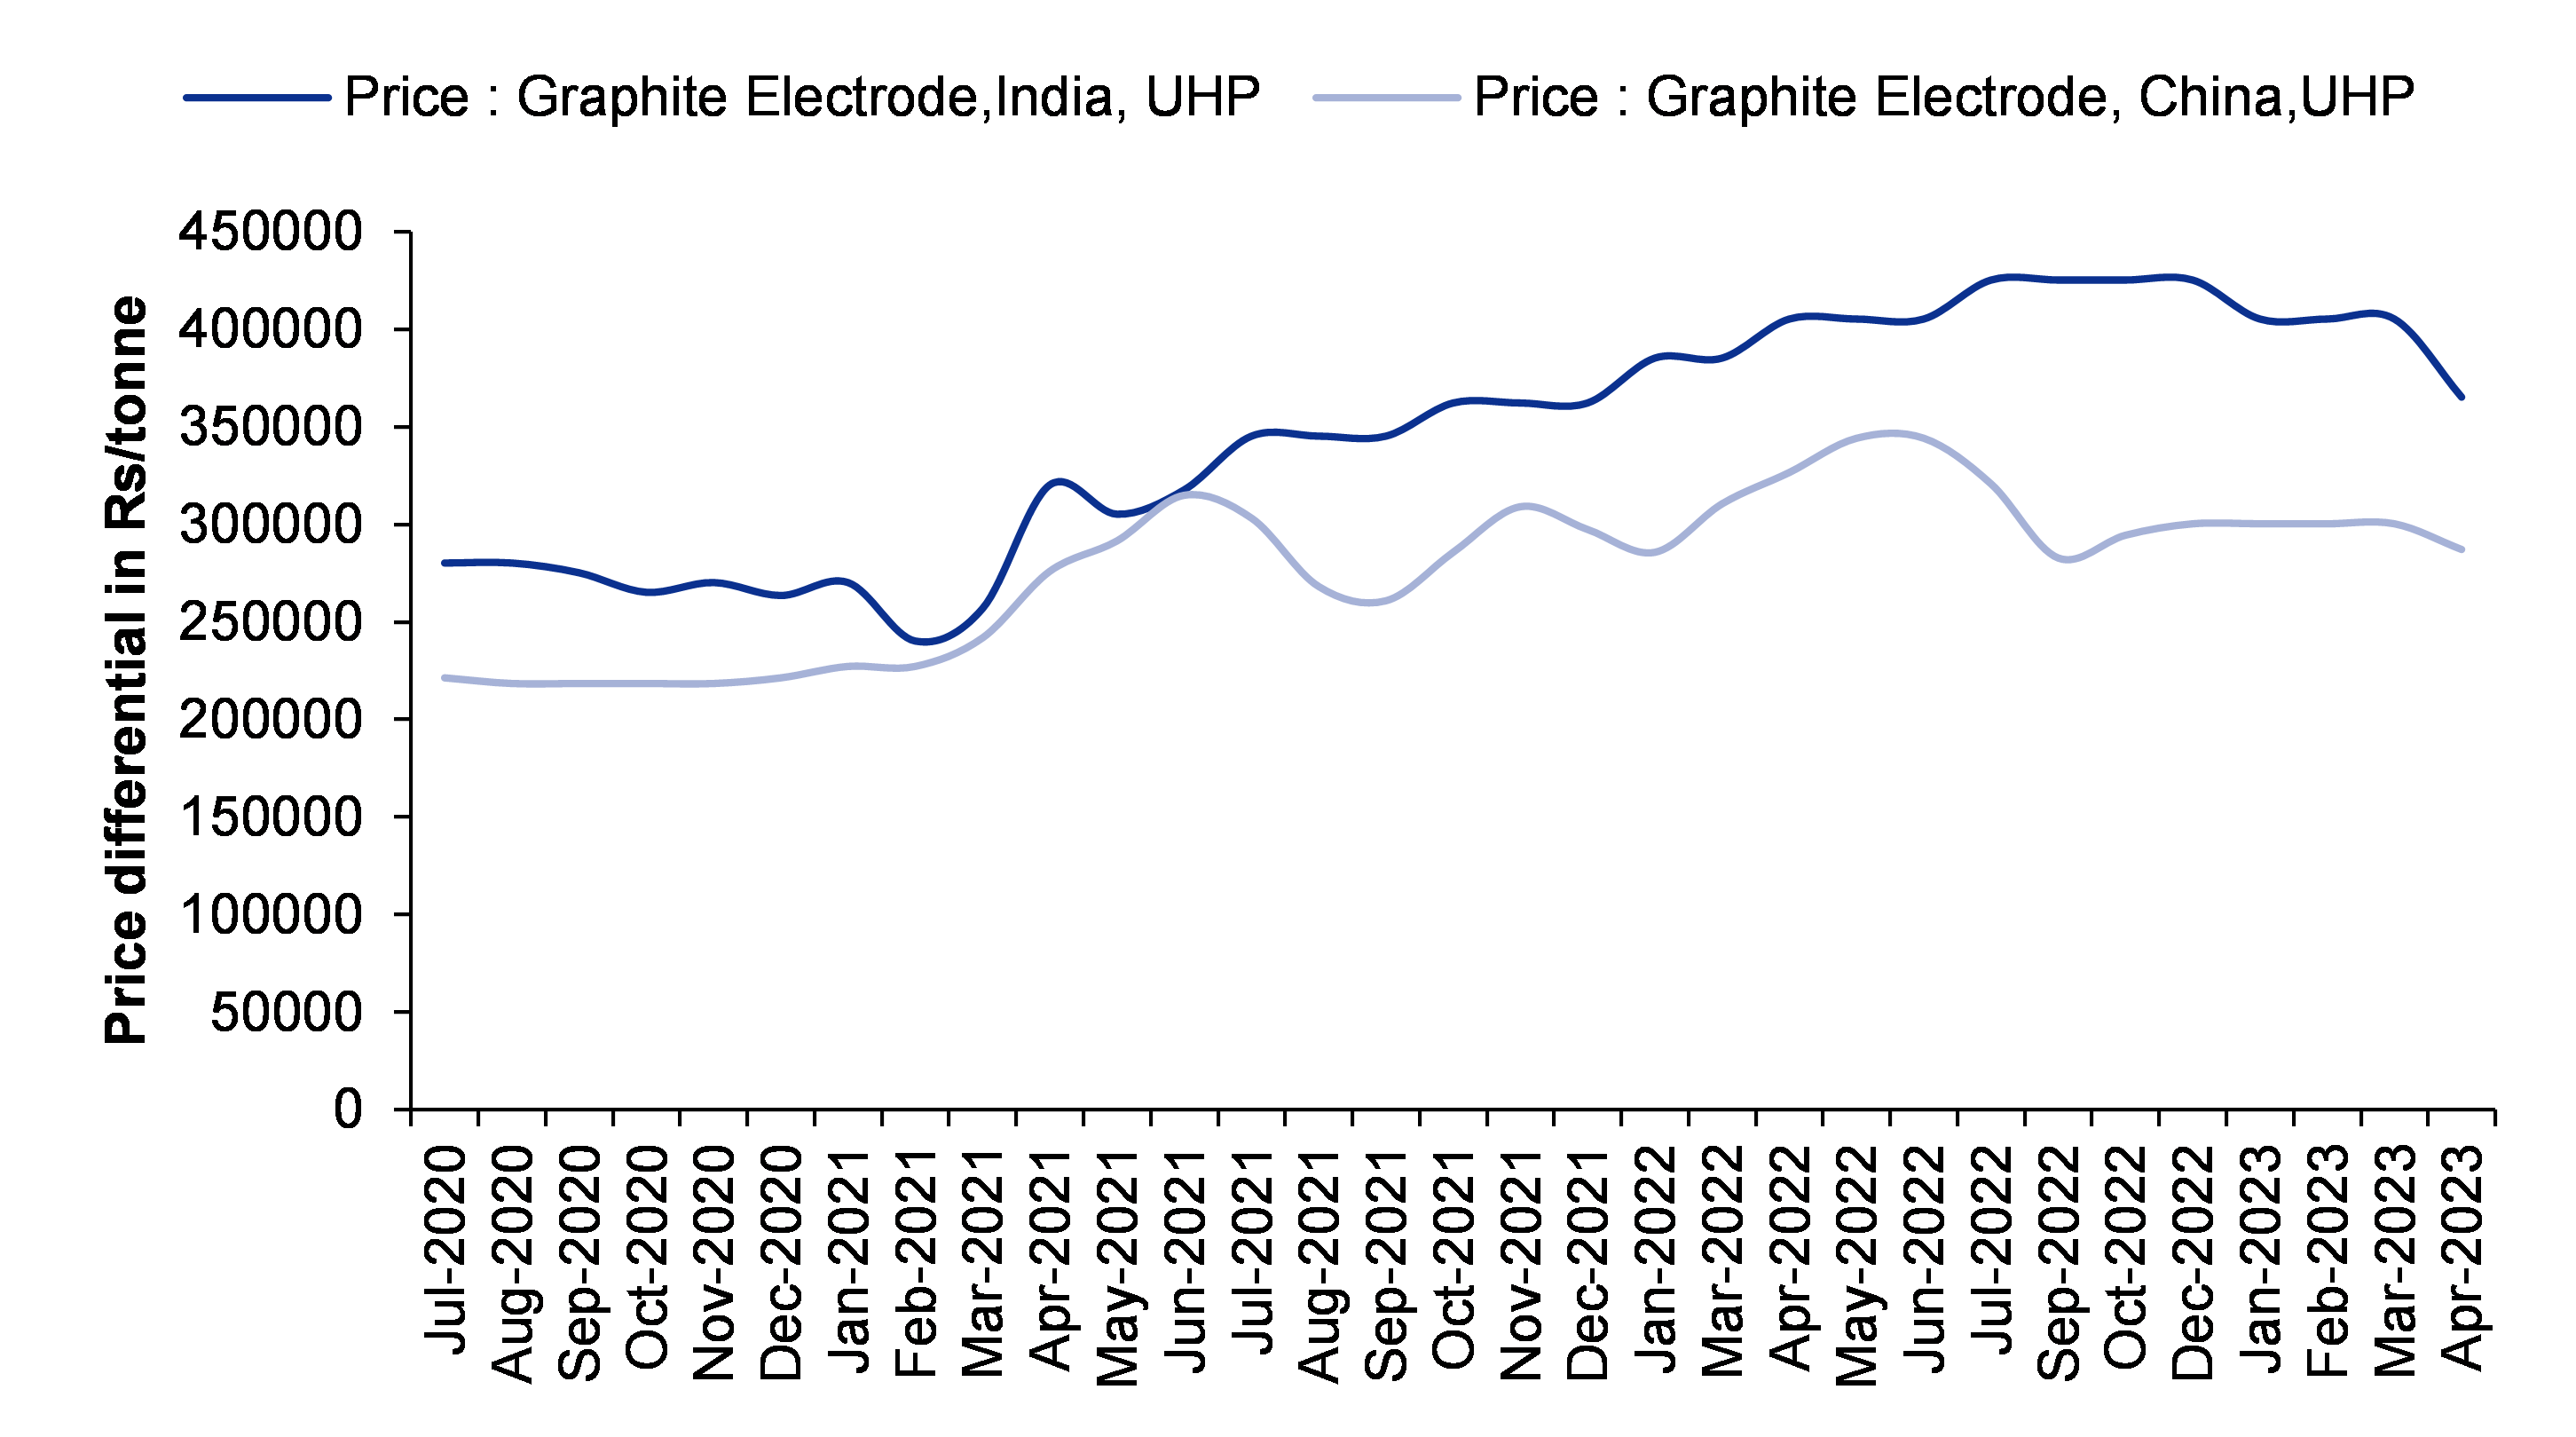
Figure 10: Price differential between UHP electrodes of India and China

SOURCE: INCRED RESEARCH, COMPANY REPORTS  

These electrodes cannot be used intechangebly, normally for EAF steel production UHP electrodes are used

One common misconception regarding these two types of electrodes is that they are fungible and can be interchangeably used, based on prices. However, that is not the case. UHP electrodes are used in a furnace and HP electrodes can’t be used in a furnace as they are of a relatively inferior quality and hence, won’t be able to withstand the excessive heat generated in the furnace.

Only China uses these electrodes intechangebly, but the steel quality is inferior

Graphite electrodes are sometimes interchanged for producing relatively inferior quality steel products by the Chinese, but that is just limited to China. China has a substantial capacity in ladle electrodes (HP electrodes) but close to zero capacity for UHP (ultra-high power) electrodes that are consumed in western countries. China utilizes lower quality electrodes (HP electrodes) and can tolerate the lower quality, given the fact that the primary product made is commodity grade rebar, which is a low-quality finished steel product.

China doesn’t have the technology to produce high-quality UHP electrode

The next logical question is - why can’t China import this high-quality needle coke from foreign players, like its Indian counterpart HEG, to manufacture UHP electrodes. In fact, China does import this high-quality needle coke. It’s done by a company called Fangda Carbon. However, the expertise required to manufacture UHP electrodes is again a closely guarded trade secret and is with only a few players, namely HEG, Graphite India, Graftech, and Showa Denko. So, even though China claims to produce UHP electrodes, they are nowhere near the quality produced by these players and thus, its prices are at a discount compared to global UHP prices.

Thus, HEG competes with Chinese players in the HP market and faces no competition in the UHP market. Again, the next logical question is - why does HEG even produce HP when it can produce UHP where there is no Chinese competition and thus, no risk of dumping. It’s because a decade ago, all the major players like Graftech and Showa Denko exited the HP market,

In the case of HP electrodes, prices are overlapping because HEG directly competes with Chinese companies in this division. Moreover, HP electrodes have faced pricing pressure after the Indian government removed the anti-dumping duty on import of graphite electrodes in Sep 2018, thereby leading to cheap Chinese electrodes finding their way to the Indian market.

HEG’s recent bet: Anodes for lithium-ion batteries

Lithium-ion batteries are the next big thing. They power the lives of millions of people every day. From laptops and cell phones to hybrids and electric cars, this technology is growing in popularity due to its light weight, high energy density, and ability to recharge.

HEG has a capex plan for making graphite anodes of lithium-ion batteries under its new subsidiary, The Advanced Carbon Company (TACC). It is a 10,000t, Rs10bn investment, having an asset turnover ratio of 1:1. Hence, when the plant becomes operational by FY25F, it is expected to add Rs10bn in revenue, which will be a significant number.

This will be the only lithium-ion plant in the country, and the company expects to recover the cost of the capex in five-to-six years. The raw material requirement will be like its graphite electrode business, i.e., needle coke and Indian coke, explained previously.

The proposed plant will cater to 10-12GWh of cell manufacturing capacity. HEG said the investment will be made in two phases, with the first phase expected to be operational by 2025F with an investment of Rs10bn. In the second phase, the company plans to double the capacity with an additional investment of Rs10bn.

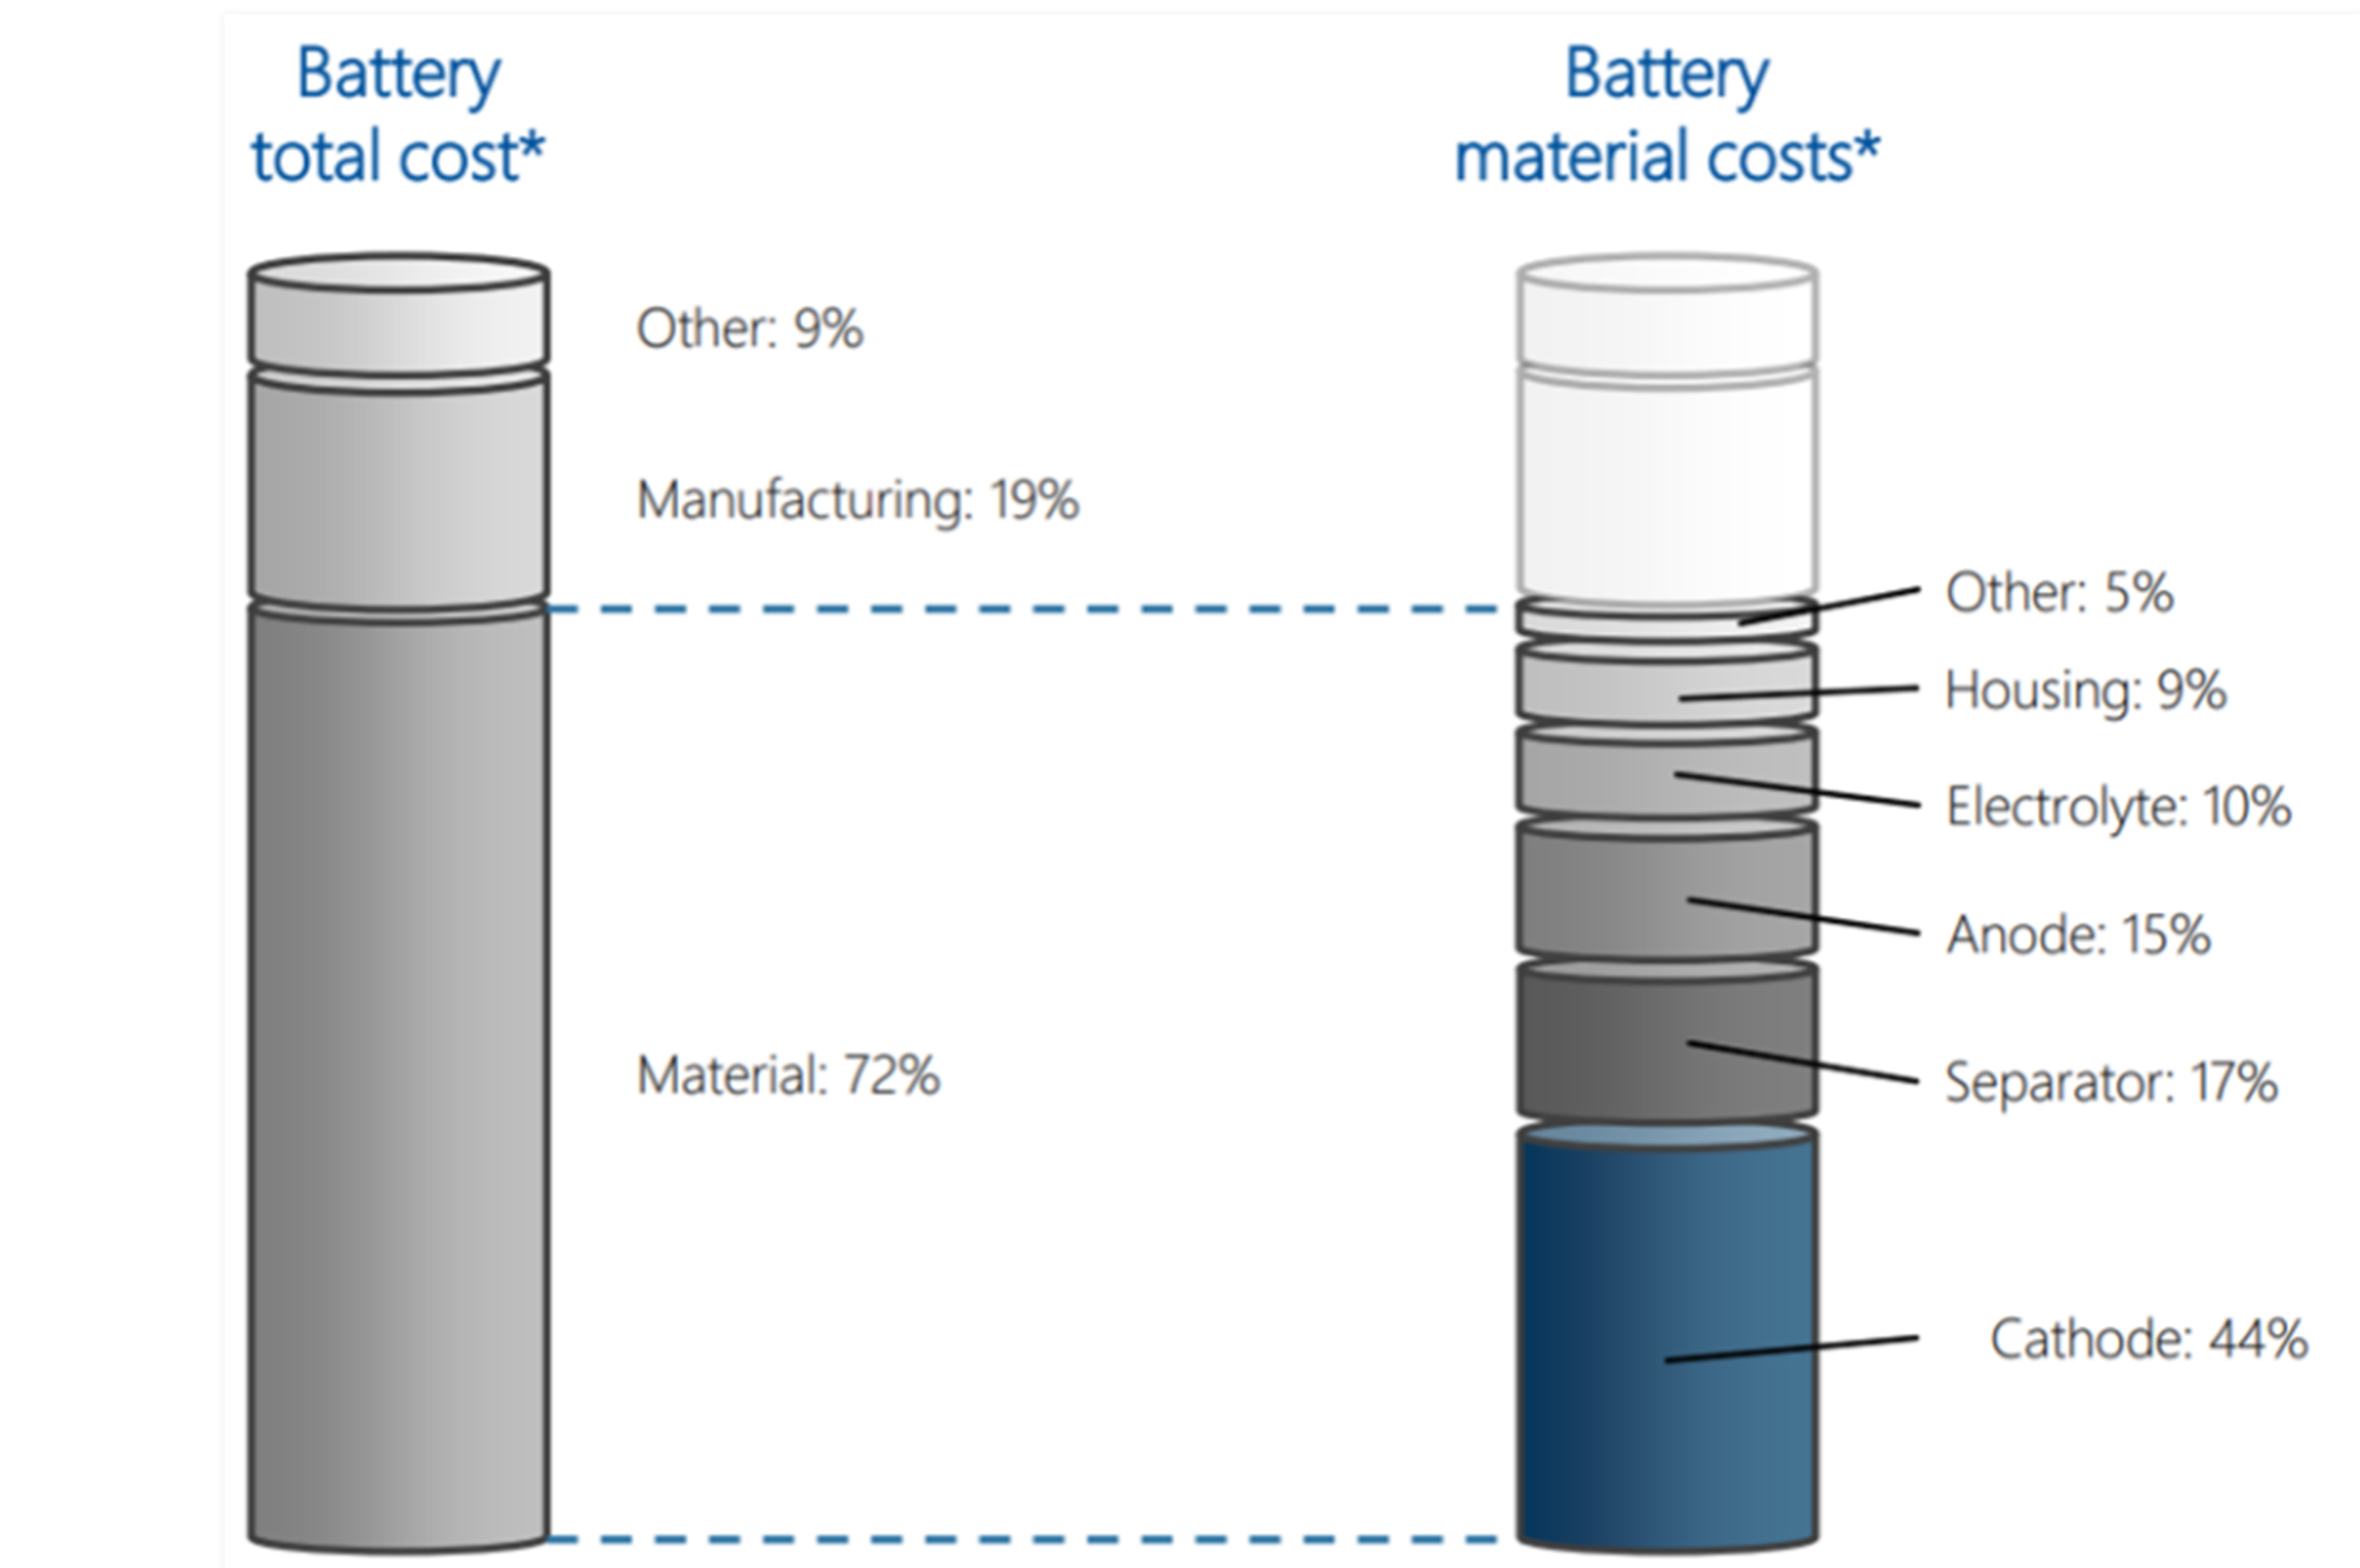
For every GWh of Li-ion cell production, around 1,100t of graphite anode is needed, accounting for about 10-15 percent of the total cost. Graphite anode for LiB (lithium-ion batteries) is expensive and is sold in kg, not tonne and hence, is expected to improve the margins of the company when its plant becomes operational.

Two ways to make graphite anode - synthetic vs. natural graphite

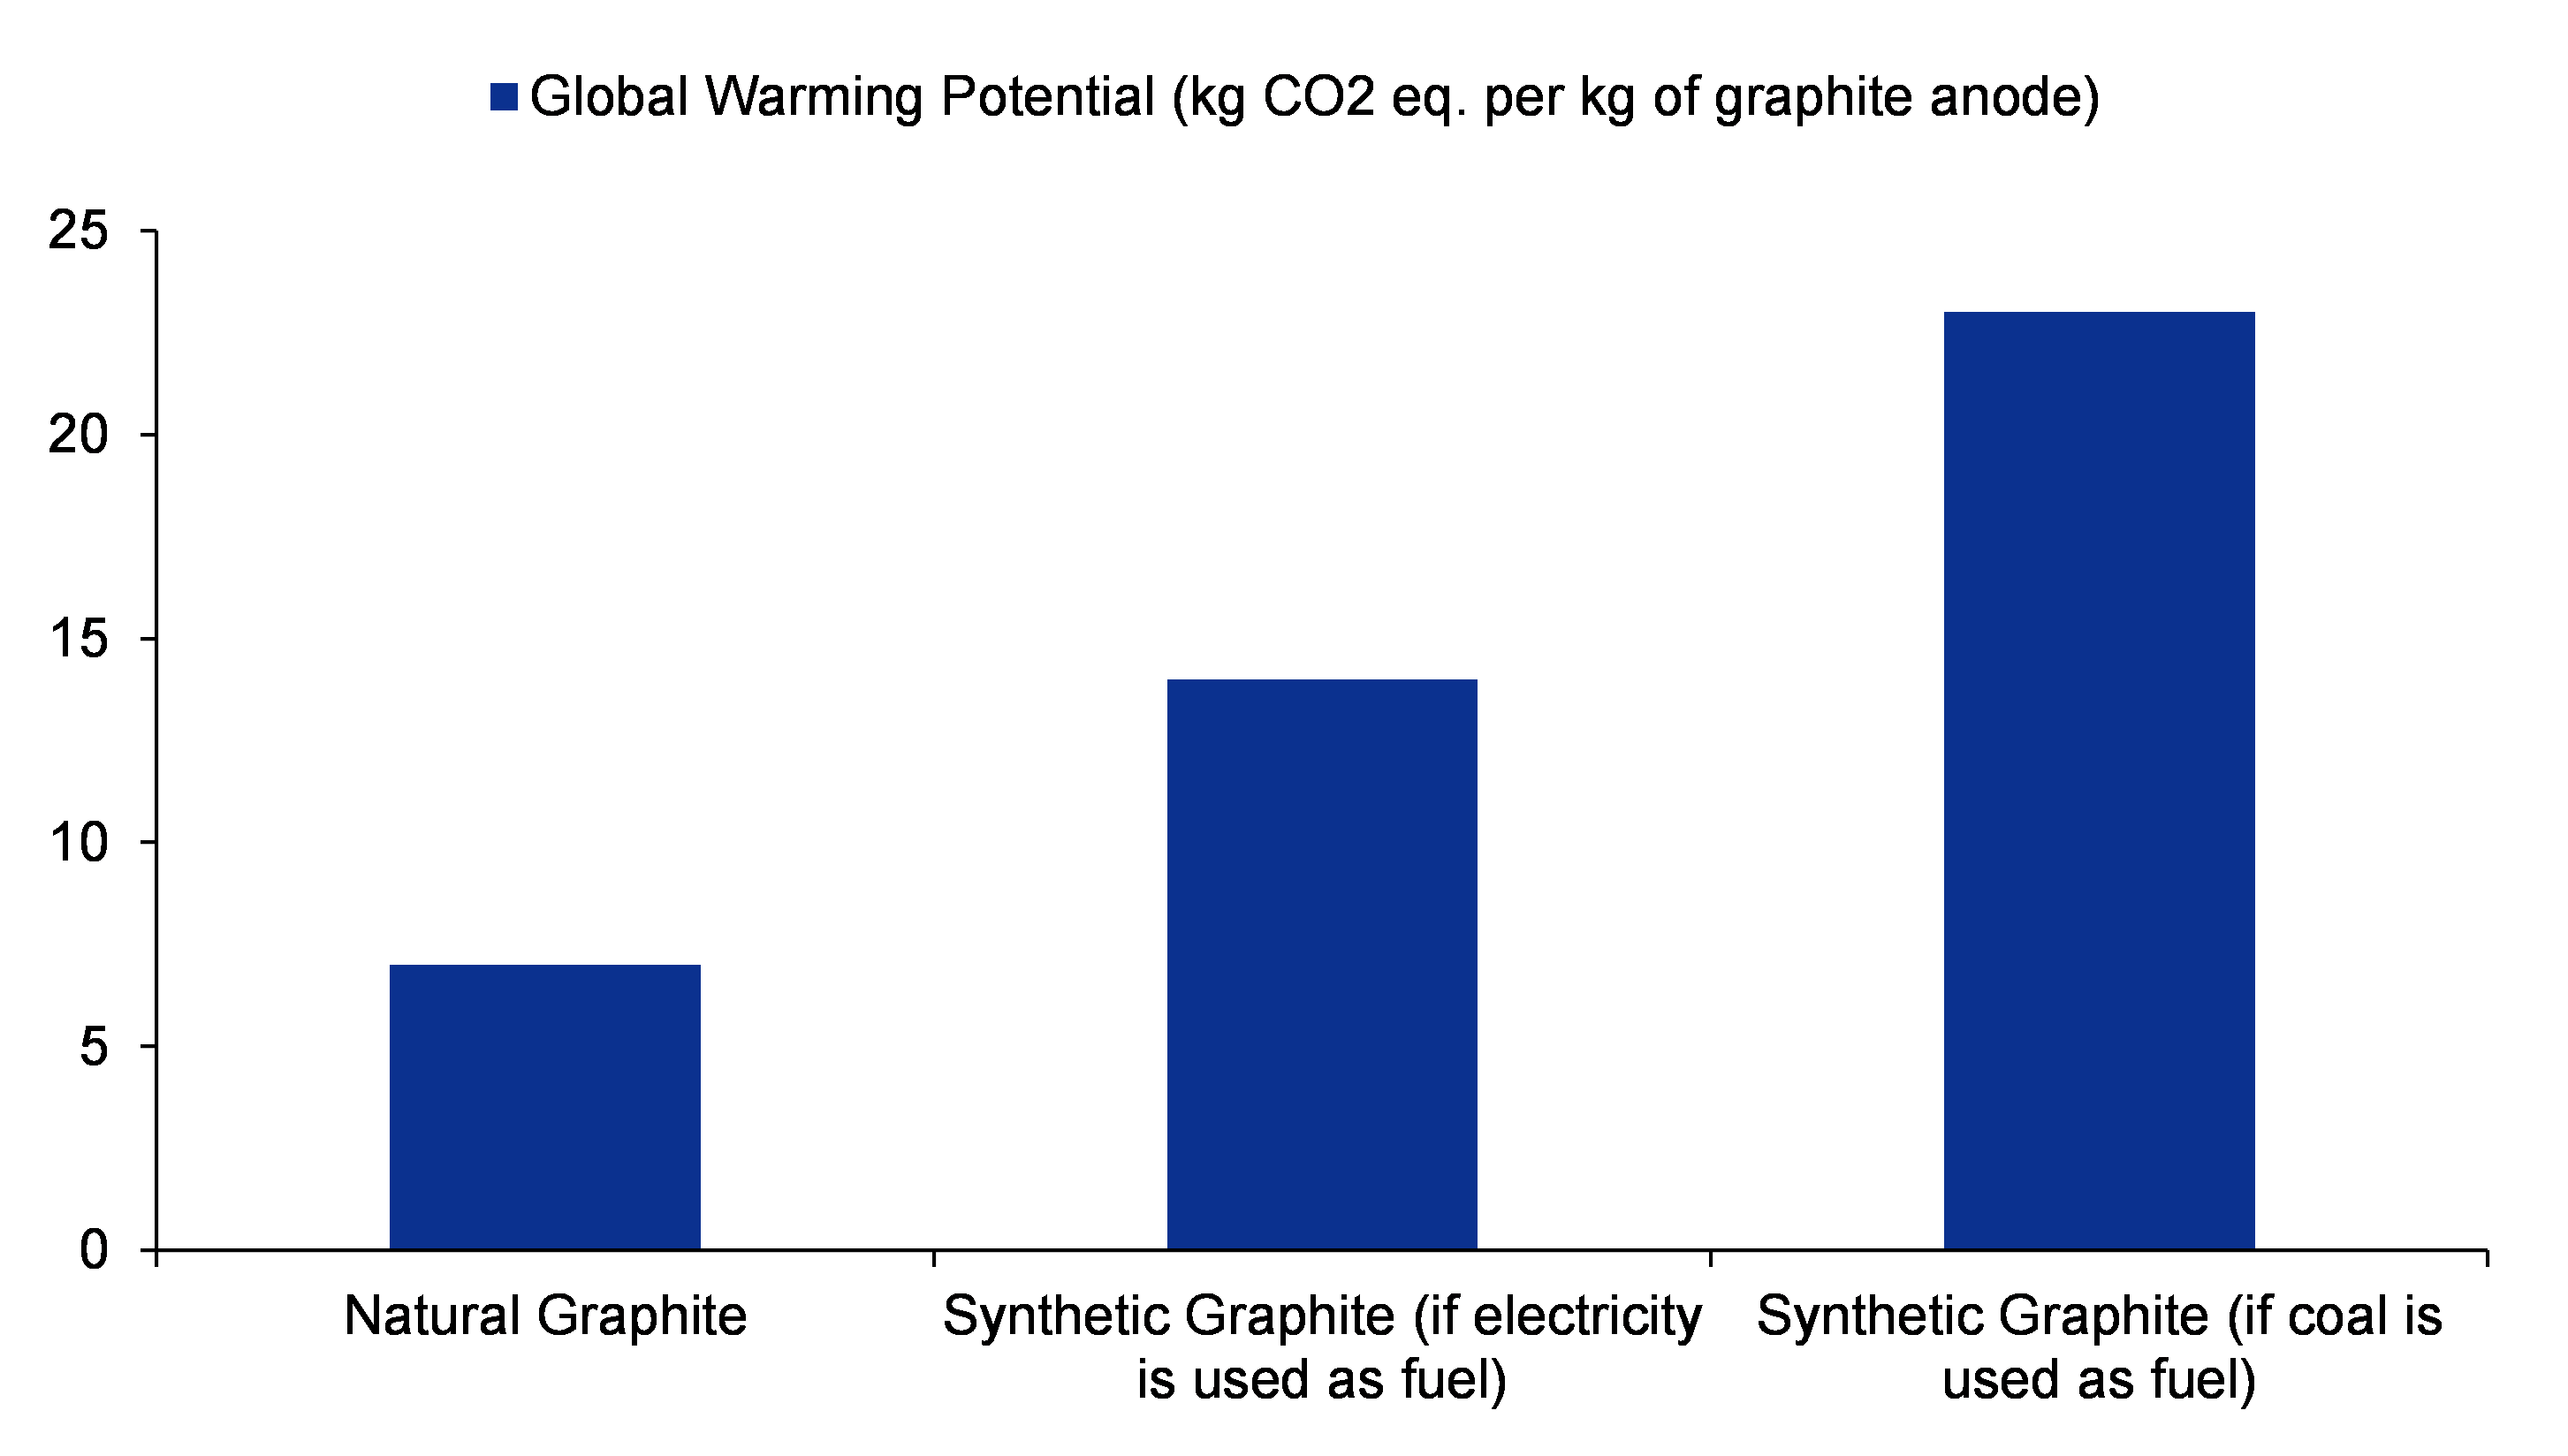
1kWh of typical lithium-ion battery storage requires ~1kg of graphite. Despite being one of the most abundant elements, graphite still has a scaling issue. Two types of graphite are used in lithium-ion batteries – naturally-mined flake graphite processed into spheres, and synthetic graphite produced from petroleum coke and tar pitch at a very high temperature. Synthetic graphite anode production can be over four times more carbon-intensive than natural graphite anode production, as due to its use of energy and fossil fuels as a feedstock, it uses needle coke as one of its raw materials, which is also used by HEG to manufacture graphite electrodes.

Currently, most of the world’s lithium-ion batteries use synthetic graphite

Natural graphite anode has the advantages of lower cost, high capacity and lower energy consumption compared with the corresponding synthetic anode. But, synthetic graphite performs much better in electrolyte compatibility, fast-charge turnaround, and battery longevity.

There are three main types of natural graphite: flake (>85% carbon), amorphous (typically 60-85% carbon) and vein (>90% carbon). Within the flake category, there are three main grades: large (+80 mesh), medium (+100-80 mesh) and fine (-100 mesh). More recently, some non-Chinese producers have started to market what they refer to as ‘jumbo’ flake graphite (+50 mesh). Spherical graphite, which is used to manufacture graphite anode, is manufactured from fine flake graphite.

Whether one prefers to make anode via synthetic or natural graphite depends on the cost differential

Hence, between the two, when the price differential is less, synthetic graphite anode becomes a better option due to its benefits like longevity and short turnaround time.

Figure 11: Cost break-up of a typical lithium-ion battery

SOURCE: INCRED RESEARCH, COMPANY REPORTS  


Figure 12: Carbon footprint of the different methods of manufacturing graphite anode

SOURCE: INCRED RESEARCH, COMPANY REPORTS  

The carbon footprint of natural graphite is significantly less than that of synthetic graphite

For natural graphite, two-thirds of carbon emissions come from the spheroidization process, in which China has a monopoly currently. Spheroidization is a process in which graphite particles are mechanically rounded. This leads to the loss of some material but yields improvement in the performance of the anode. Although natural graphite is associated with lesser carbon emissions, it is not without its own ESG and supply chain concerns.

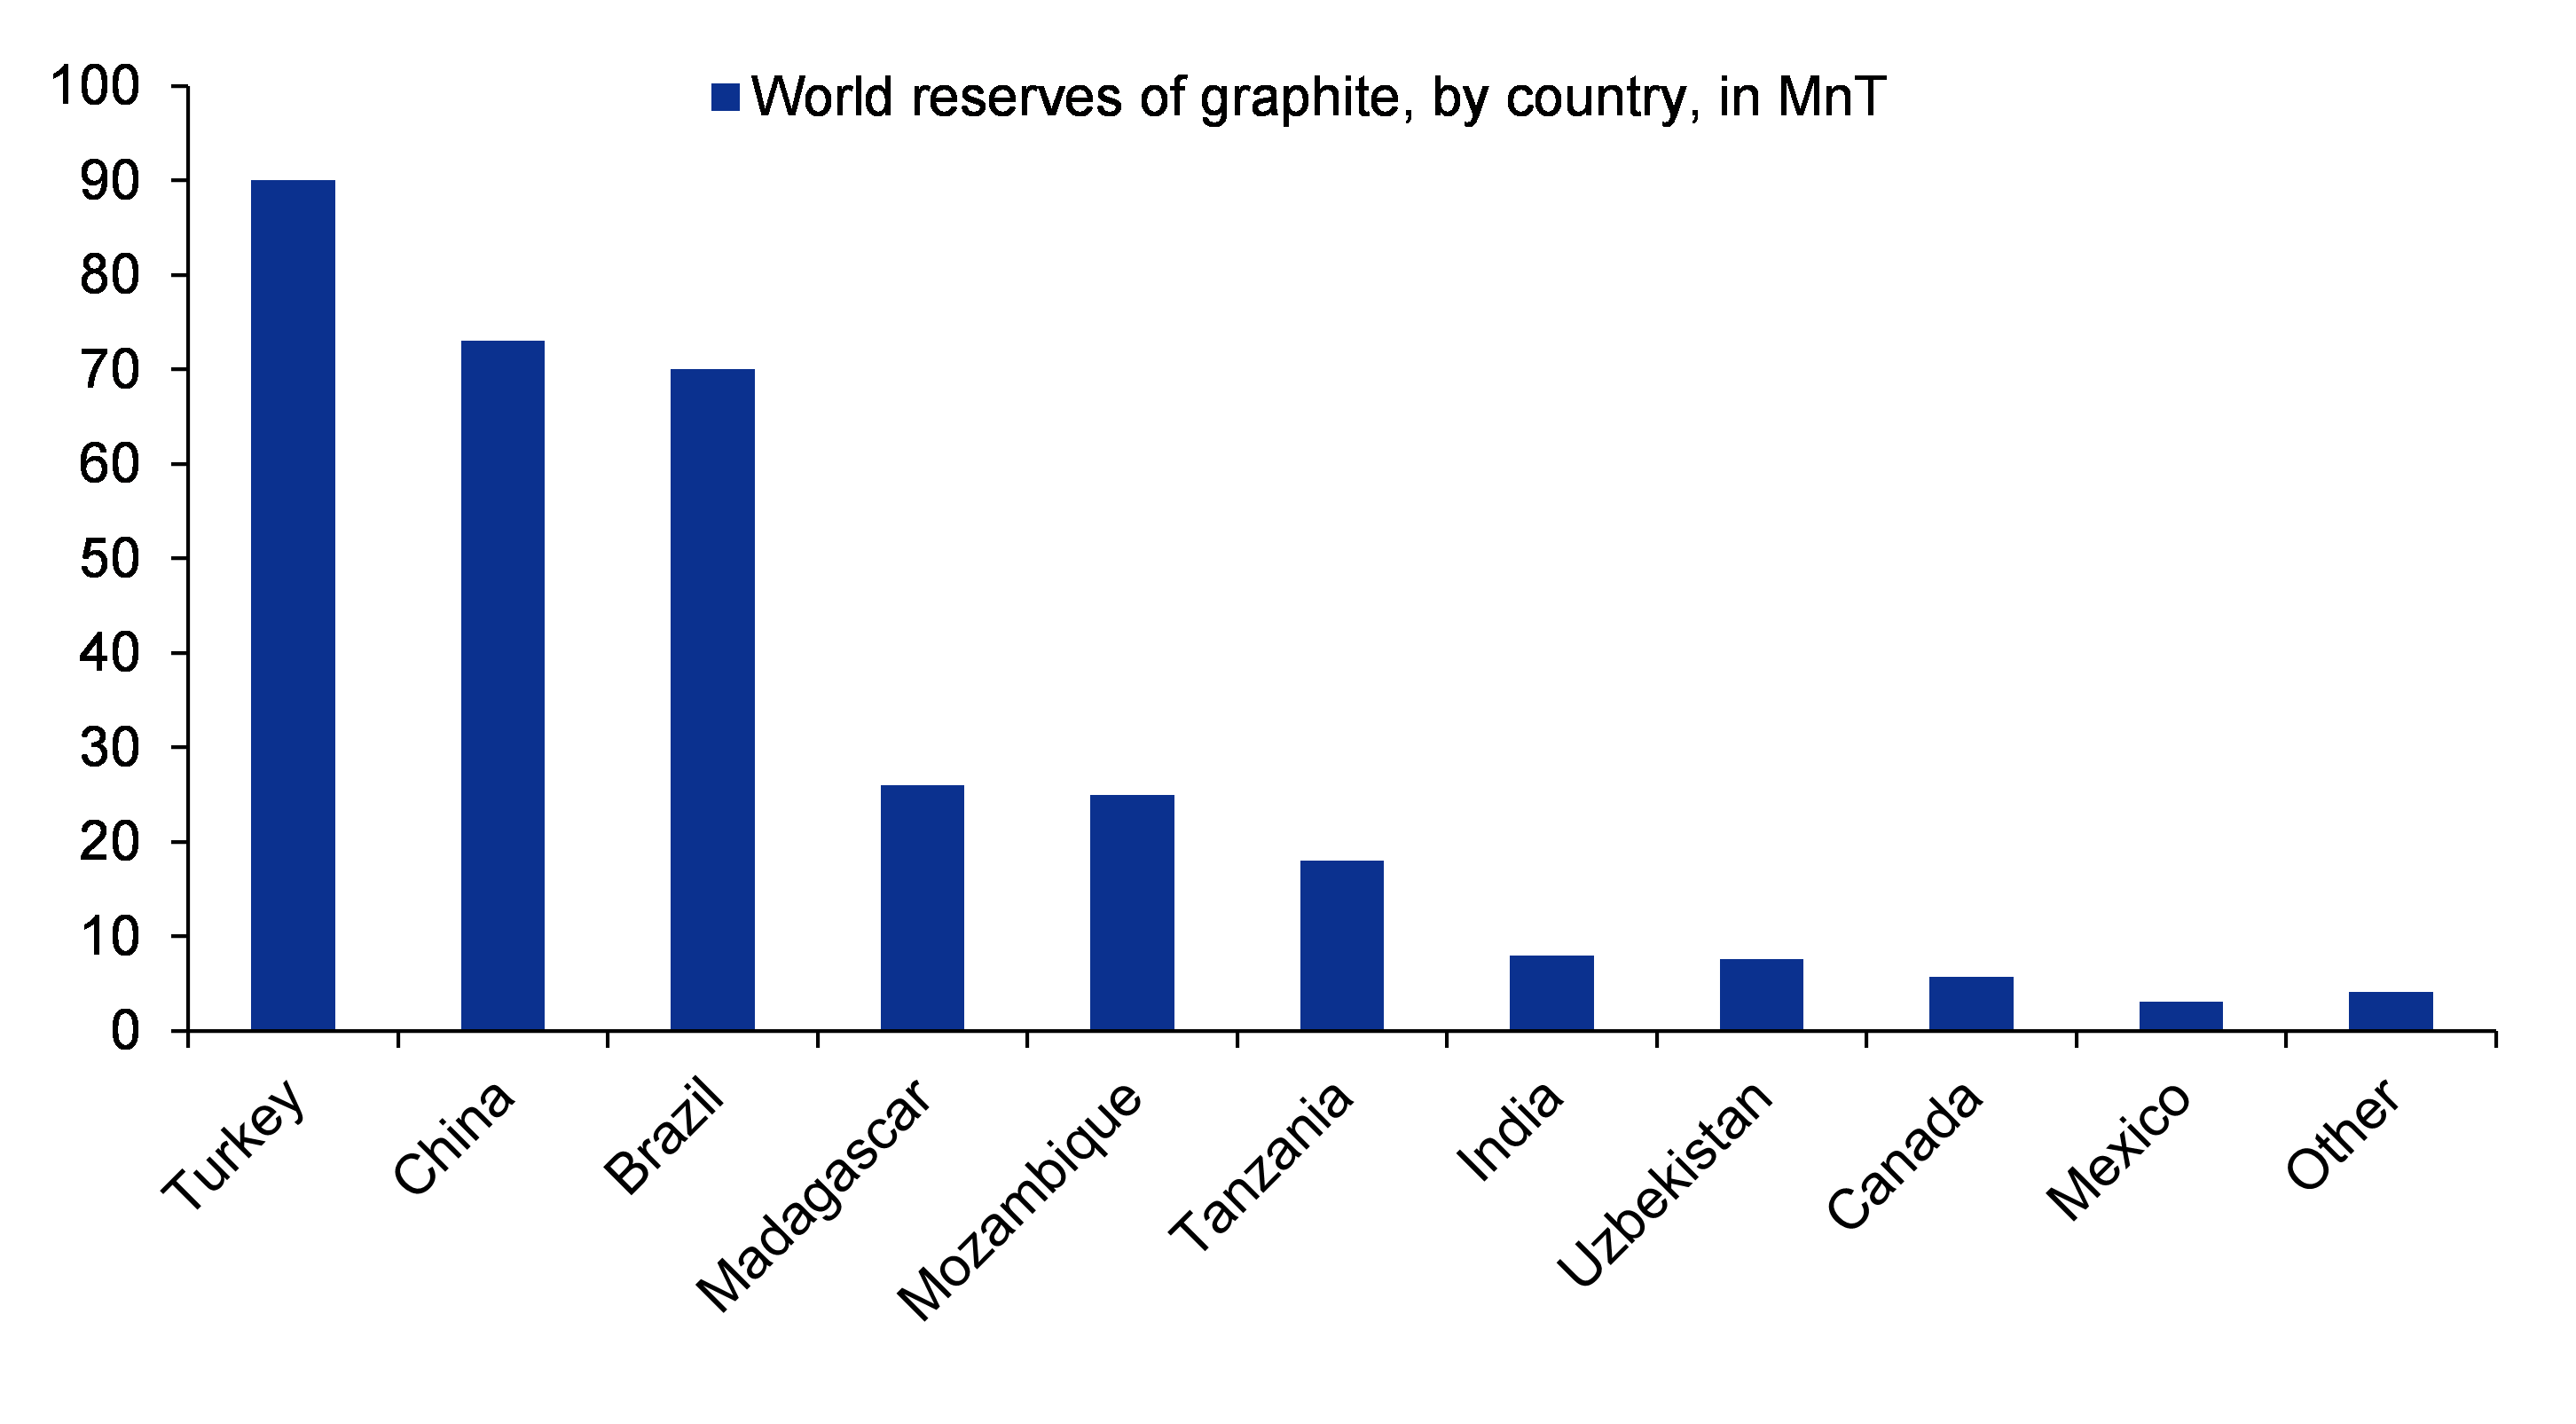
China produced 68% of natural graphite last year, with most of this concentrated in the Heilongjiang province, which shuts down in the winter season every year as temperatures drop too low for the machinery and the personnel to operate. A major source of natural graphite outside China, in the short term, is Mozambique, which currently accounts for 10% of mined graphite. According to forecasts, 96% of Mozambican graphite in 2025F will be mined in the northern Cabo Delgado province which, since 2017, has been the site of attacks by an Islamist state-linked insurgency group. Earlier this month, Triton Resources, an Australian-owned graphite miner, said that two of its staff members were killed after an attack by insurgents. The company also suspended personnel and logistics movement on a primary transport route in the province following the attack.  Nearly 70% of graphite mining in Europe takes place in Russia and Ukraine and the Ukraine war could impact the stability of Europe’s graphite production. Madagascar is another alternative graphite supply source to China, accounting for nearly 10% of supply currently. However, the region suffers from cyclones, one of which halted operations at a graphite mine in the country earlier this year. Climate change has made these cyclones more severe, and it is likely that they will get more destructive in the future.

Figure 13: Global reserves of graphite, by country - China & Turkey account for a major portion

SOURCE: INCRED RESEARCH, COMPANY REPORTS  

How does a simple battery work

Let’s try to understand briefly how a battery works:

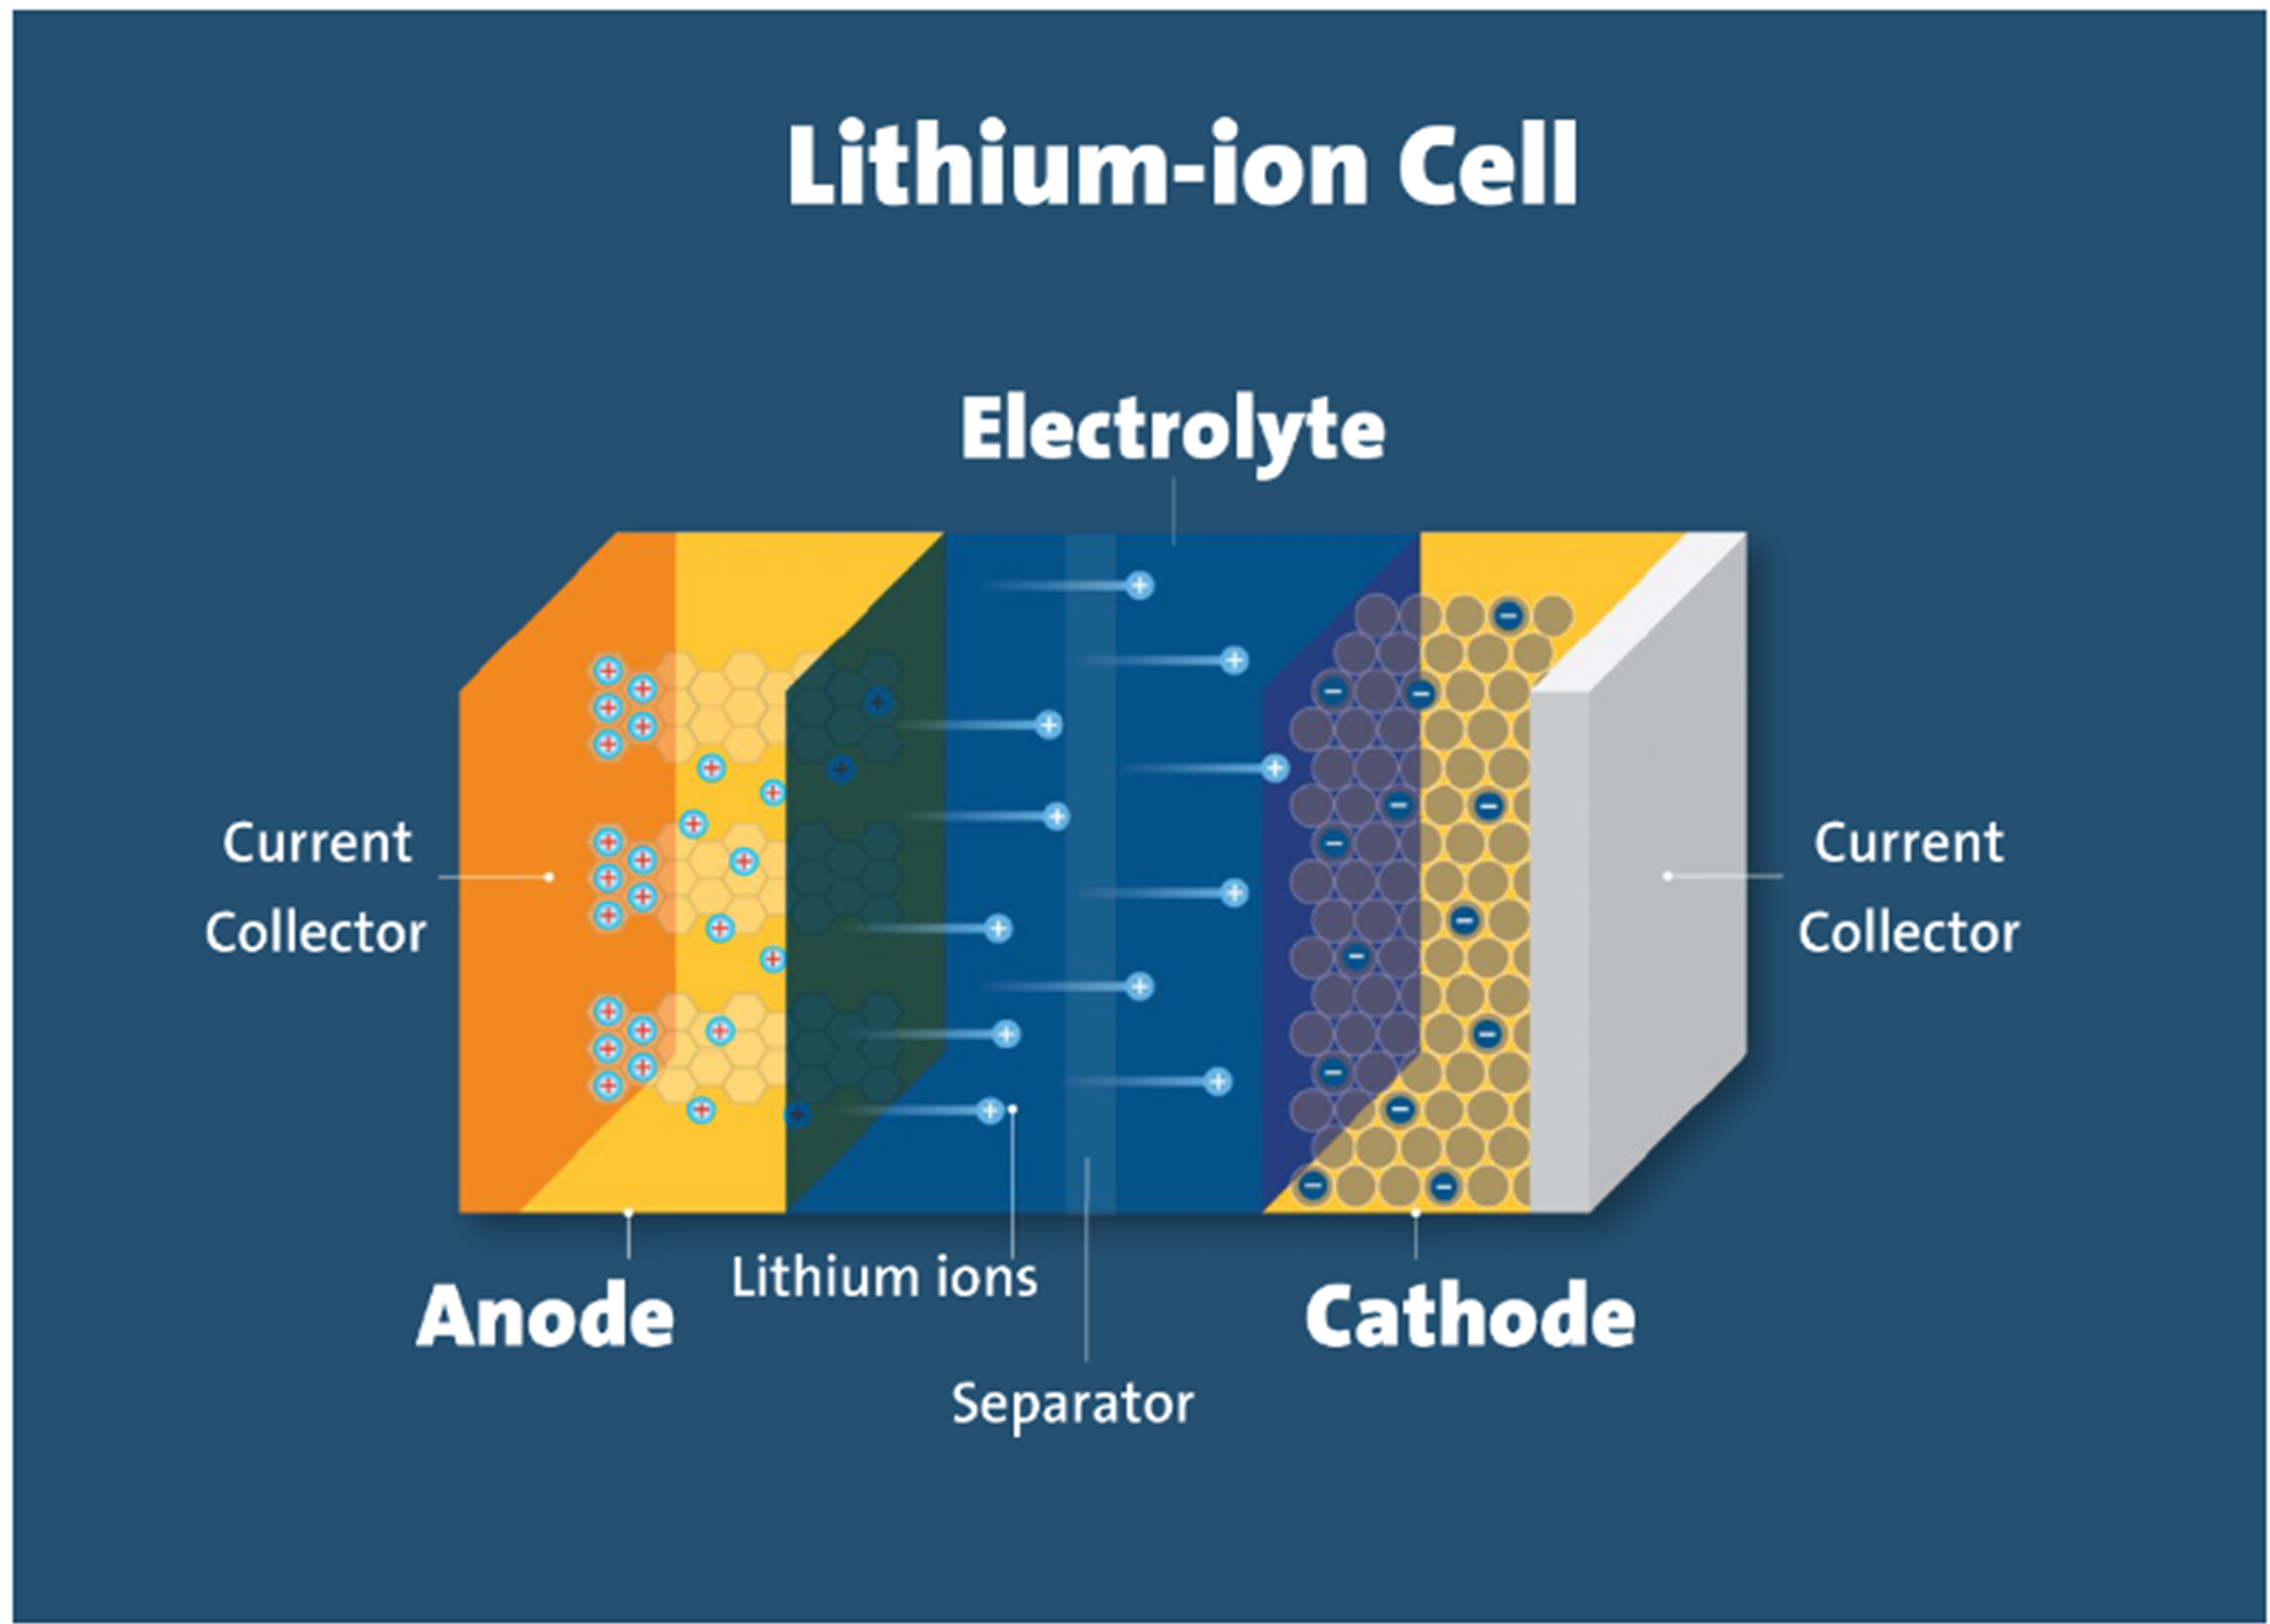
A battery is made up of an anode, cathode, separator, electrolyte, and two current collectors (positive and negative). The anode and cathode store lithium. The electrolyte carries positively charged lithium ions from the anode to the cathode and vice versa through the separator. The movement of the lithium ions creates free electrons in the anode which creates a charge at the positive current collector.  The electrical current then flows from the current collector through a device being powered (cell phone, computer, etc.) to the negative current collector. The separator blocks the flow of electrons inside the battery.

While the battery is discharging and providing an electric current, the anode releases lithium ions to the cathode, generating a flow of electrons from one side to the other. When plugging in the device, the opposite happens: lithium ions are released by the cathode and received by the anode.

The two most common concepts associated with batteries are energy density and power density. Energy density is measured in watt-hours per kilogram (Wh/kg) and is the amount of energy a battery can store with respect to its mass. Power density is measured in watts per kilogram (W/kg) and is the amount of power that can be generated by the battery with respect to its mass. To draw a clear picture, think of draining a pool. Energy density is like the size of the pool, while power density is comparable to draining the pool as quickly as possible.

Figure 14: Simple diagram explaining the working of a lithium-ion cell

SOURCE: INCRED RESEARCH, COMPANY REPORTS  

Silicon anode – the future of graphite anode in a lithium-ion battery

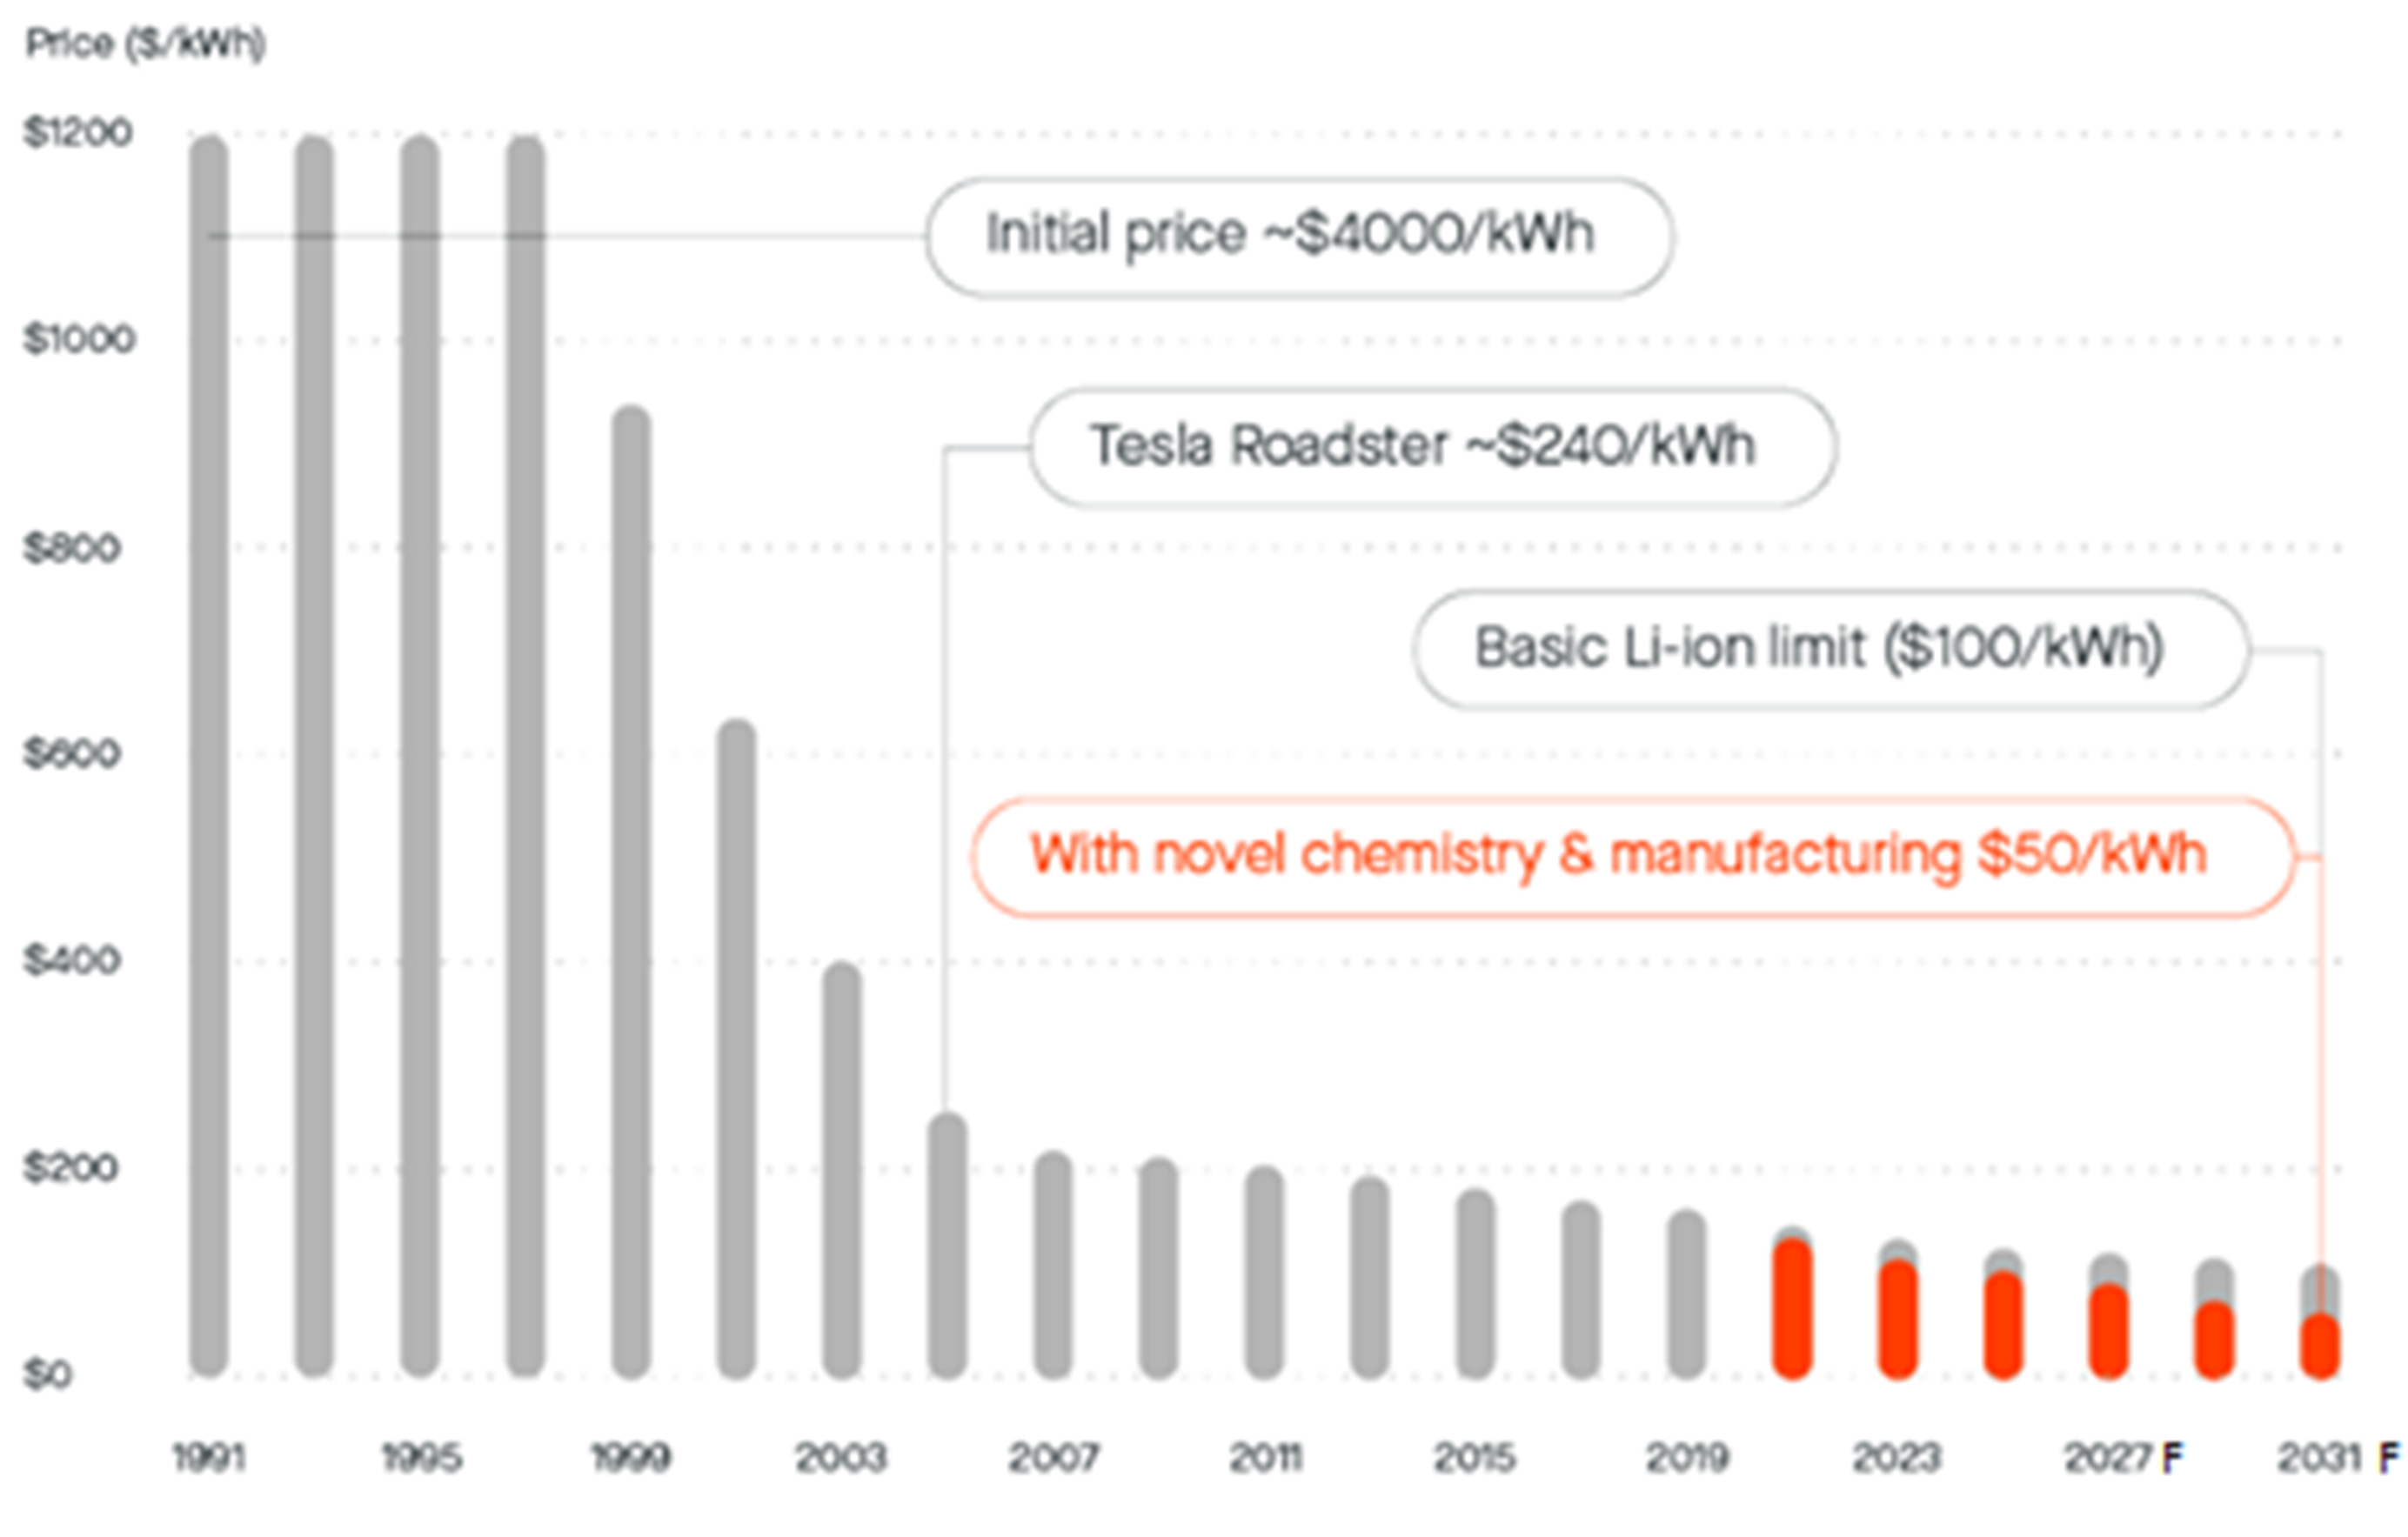
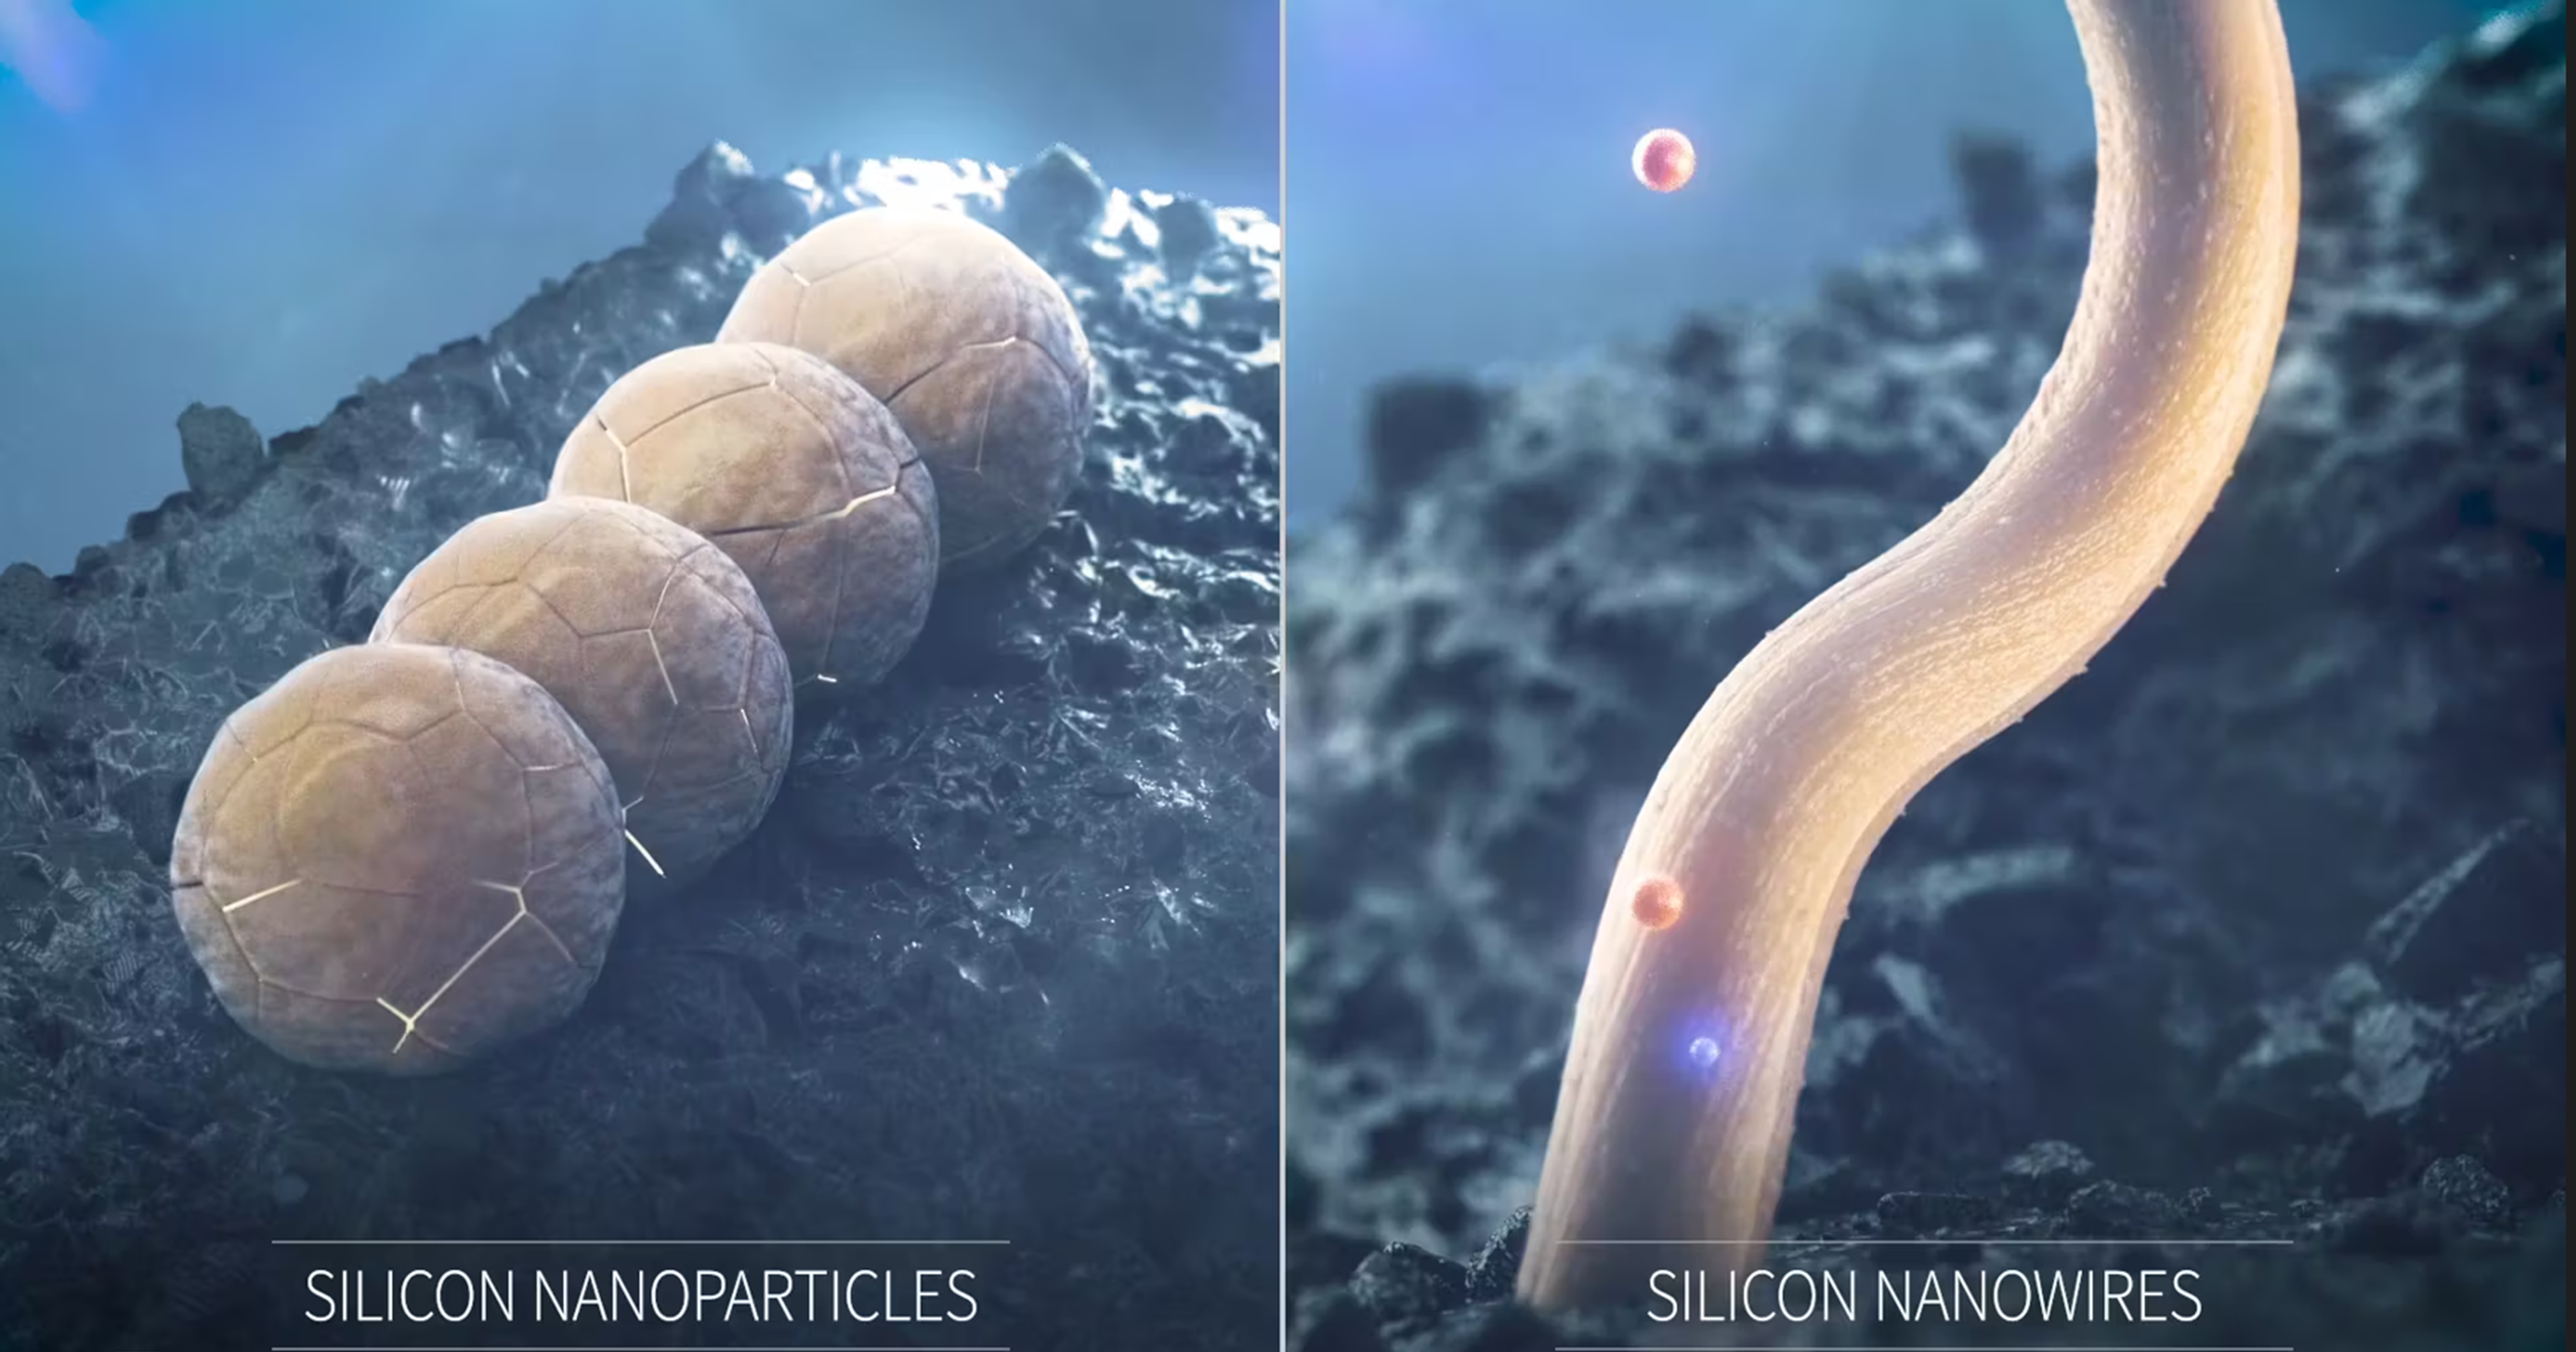
Although a lithium-ion battery with a graphite anode appears to be EPS-accretive for HEG, there is a business risk associated with it, namely the silicon anode battery. These batteries don’t use graphite anode for electricity generation but a mixture of graphite + silicon or only silicon as an anode. It is also to be noted, that for these silicon + graphite mixtures, natural graphite is the preferred type because artificial graphite mixture with silicon is not stable enough. This dramatically improves the performance of batteries and can be a real game changer in the long run. A US-based company called Amprius Technologies is working on a graphite- free silicon anode battery having an energy density of 500 Wh/kg. It must be noted that a lithium-ion battery or LiB with a graphite anode has an energy density of 100-200 Wh/kg.


Figure 15: Cost improvement with a silicon anode battery - on using a silicon anode, the cost per kWh improves dramatically and almost halves from US$100/kWh for a basic lithium-ion battery to US$50/kWh for a silicon anode battery

SOURCE: INCRED RESEARCH, COMPANY REPORTS  

Figure 16: Traditional silicon nanoparticles versus the now-used silicon nanowires - the nano particles have the problem of expansion on repeatedly charging and discharging but the nanowires don’t face that issue and hence, can revolutionize LiB batteries

SOURCE: INCRED RESEARCH, COMPANY REPORTS  


A peek into HEG’s valuation

Robust fundamentals to lead the way

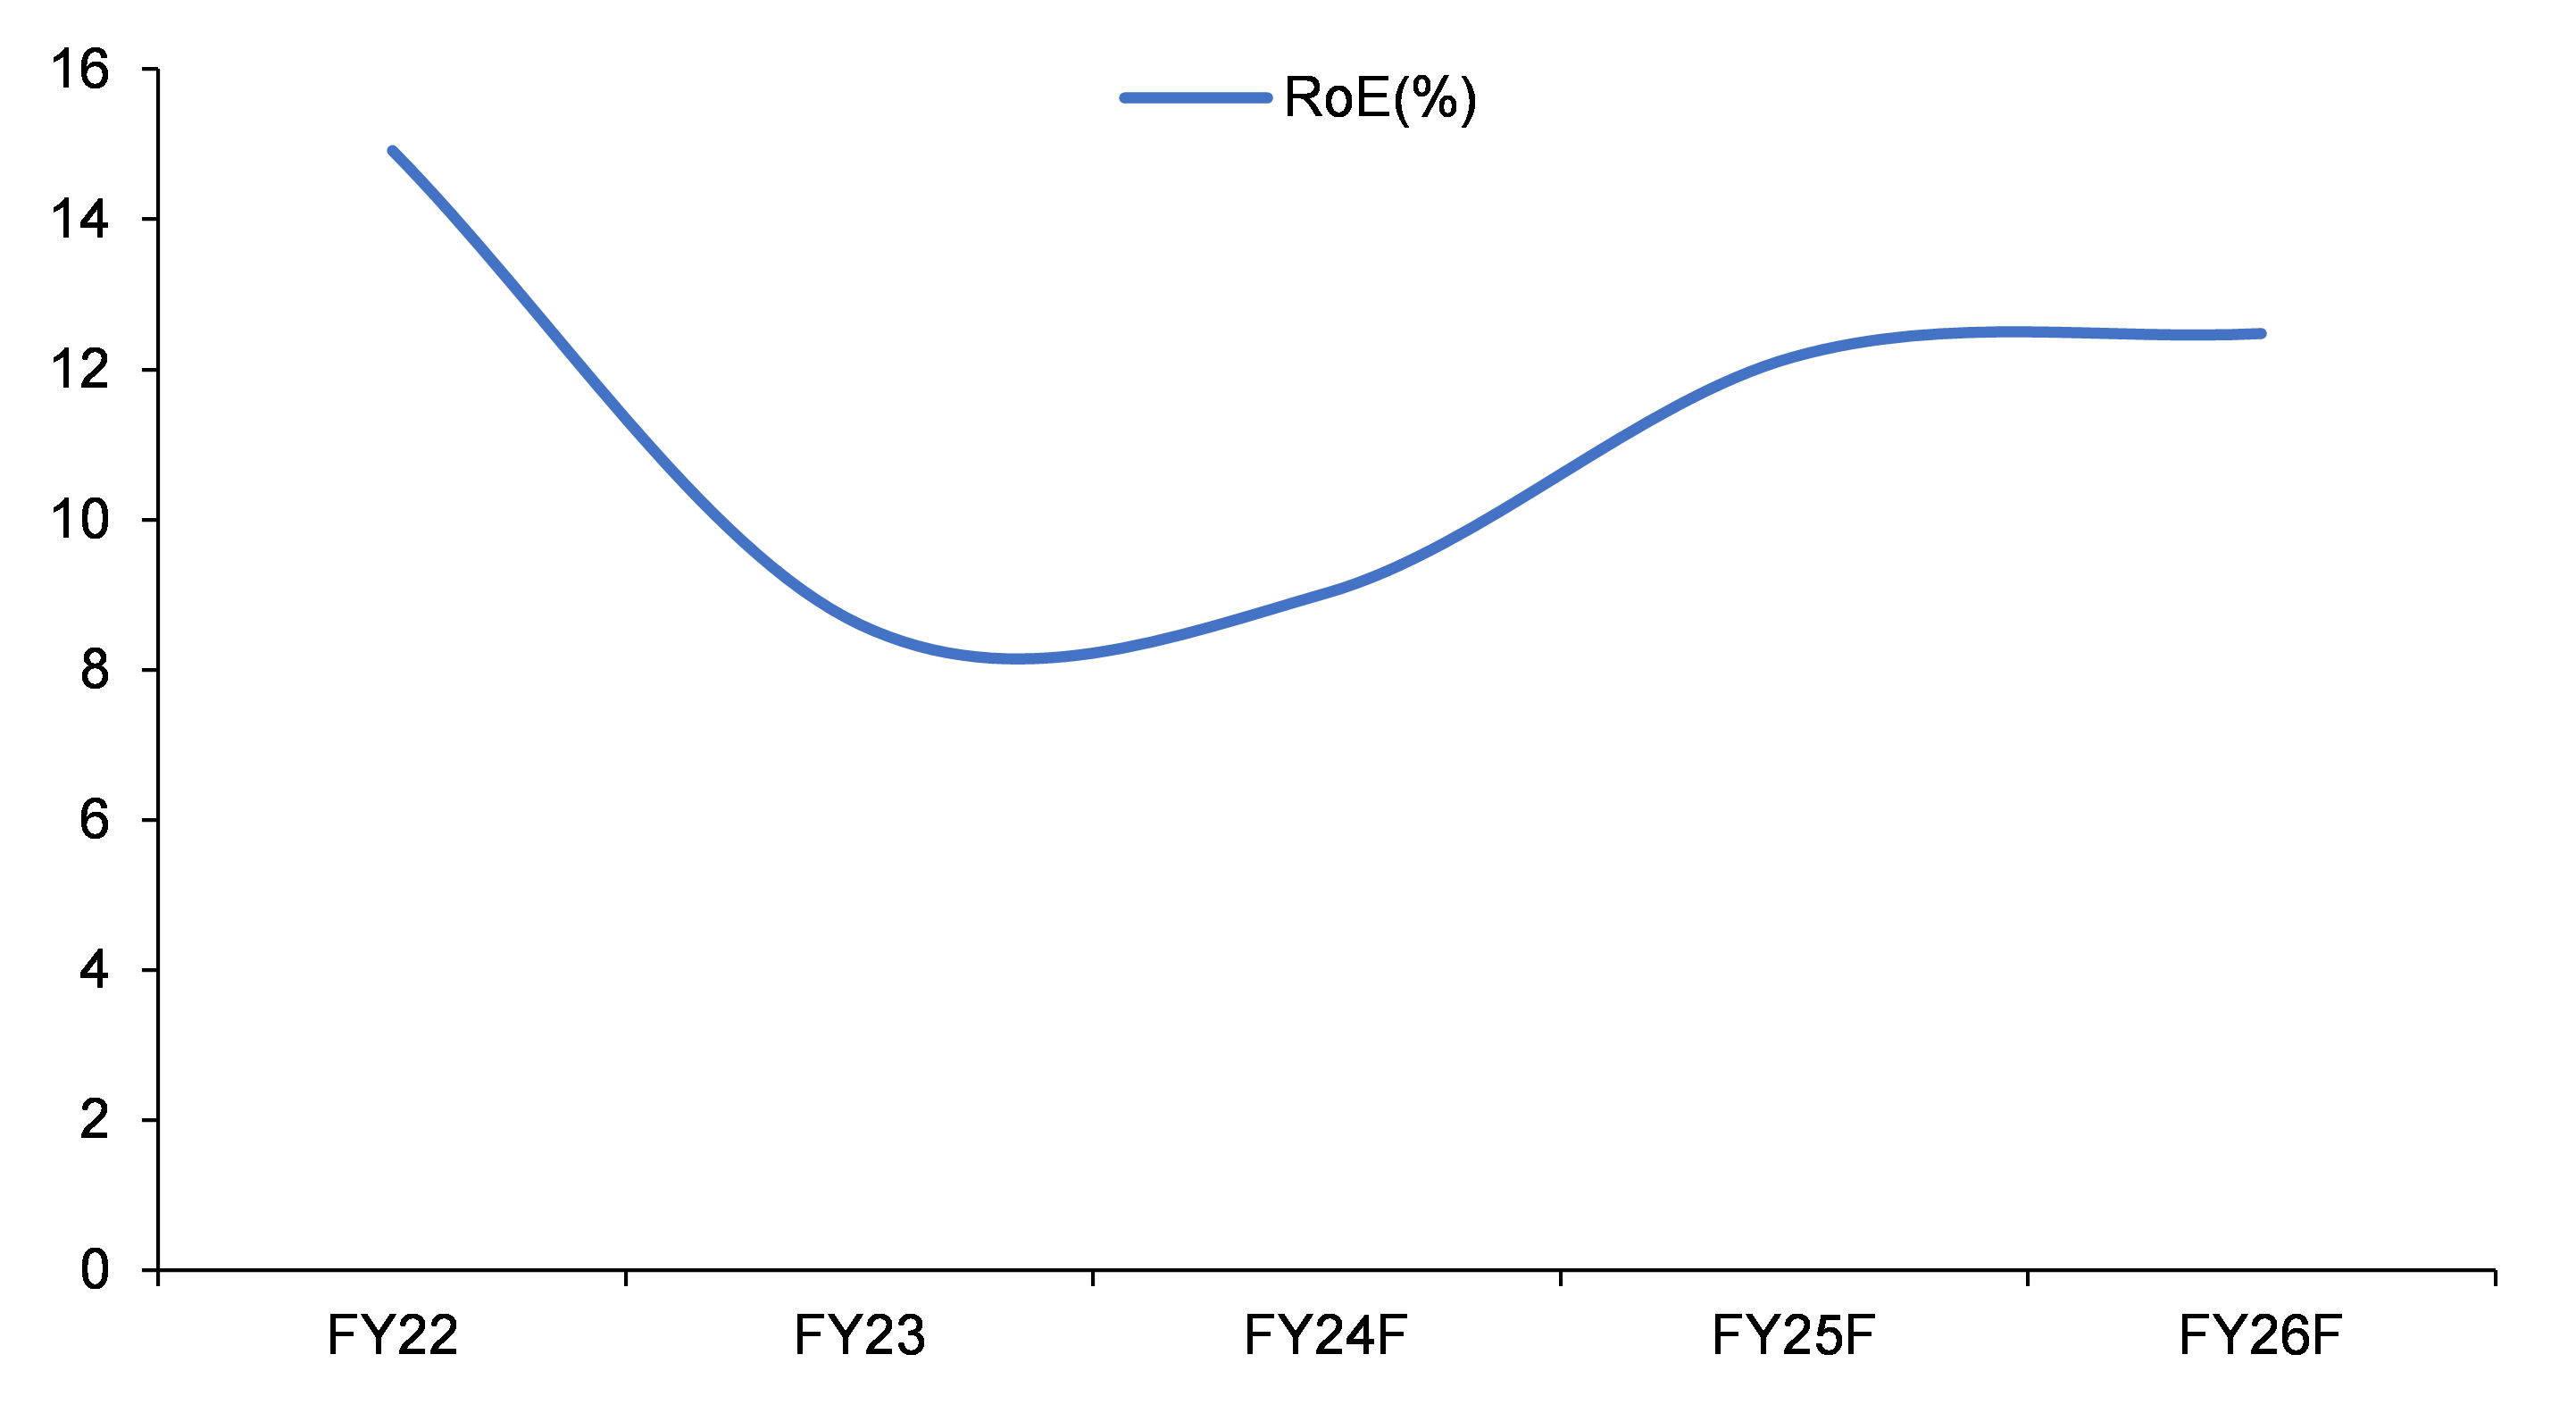
The EPS growth rate of HEG for the next two years is good, in our view, at an 18% CAGR (FY24F-25F). At the same time, we believe the company’s RoE will increase from 12% in FY23F to 17% in FY25F. What will benefit HEG in the coming years is the rising focus of corporates on decarbonization and addition of new EAF capacity in the US. We are currently observing high inventory levels in US steel companies which, we believe, will decrease as the year progresses, leading to an upcycle and growth in the share price by the end of FY24F. HEG’s lithium-ion graphite anode capex will be online by FY25F, which will further improve the EPS of the company.

Figure 17: Rising RoE leads to improvement in profitability

SOURCE: INCRED RESEARCH, COMPANY REPORTS  


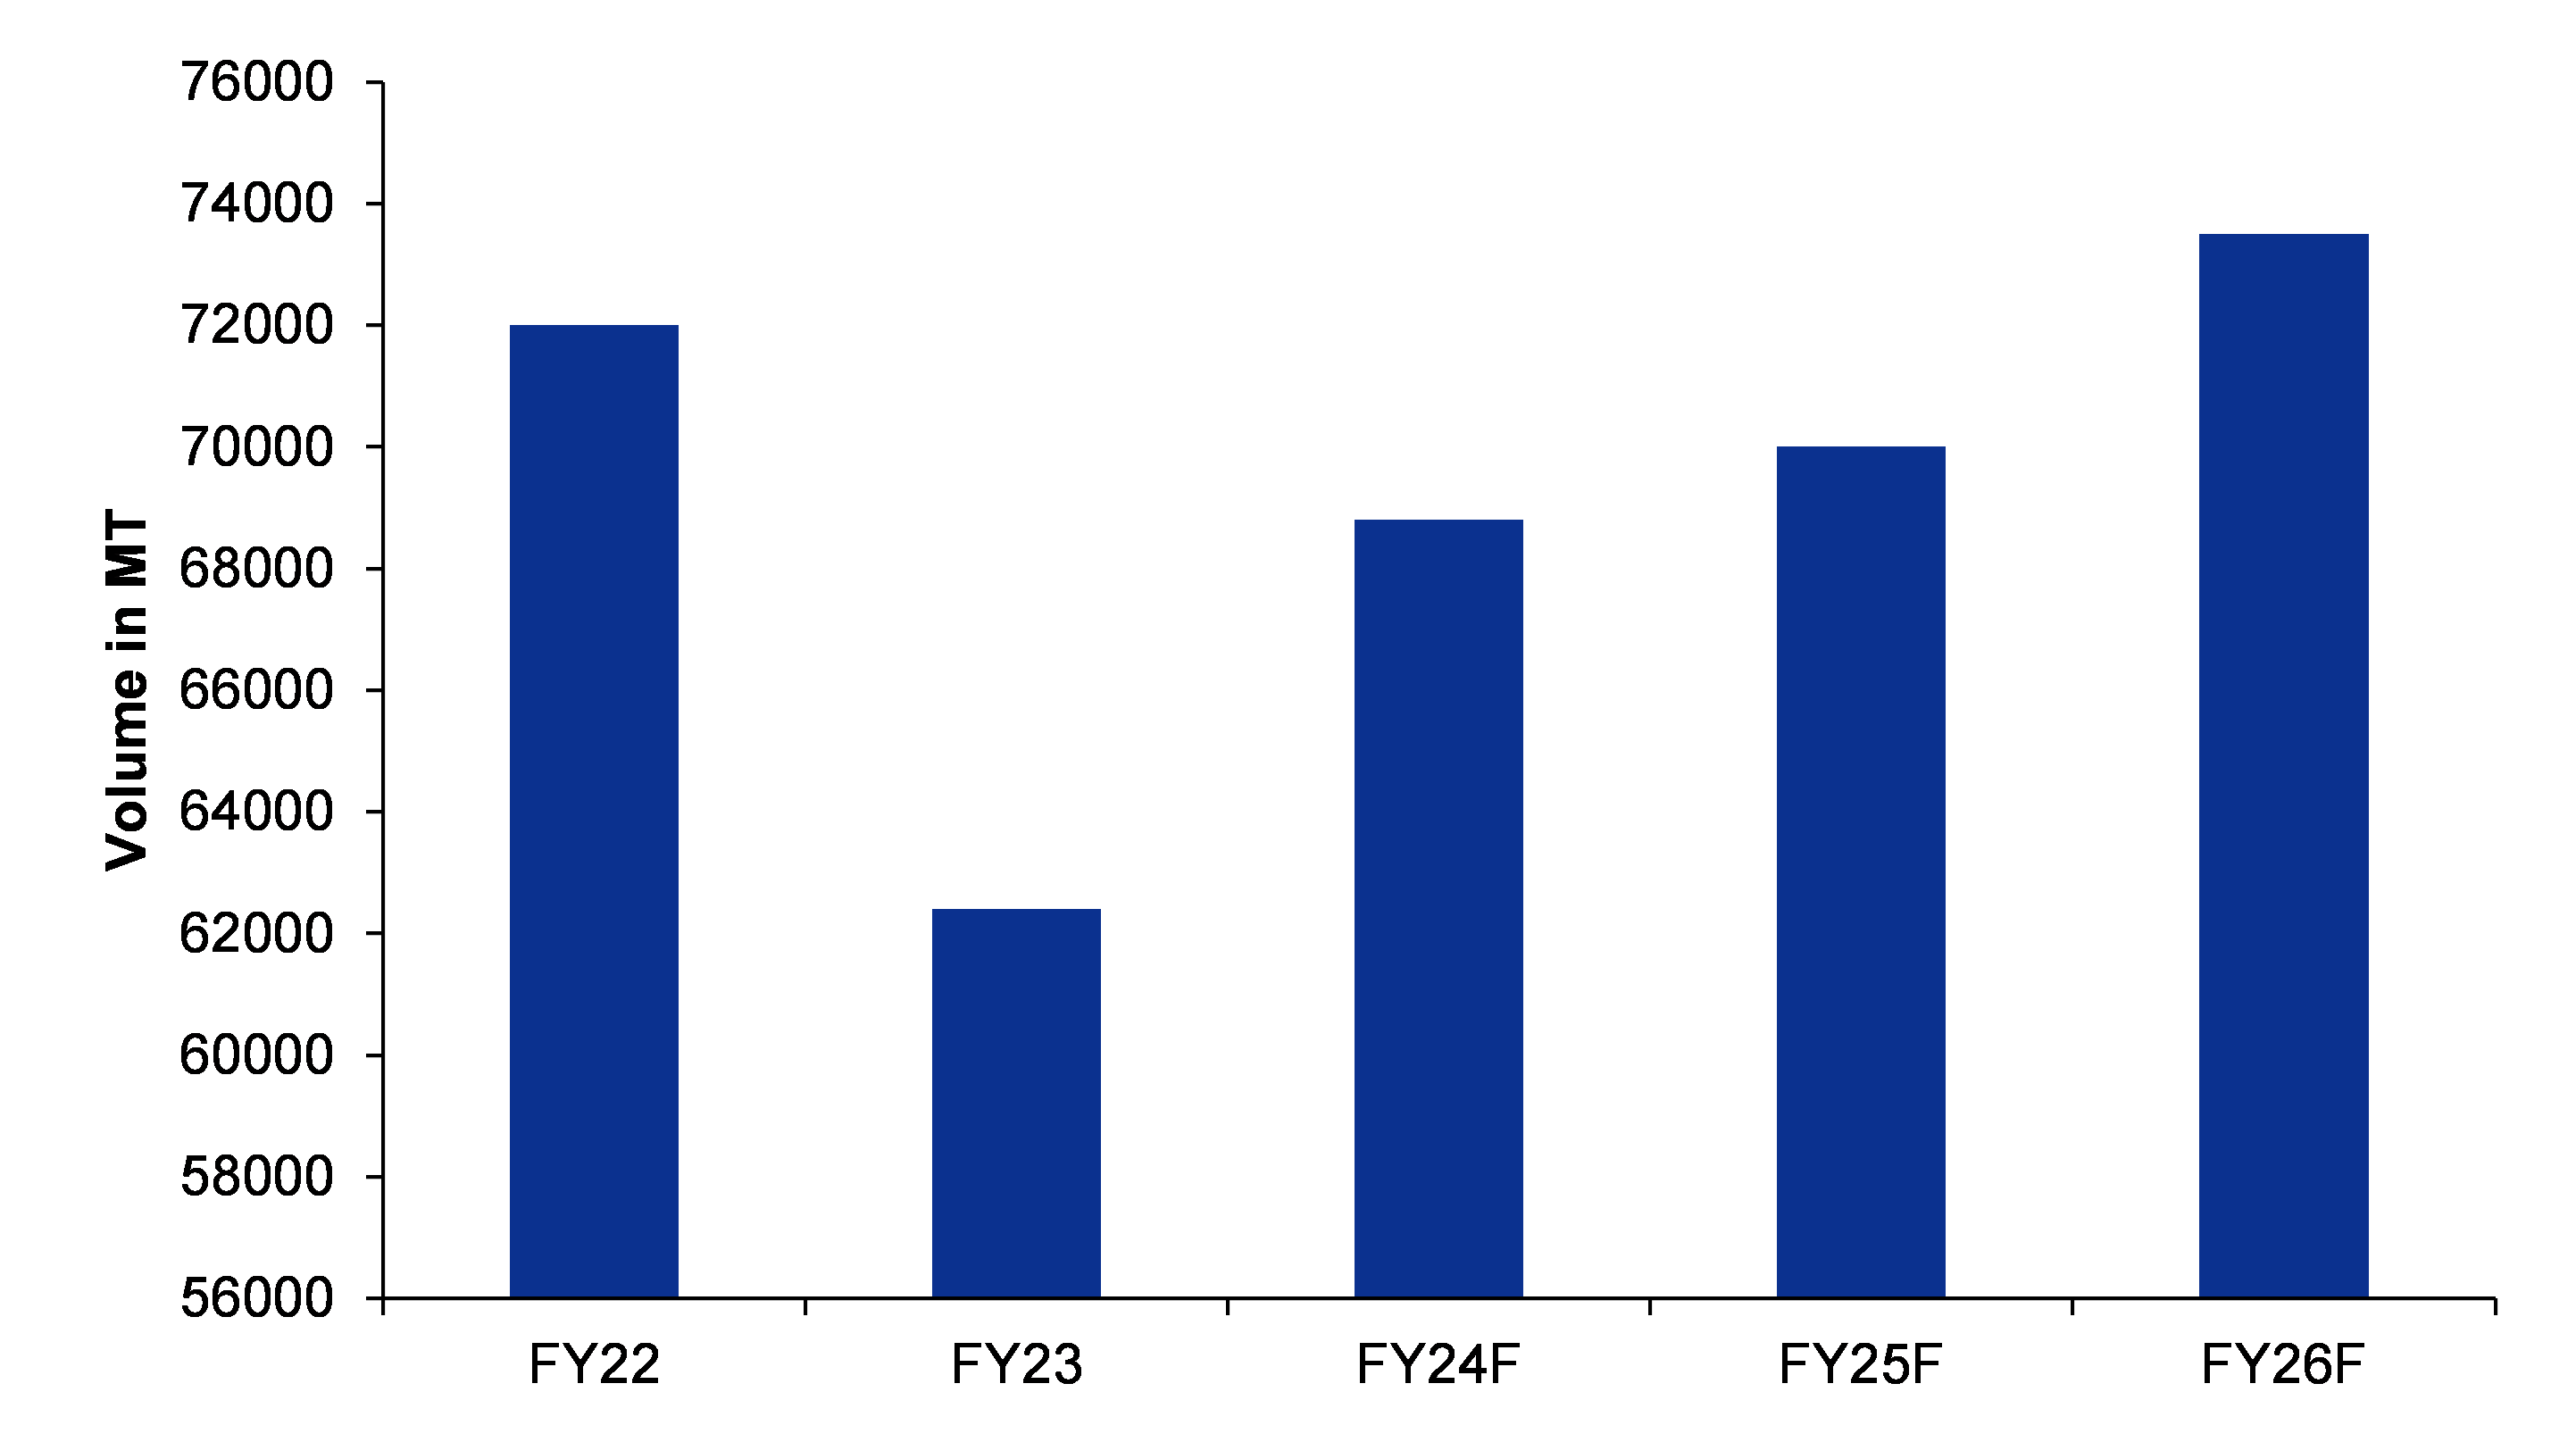
Figure 18: Even with a conservative volume growth, there is a significant upside for HEG

SOURCE: INCRED RESEARCH, COMPANY REPORTS  

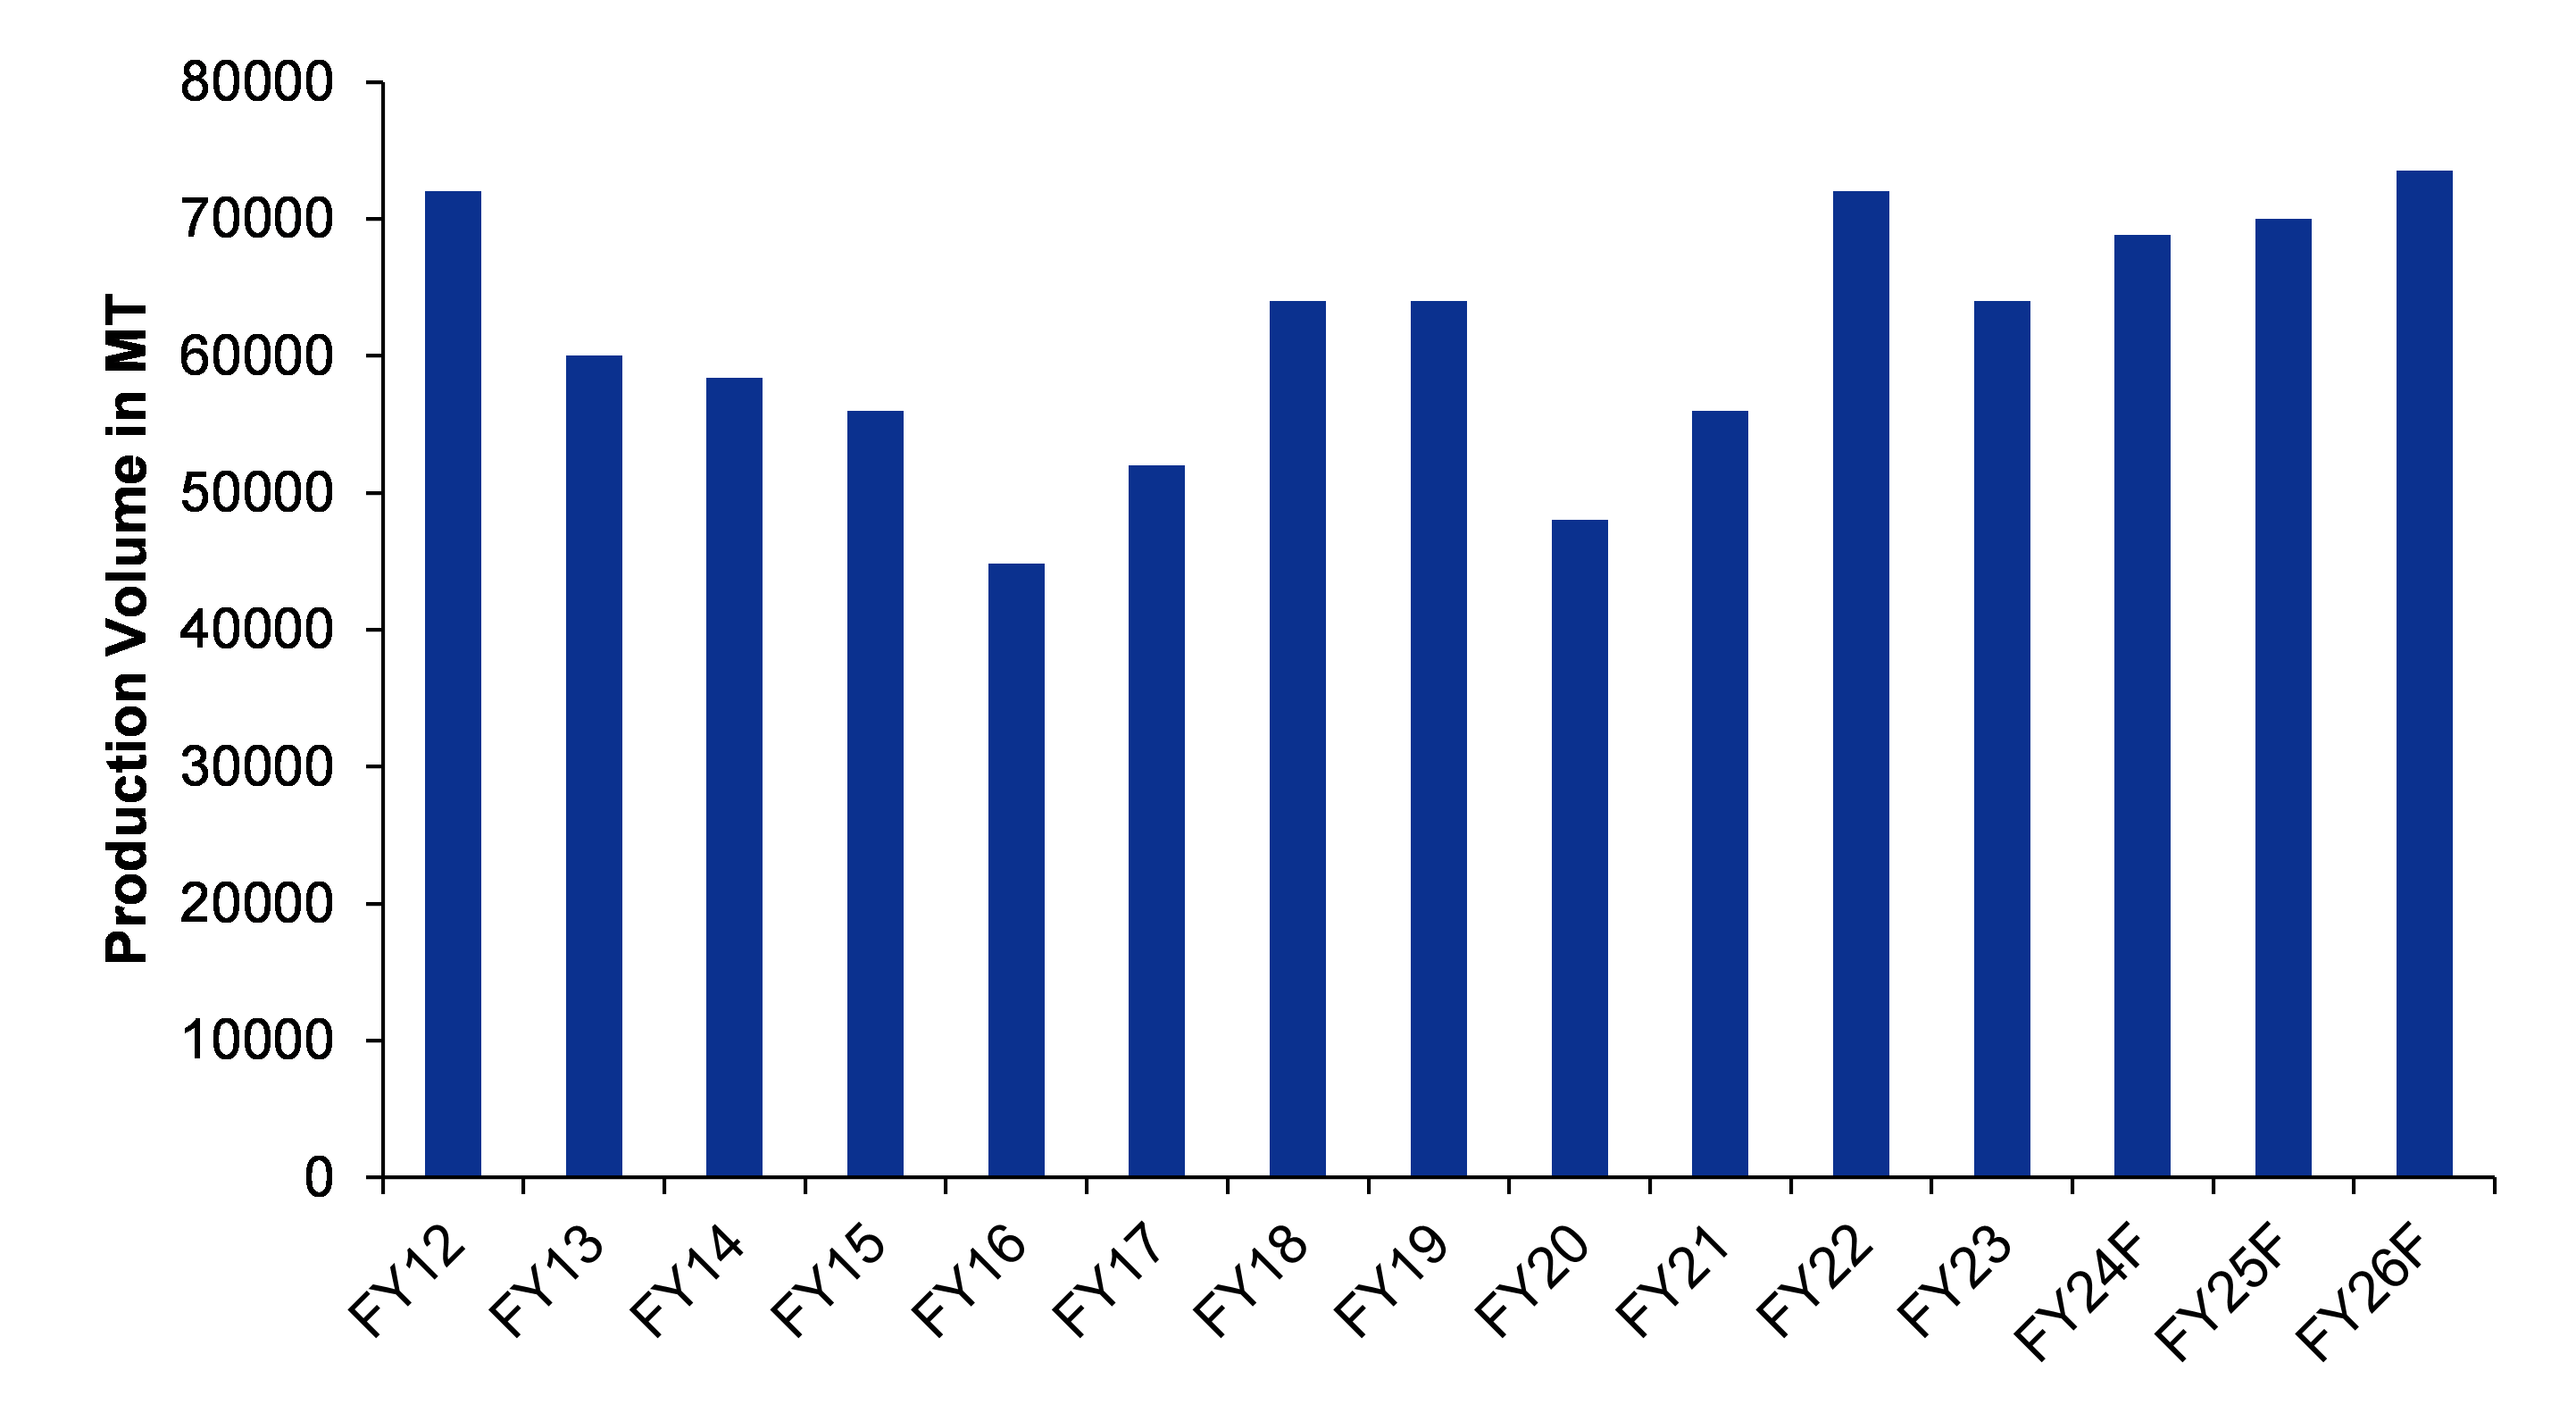
We expect HEG to regain its volume by FY25F. Although there are recession fears in the US currently, as the steel inventory declines and the new EAF-based steel capacity comes online, we expect HEG to improve its capacity utilization and EBITDA.

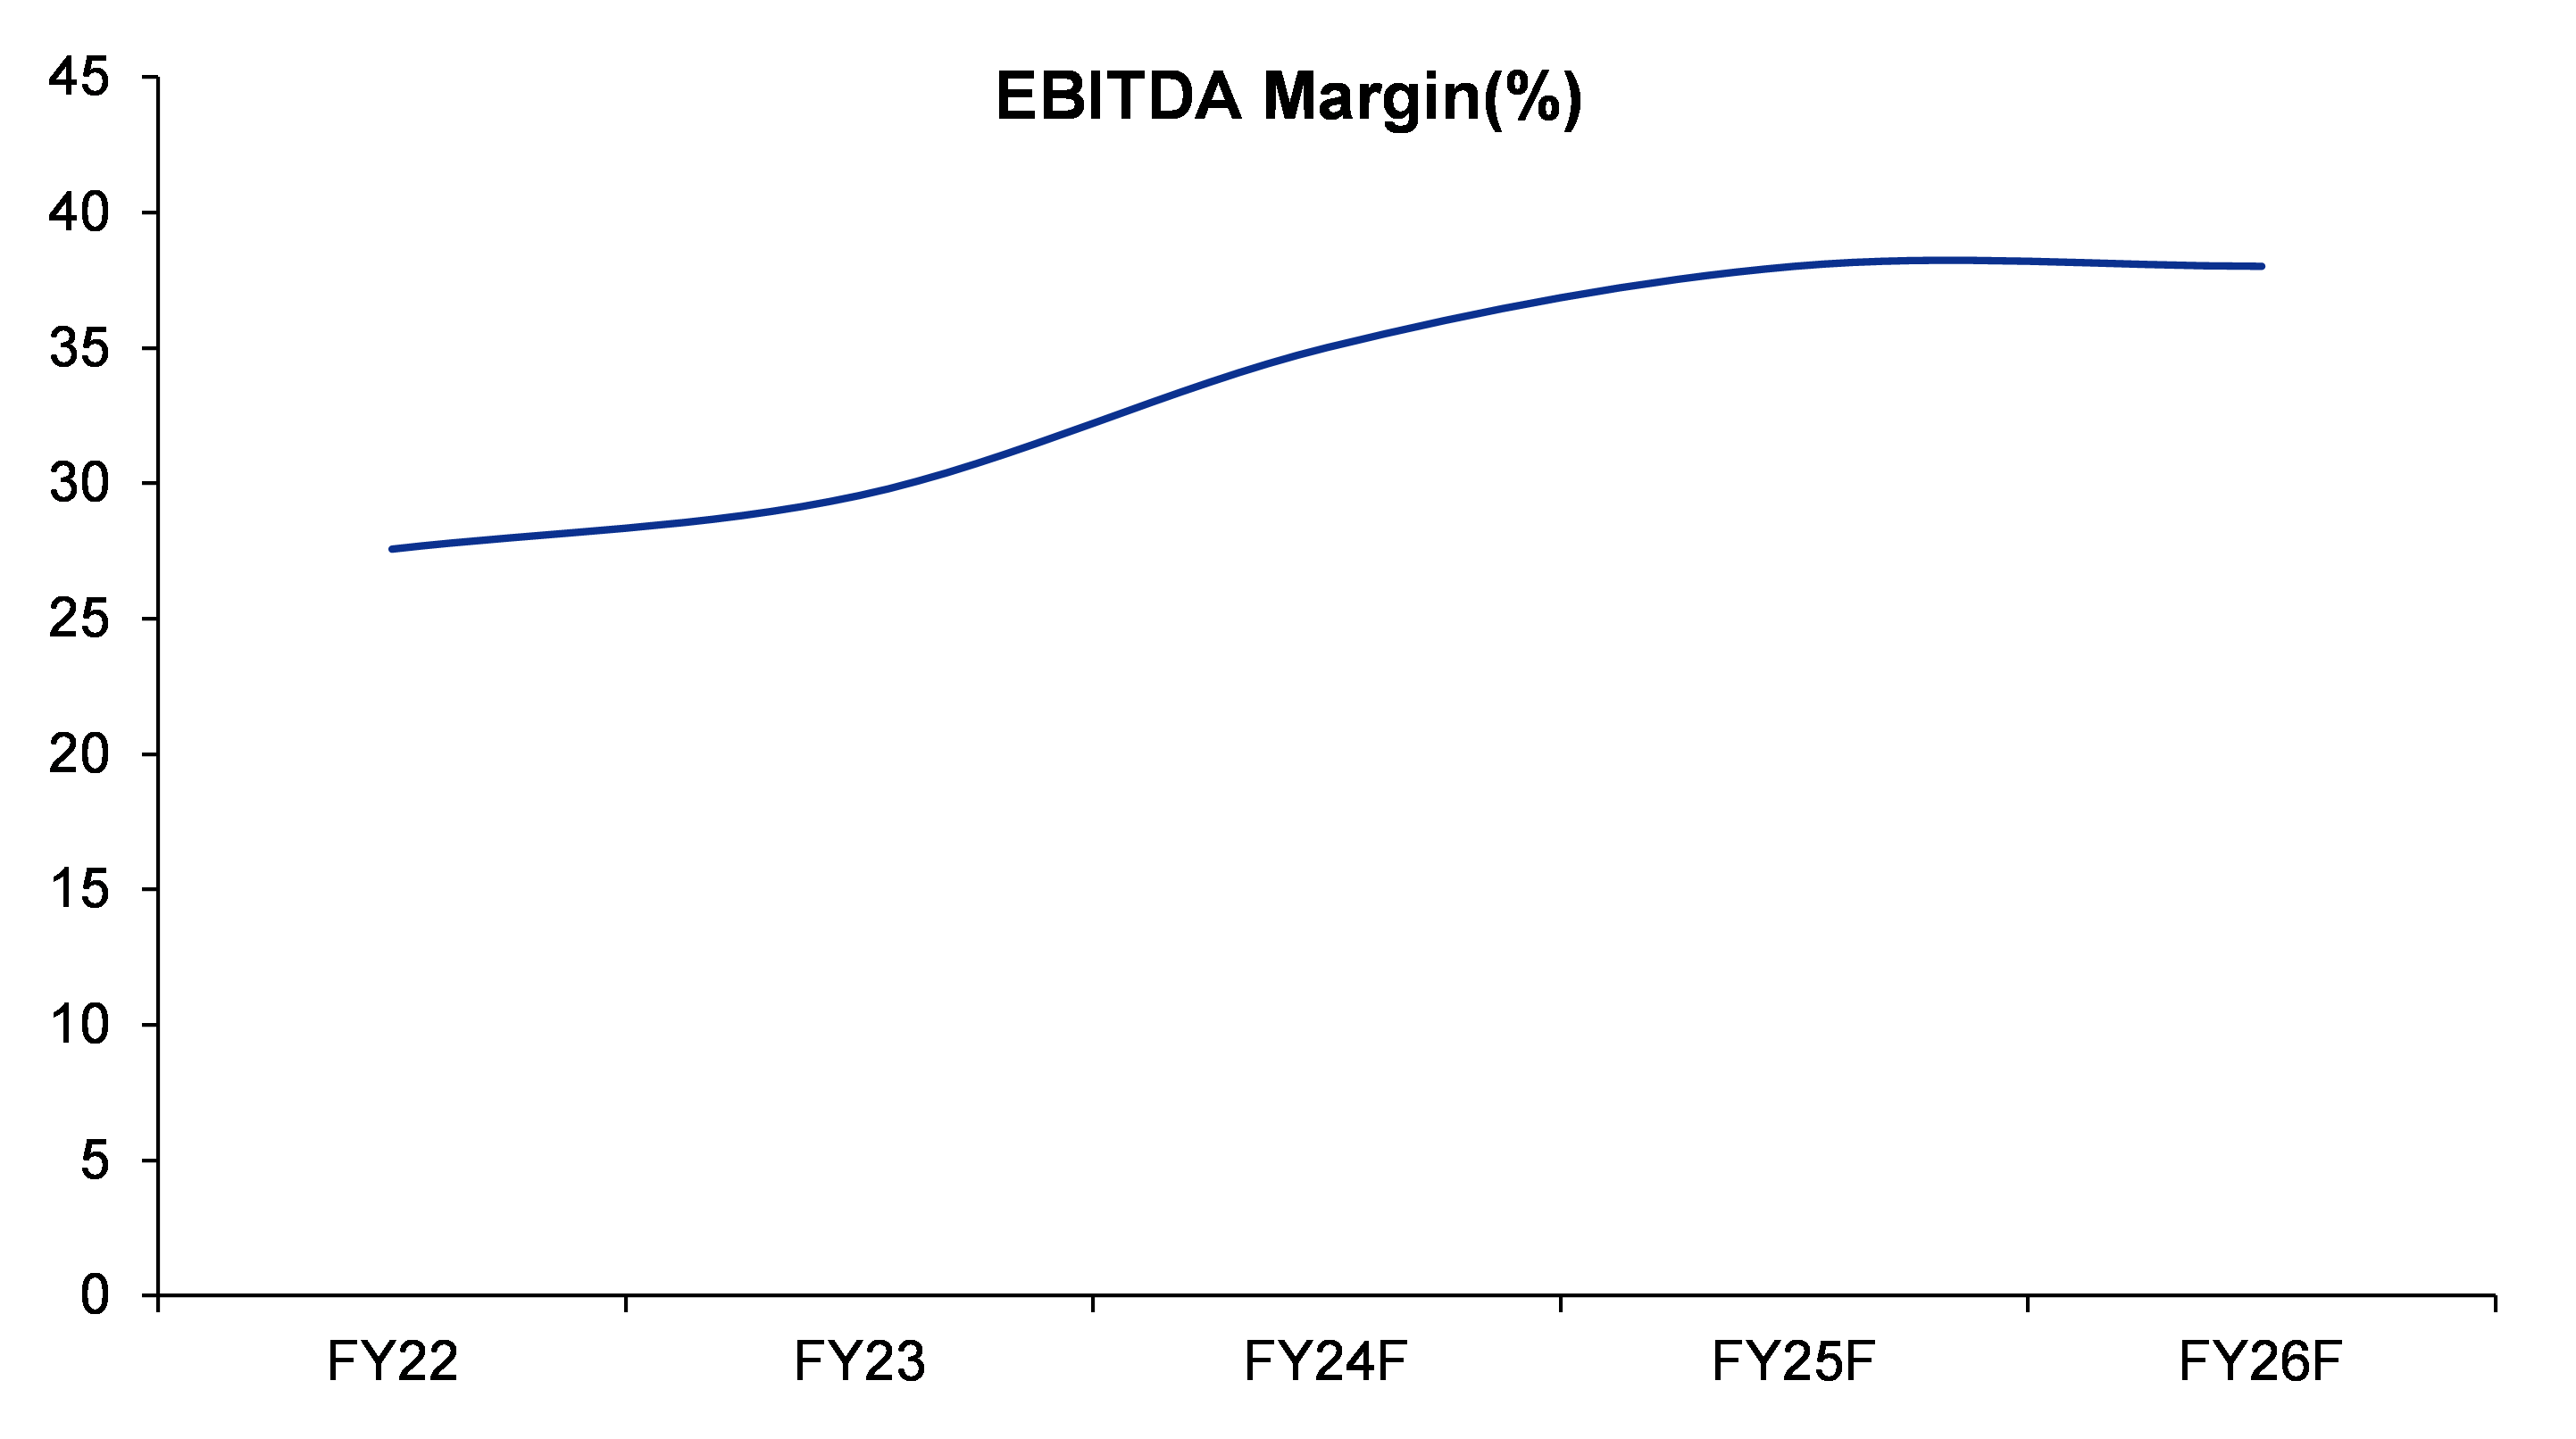
Figure 19: Estimated EBITDA margin of HEG

SOURCE: INCRED RESEARCH, COMPANY REPORTS  

In our model, we have assumed a sustainable EBITDA margin of 30% (according to the company’s management) but still it leads to a significant upside in the stock price. Our financial model only focuses on volume-led growth, rather than pricing-led growth, as pricing-led growth is not sustainable.

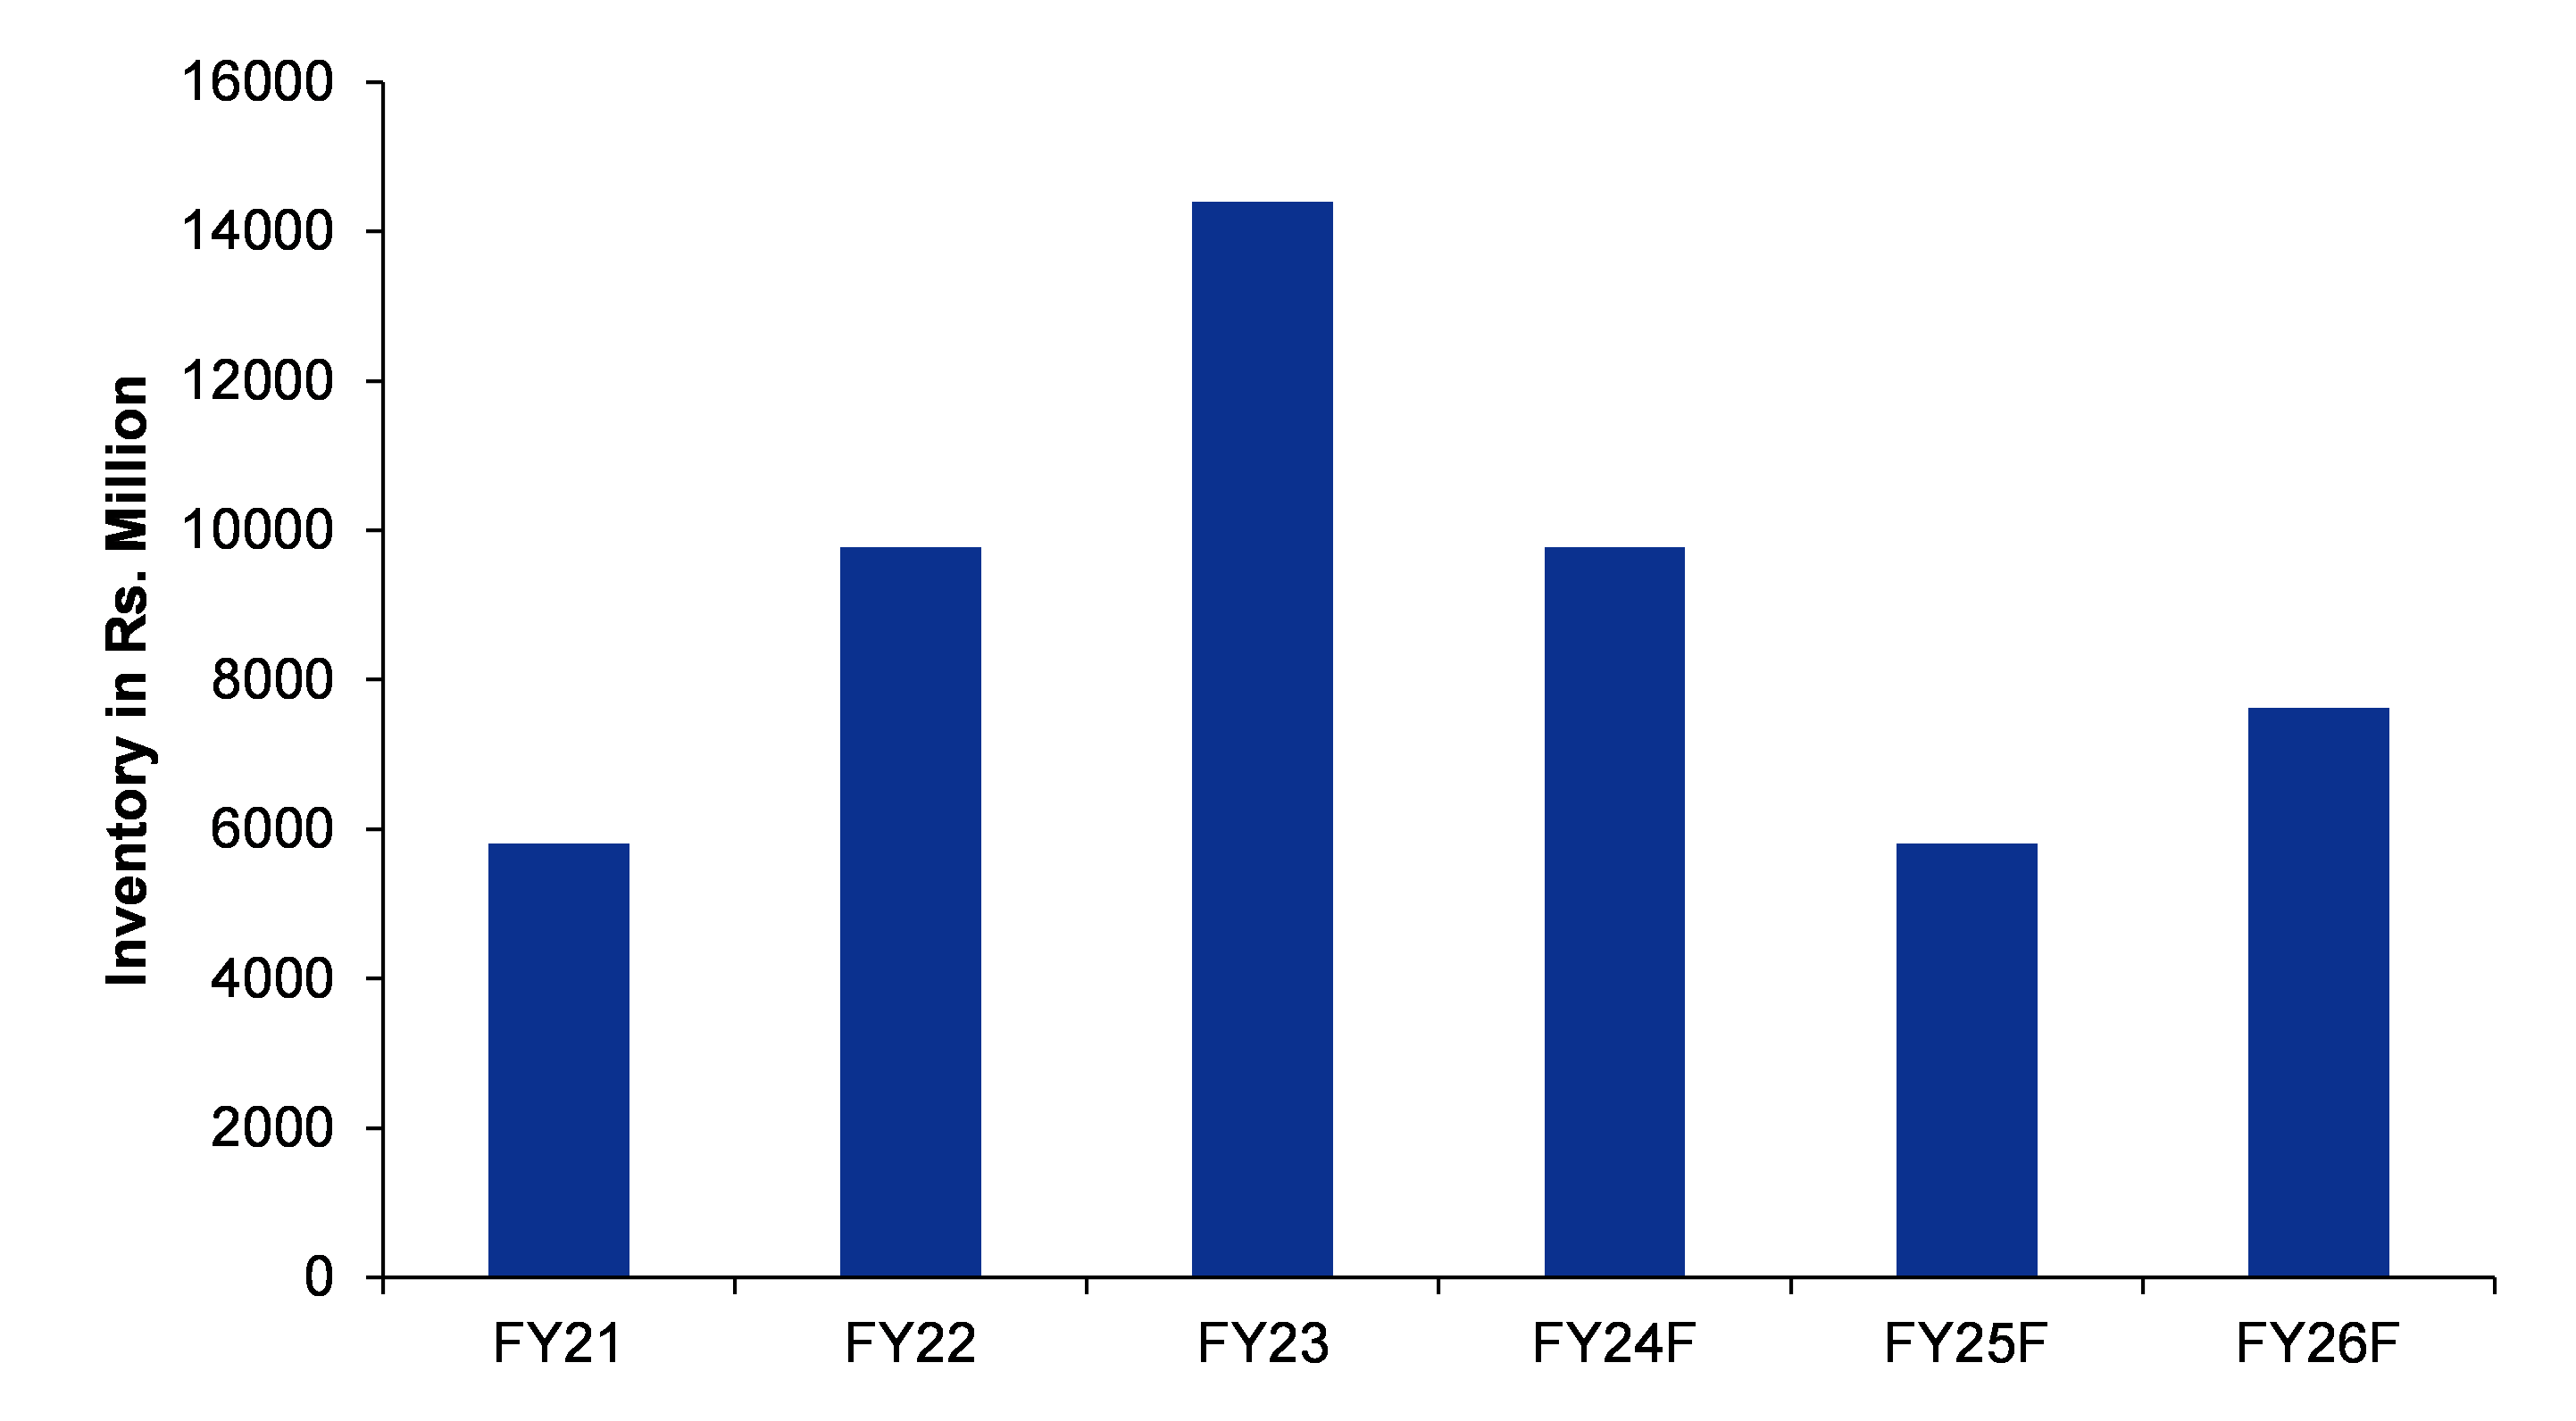
Figure 20: The inventory situation is expected to improve as excessive inventory of steel mills decline; it is also important to note that, HEG always keeps three to five months’ raw material inventory to mitigate the supply chain risk associated with the import of needle coke

SOURCE: INCRED RESEARCH, COMPANY REPORTS


Figure 21: HEG’s production volume is expected to increase moderately, as per our model, thus underlying a conservative valuation model

SOURCE: INCRED RESEARCH, COMPANY REPORTS


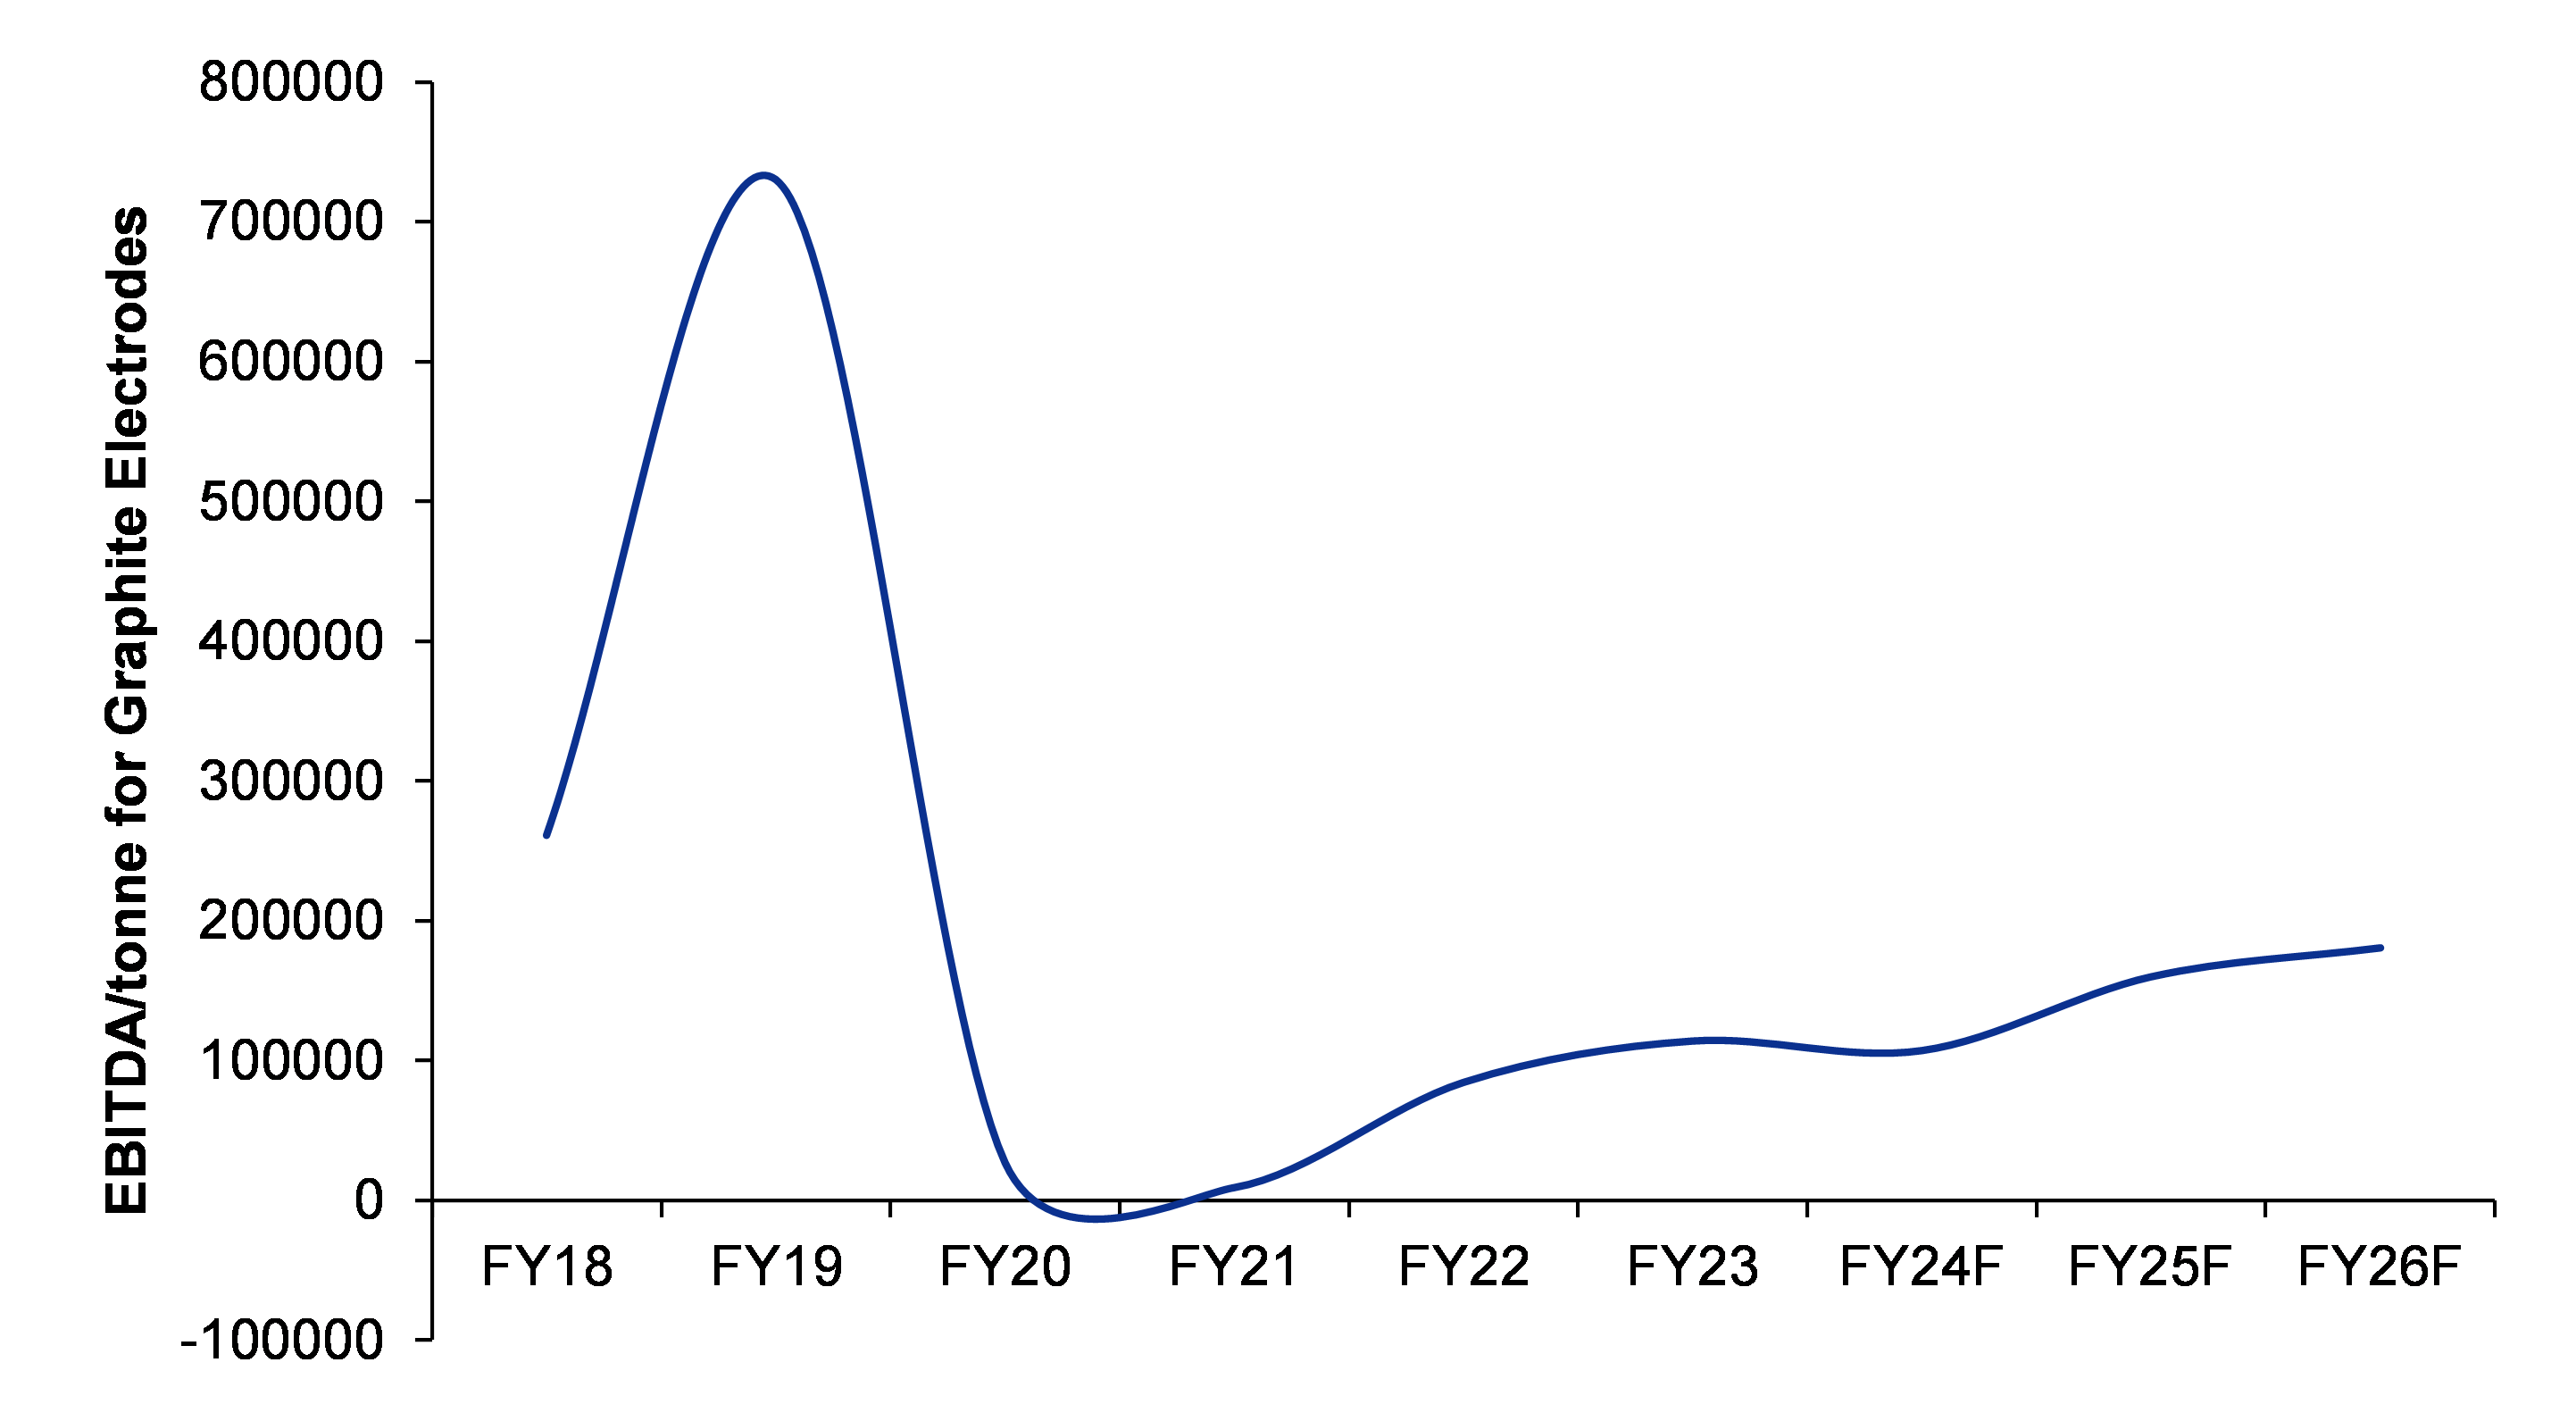
Figure 22: EBITDA/t shows a gradual improvement.

SOURCE: INCRED RESEARCH, COMPANY REPORTS


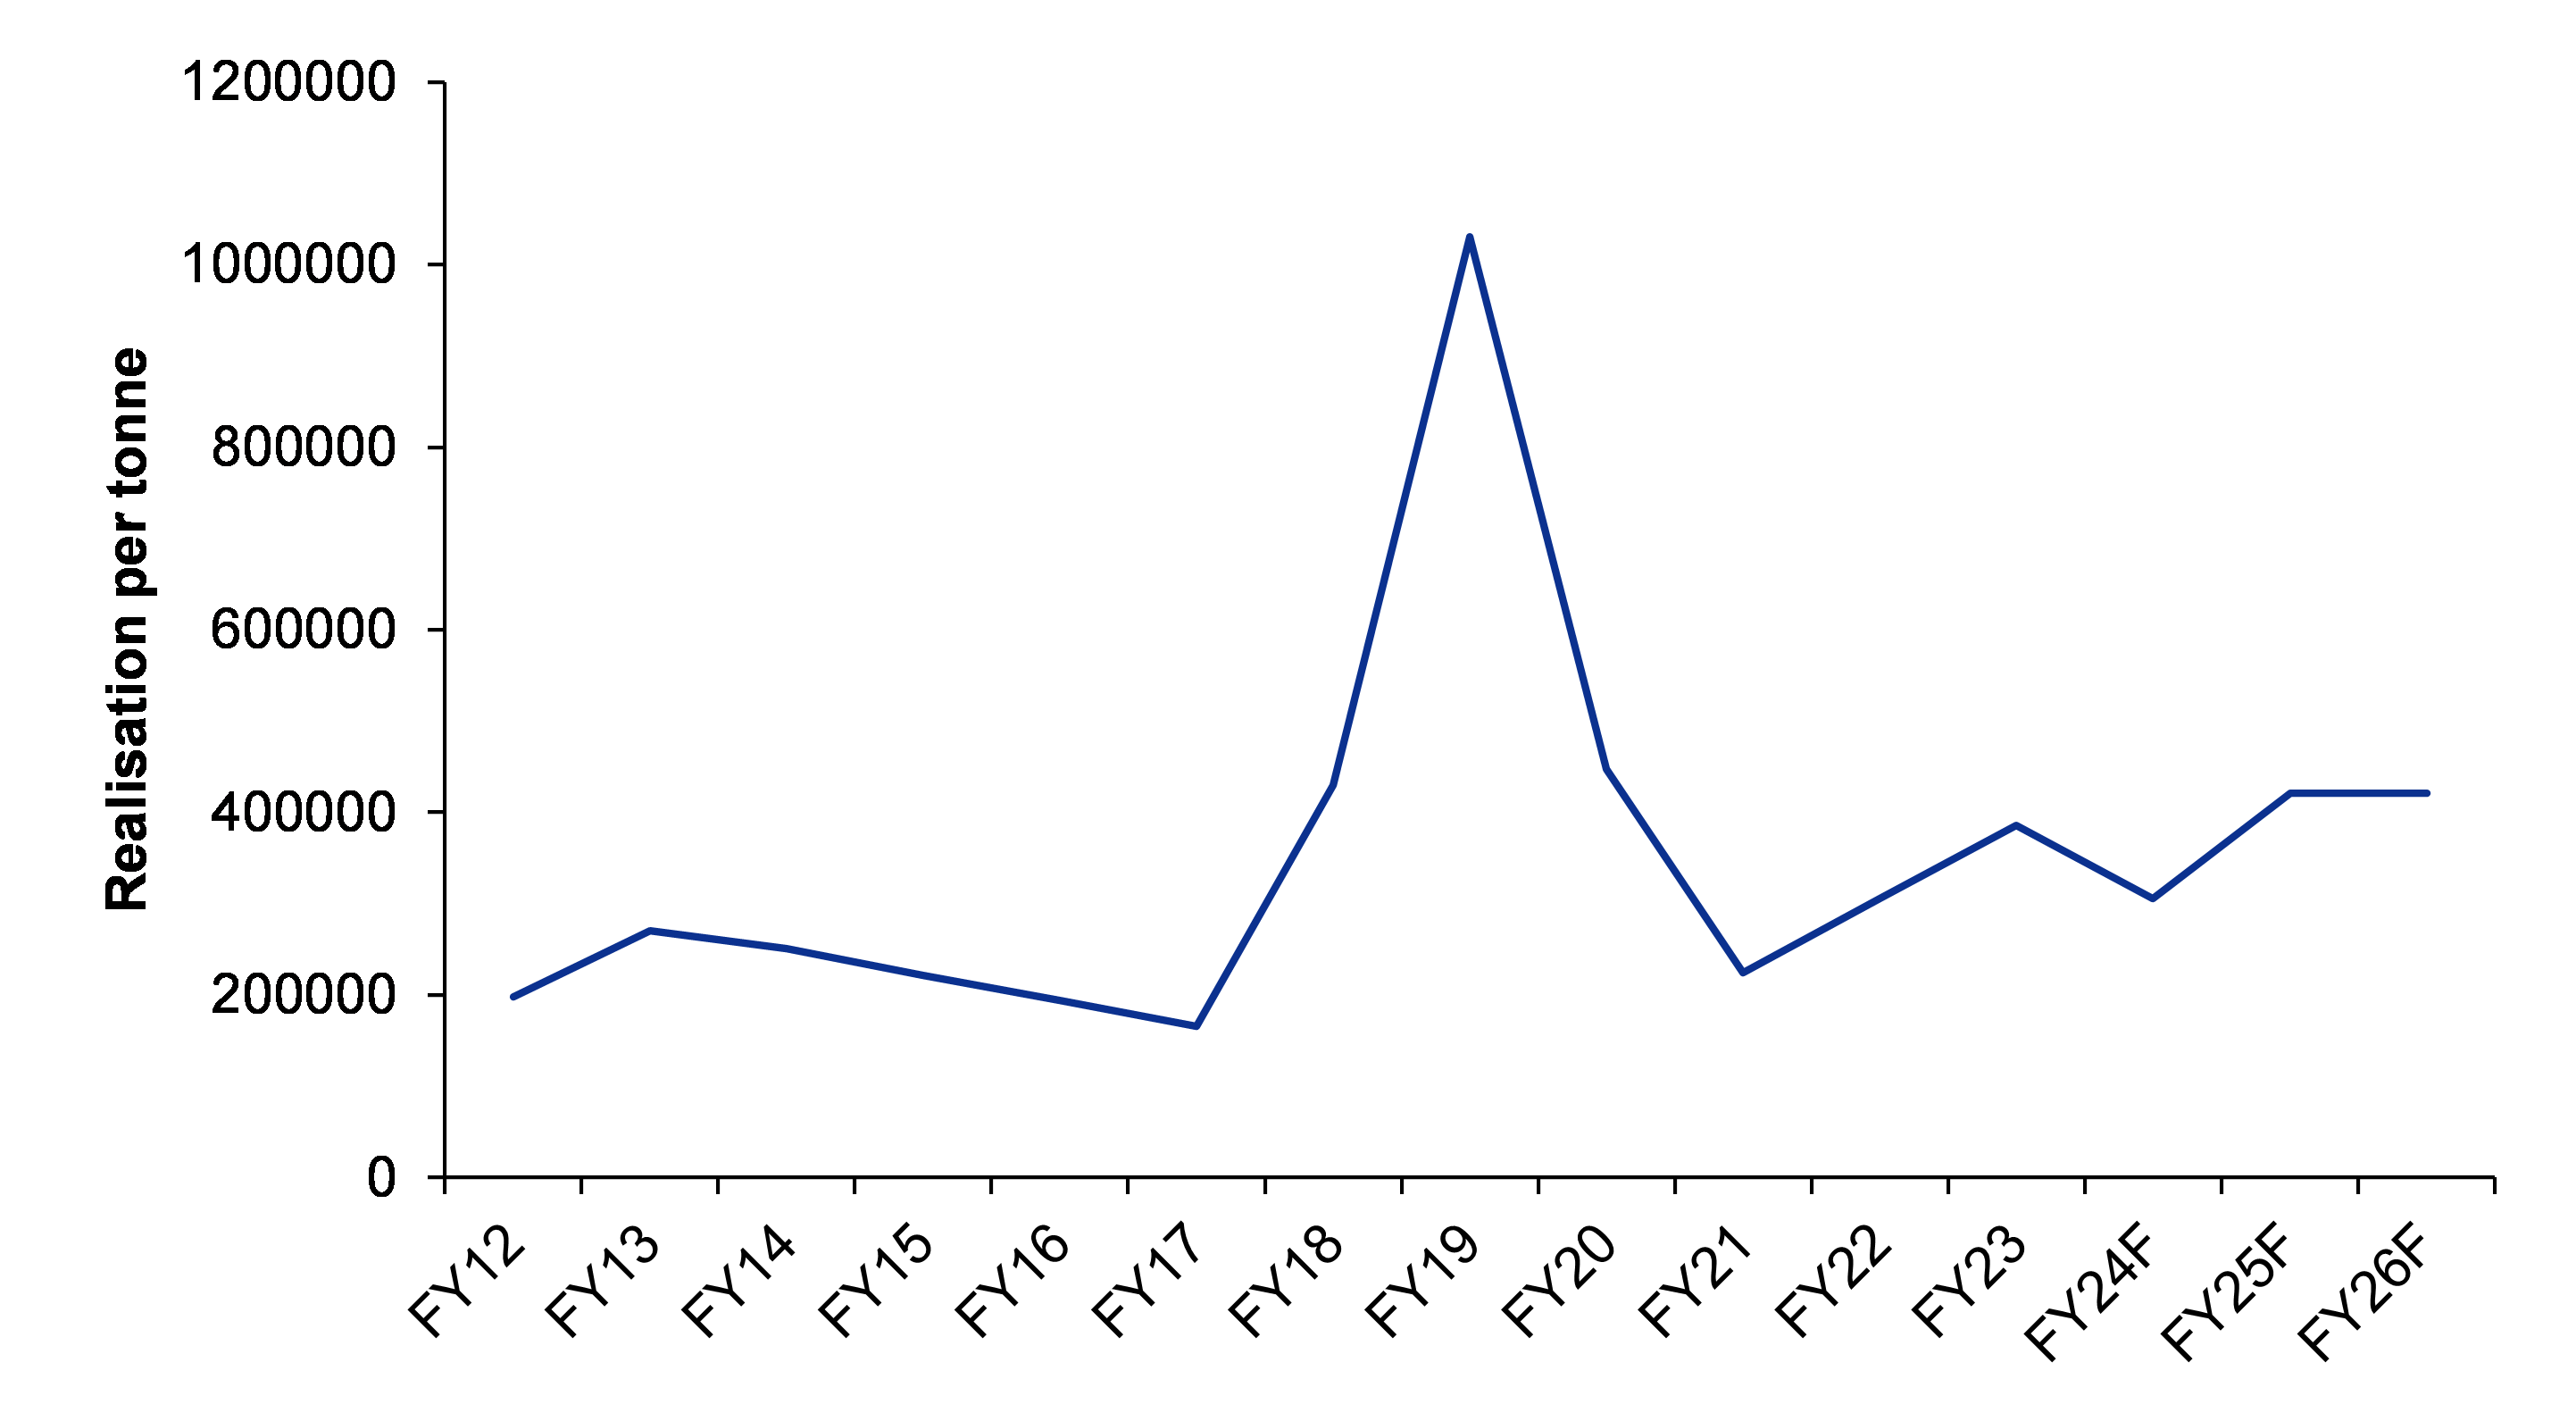
Figure 23: HEG’s realization/t is expected to improve marginally, but remain below historical highs

SOURCE: INCRED RESEARCH, COMPANY REPORTS


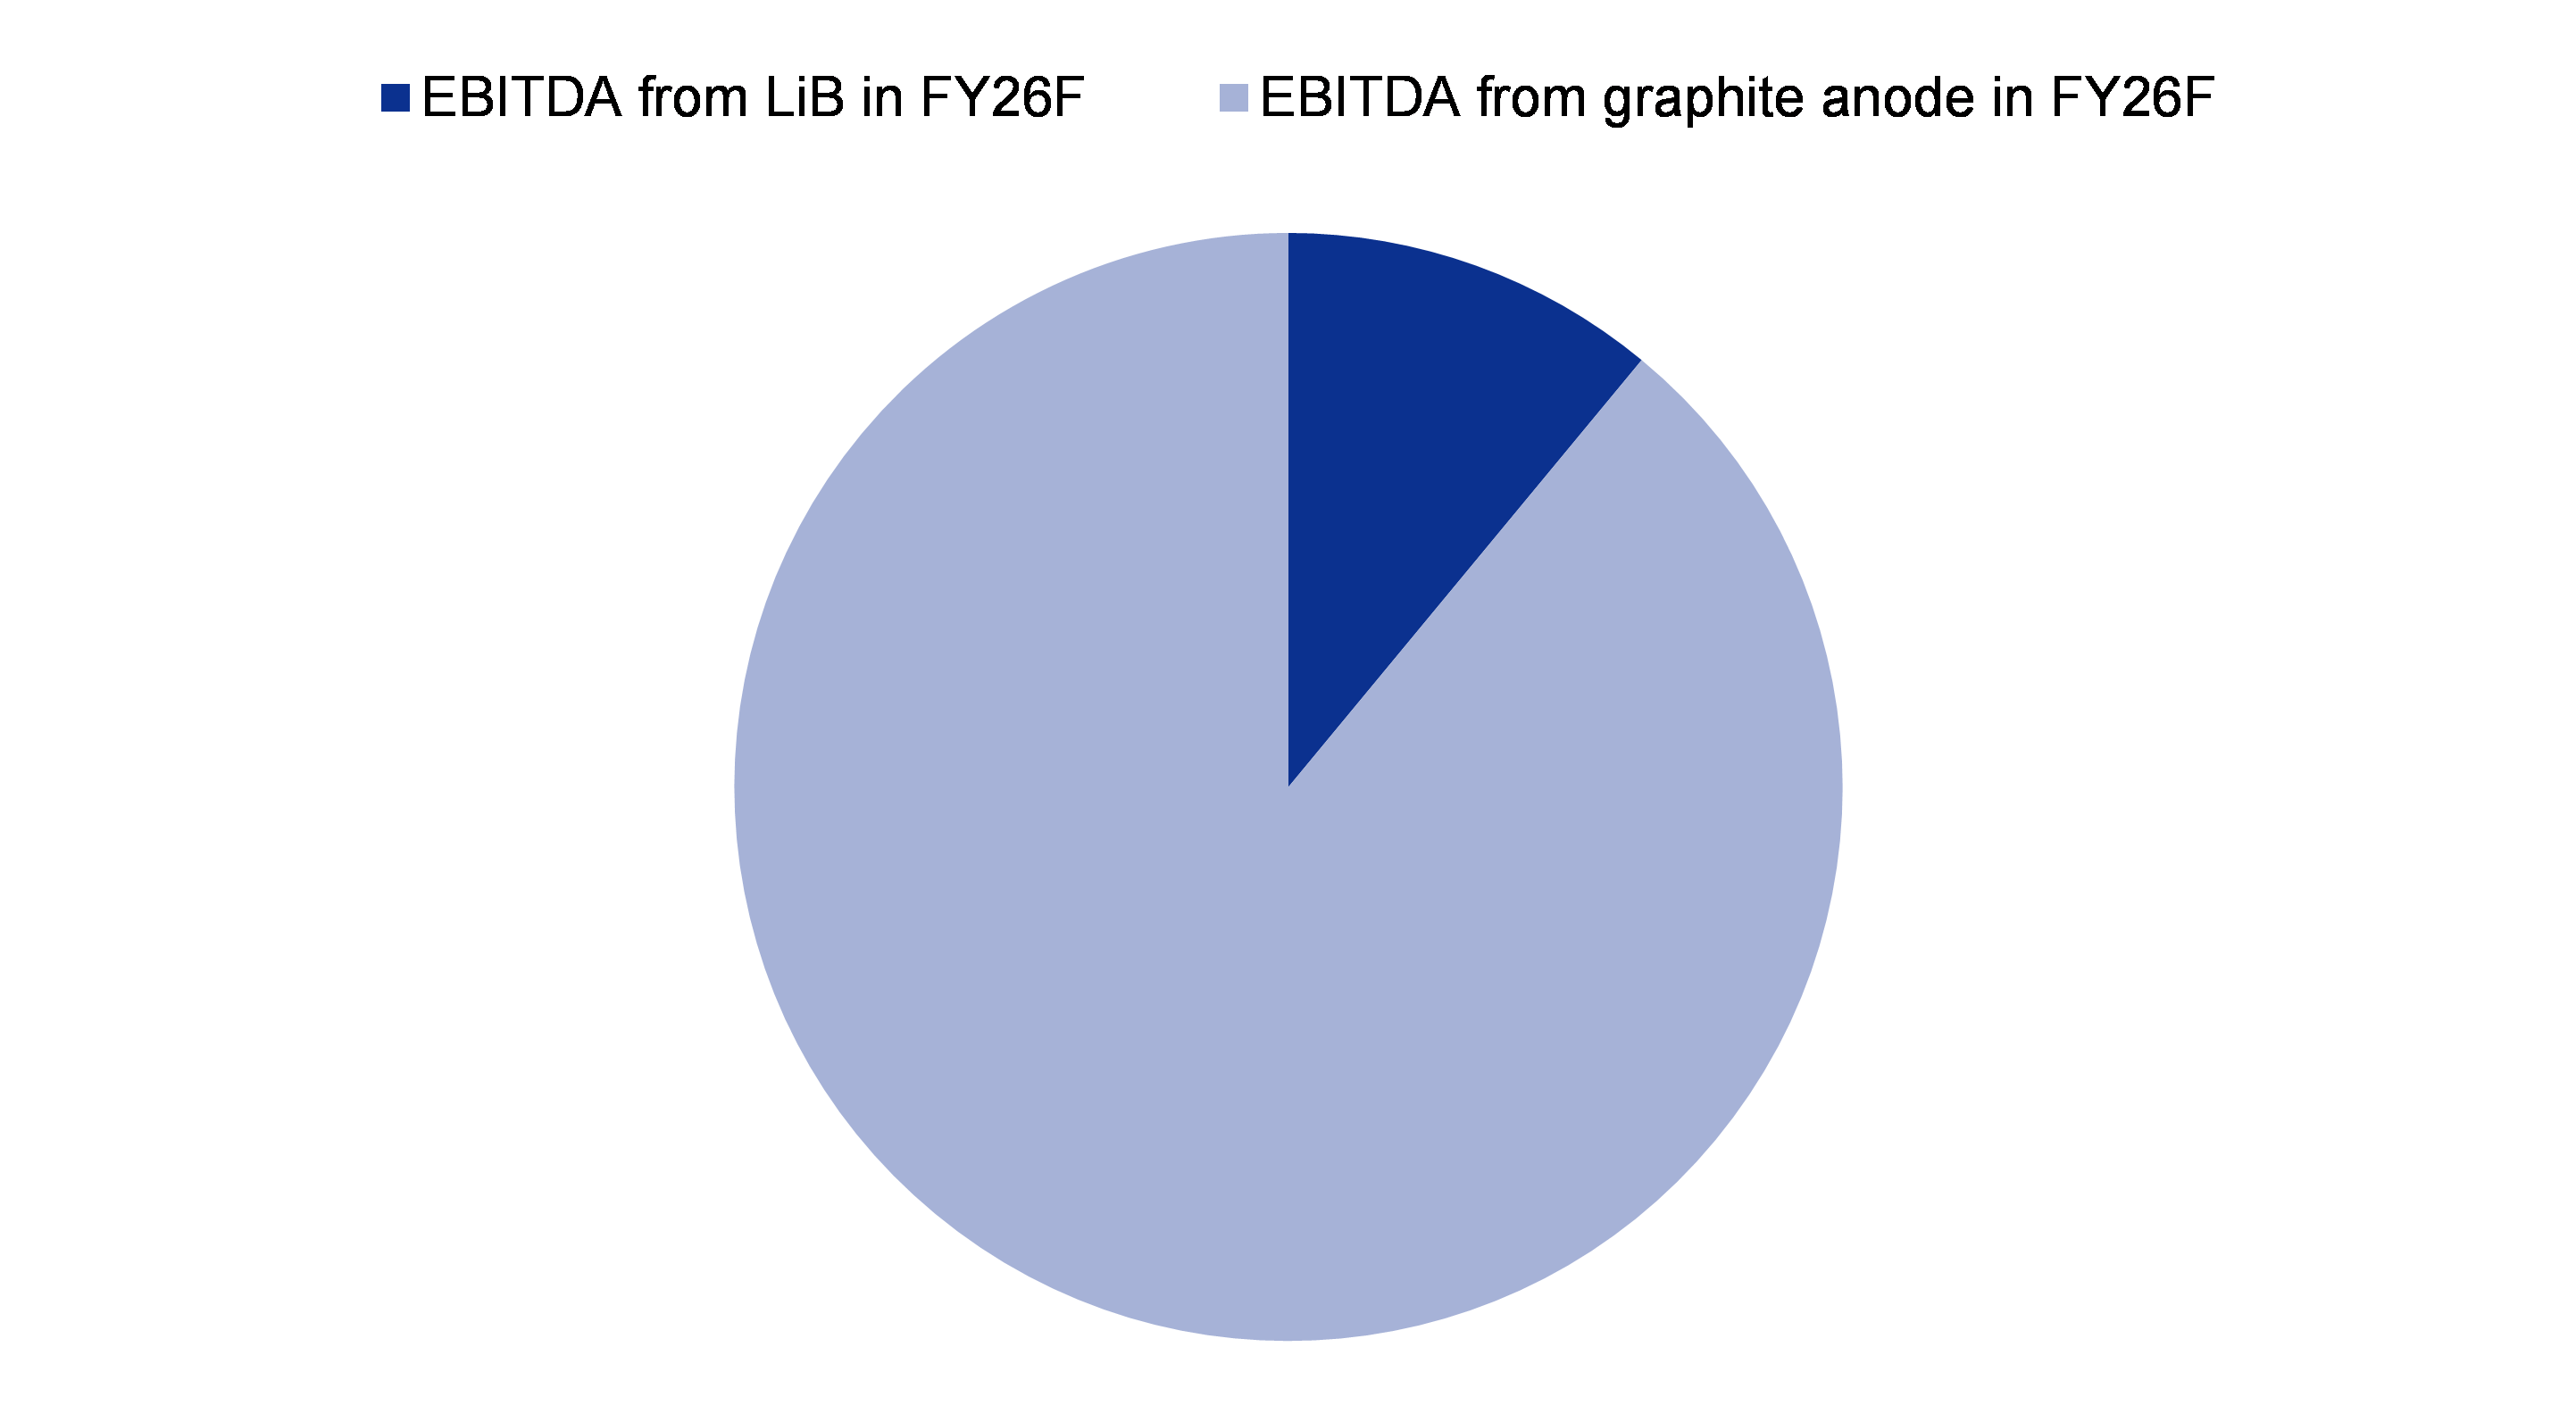
Figure 24: In FY26F, when HEG’s graphite anode plant comes online, it is expected to contribute around 11% to its EBITDA while running at a 40% capacity

SOURCE: INCRED RESEARCH, COMPANY REPORTS

We have used EV/EBITDA to value commodity companies

We have valued HEG on a P/BV basis as we consider it a more appropriate valuation method for commodity companies than the discounted cash flow or DCF or P/E methodologies. In our view, DCF is not a suitable valuation method because the earnings of commodity companies are highly cyclical and forecasting long-term earnings reliably is very difficult. We believe a P/E based forecast is inappropriate as the company has suffered huge volatility in its earnings in the past, and sometimes even negative earnings.

Figure 25: Target price valuation

SOURCE: INCRED RESEARCH, COMPANY REPORTS


Figure 26: We have assigned HEG a P/BV multiple of 1.8, 0.5 standard deviation from the historical mean of 1.3

SOURCE: INCRED RESEARCH, COMPANY REPORTS

We expect the inventory of steel mills to decline in the next two years, leading to improved volume growth and hence, improved EBITDA margin.

The US has introduced the Infrastructure Investment and Jobs Act, which will lead to significant capex addition, but US steel mills’ production is not rising, which will lead to a decrease in excess inventory.

The volume growth, which HEG is expected to achieve, will mostly be achieved via the US market, as steel production via the EAF route in India has remained almost constant over the past decade.

HEG’s graphite anode plant for lithium-ion batteries is expected to be commercialized by FY25F, which will further act as a growth trigger for the company.

Downside risks

The major downside risk associated with HEG is the rise in prices of needle coke, which is a very important raw material for manufacturing graphite electrodes. HEG is completely dependent on imports for this raw material and hence, any change in global prices can have an impact on its margins.

HEG’s graphite anode plant for lithium-ion batteries, which is expected to be commercialized by FY25F, could be ultimately replaced by silicon anode, which doesn’t use graphite at all and hence, could prove to be a significant business risk.

Upside risks  

If the decarbonization trend catches on quickly, there could be a major upside for HEG. It must be noted that half of the world’s steel is still produced via the polluting blast furnace route, and any reversal of this will directly benefit HEG.

Key management personnel

Ravi Jhunjhunwala – Mr. Jhunjhunwala is an industrialist. He manages the Rs 36bn LNJ Bhilwara Business Group, the parent company of HEG. He holds a bachelor’s degree in commerce from Delhi University and a master’s in business administration from the Centre D’etudes Industrielles (CEI) Geneva. Mr. Jhunjhunwala joined HEG as a management trainee and has gone through a very well-planned grooming in all aspects of business management and was later assigned the reins of HEG as its managing director.


Annexure-1:Global steel maket analysis

Why steel-making through the EAF route works well for the US?

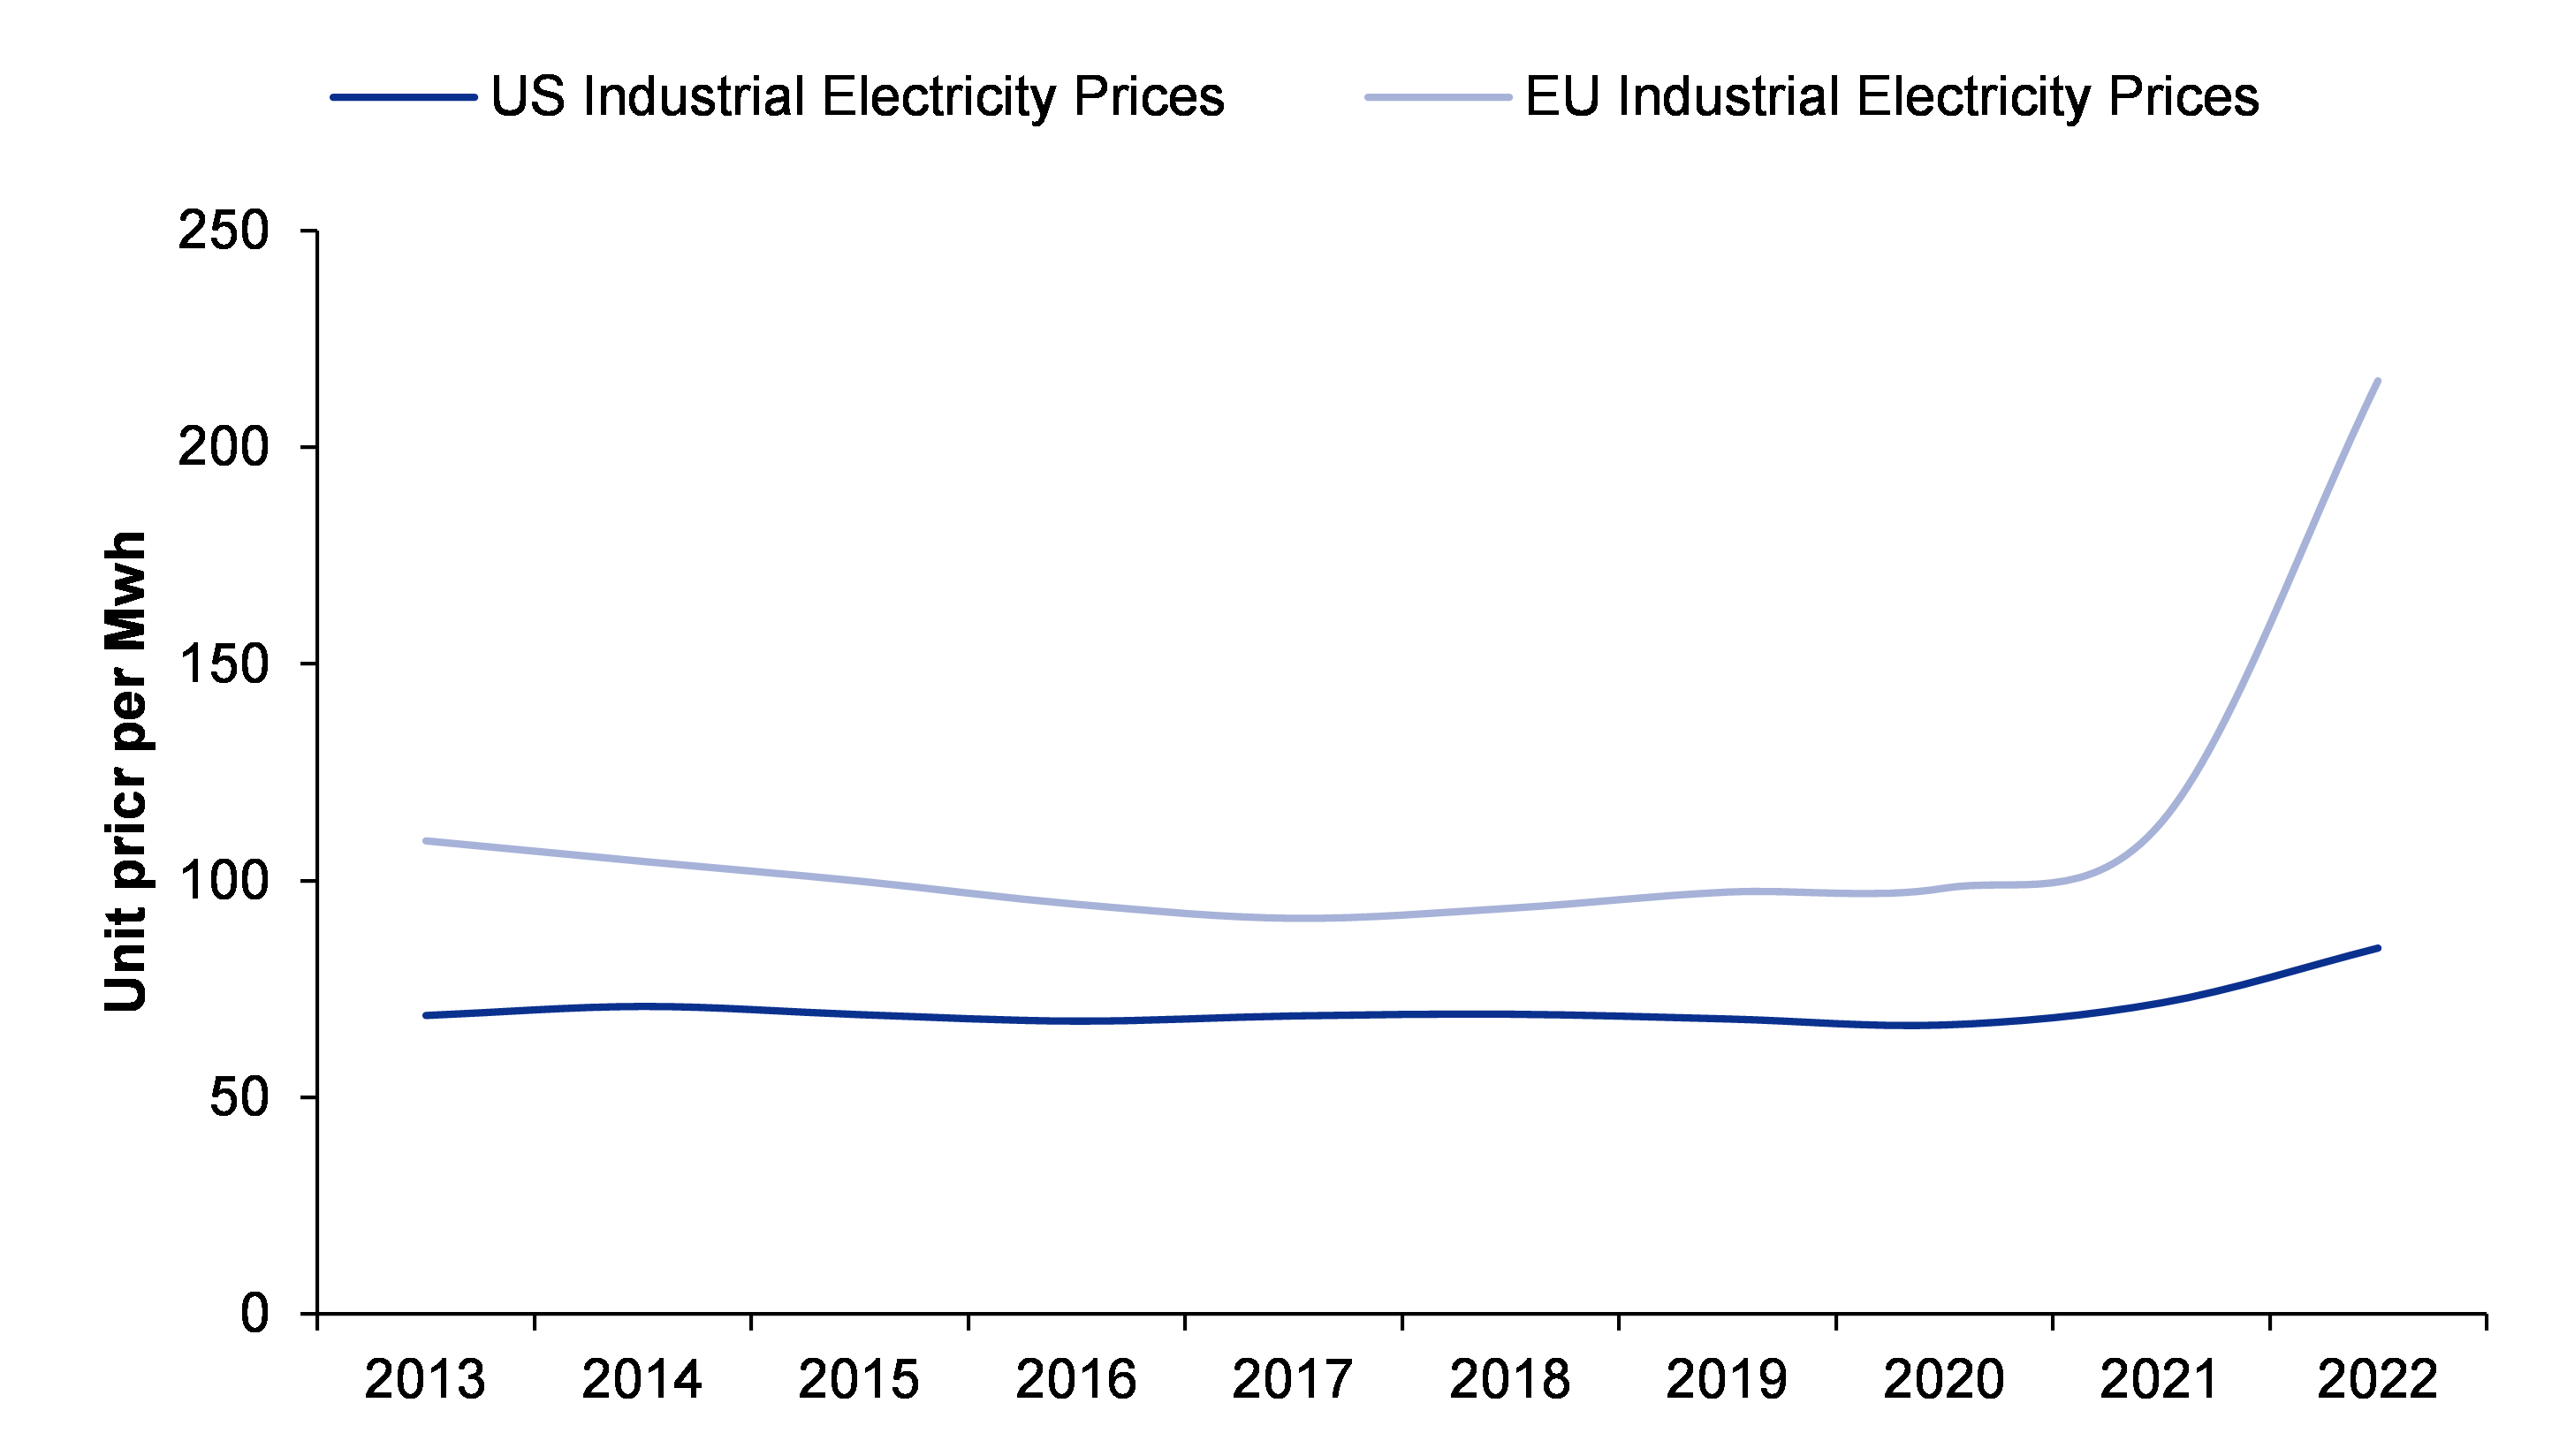
Out of all global steel markets, the US market presents the most opportunities for HEG. Almost 70% of the steel produced in the US is manufactured via the EAF route, and this number is bound to increase with rising carbon credit cost and new EAF capacity addition by major steel companies. Moreover, electricity prices in the US have always lagged the EU due to the EU’s import dependence, further incentivizing the use of EAFs for steel production. In fact, in the ongoing Russia-Ukraine war, where electricity prices have touched an all-time high in the EU, there is only a relatively minor increase in electricity prices in the US.

Figure 27: Industrial electricity price comparison between the US and the EU

SOURCE: INCRED RESEARCH, COMPANY REPORTS  


Figure 28: Steel manufactured via the EAF route in the US – the country currently manufactures 70% of its steel via the EAF route

SOURCE: INCRED RESEARCH, COMPANY REPORTS  


Figure 29: Upcoming EAF-based steel projects in the US

SOURCE: INCRED RESEARCH, COMPANY REPORTS  

US steel companies are incurring significant capex in EAF-based steel production. Cumulatively, when all the plants go online (max. by 2025F), they will add approx. 15mt of annual EAF steel production, which will increase EAF-based steel output, as a percentage of total steel produced, by three percentage points in the US. This could increase incremental demand for graphite electrodes by 27,000t (assuming it requires 1.8kg of electrodes to manufacture 1t of steel).

Inventory destocking by American steel mills

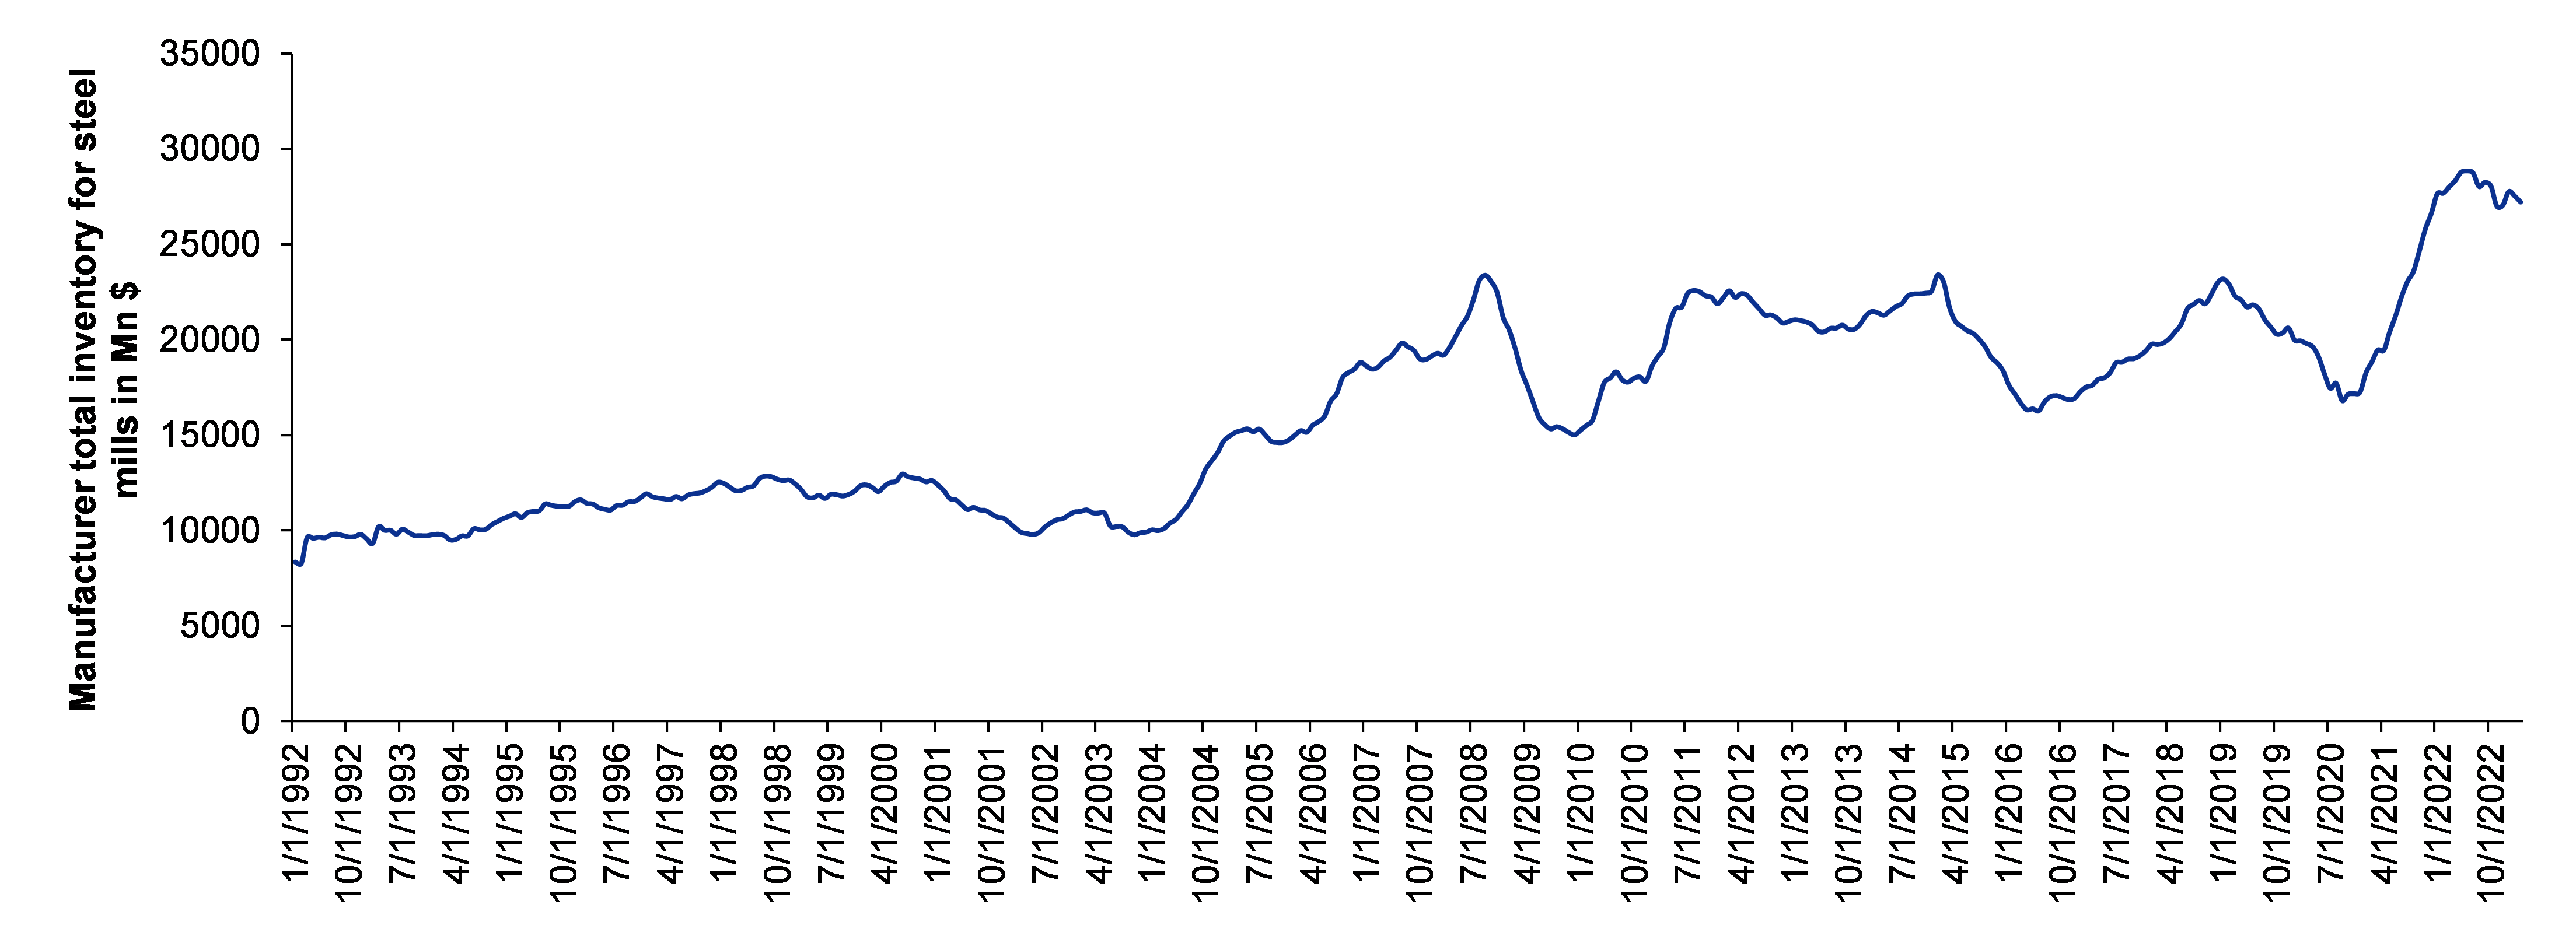
As far as the US steel markets are concerned, currently graphite companies are slightly conservative about FY24F because of huge inventory build-up at steel companies. In fact, the current inventory build-up at US steel mills is the highest- ever in history (from the time that data is available). Such a high inventory build-up will impact the top line of HEG in FY24F. However, there are signs of the inventory declining in Mar and Apr CY23 data, as the US steel market stays resilient in this challenging environment. However, in 2HFY23F, we expect consumer spending to ultimately subside because we expect the savings accumulated during the Covid-19 pandemic by American consumers to ultimately run out.

Figure 30: Manufacturers’ total inventory for steel mills in the US - as we can see, they are at an all-time high and hence, impacting the top line of graphite companies; we expect the inventory level to revert to the mean by the end of FY24F, which then will act as a growth trigger for HEG in FY25F

SOURCE: INCRED RESEARCH, COMPANY REPORTS  


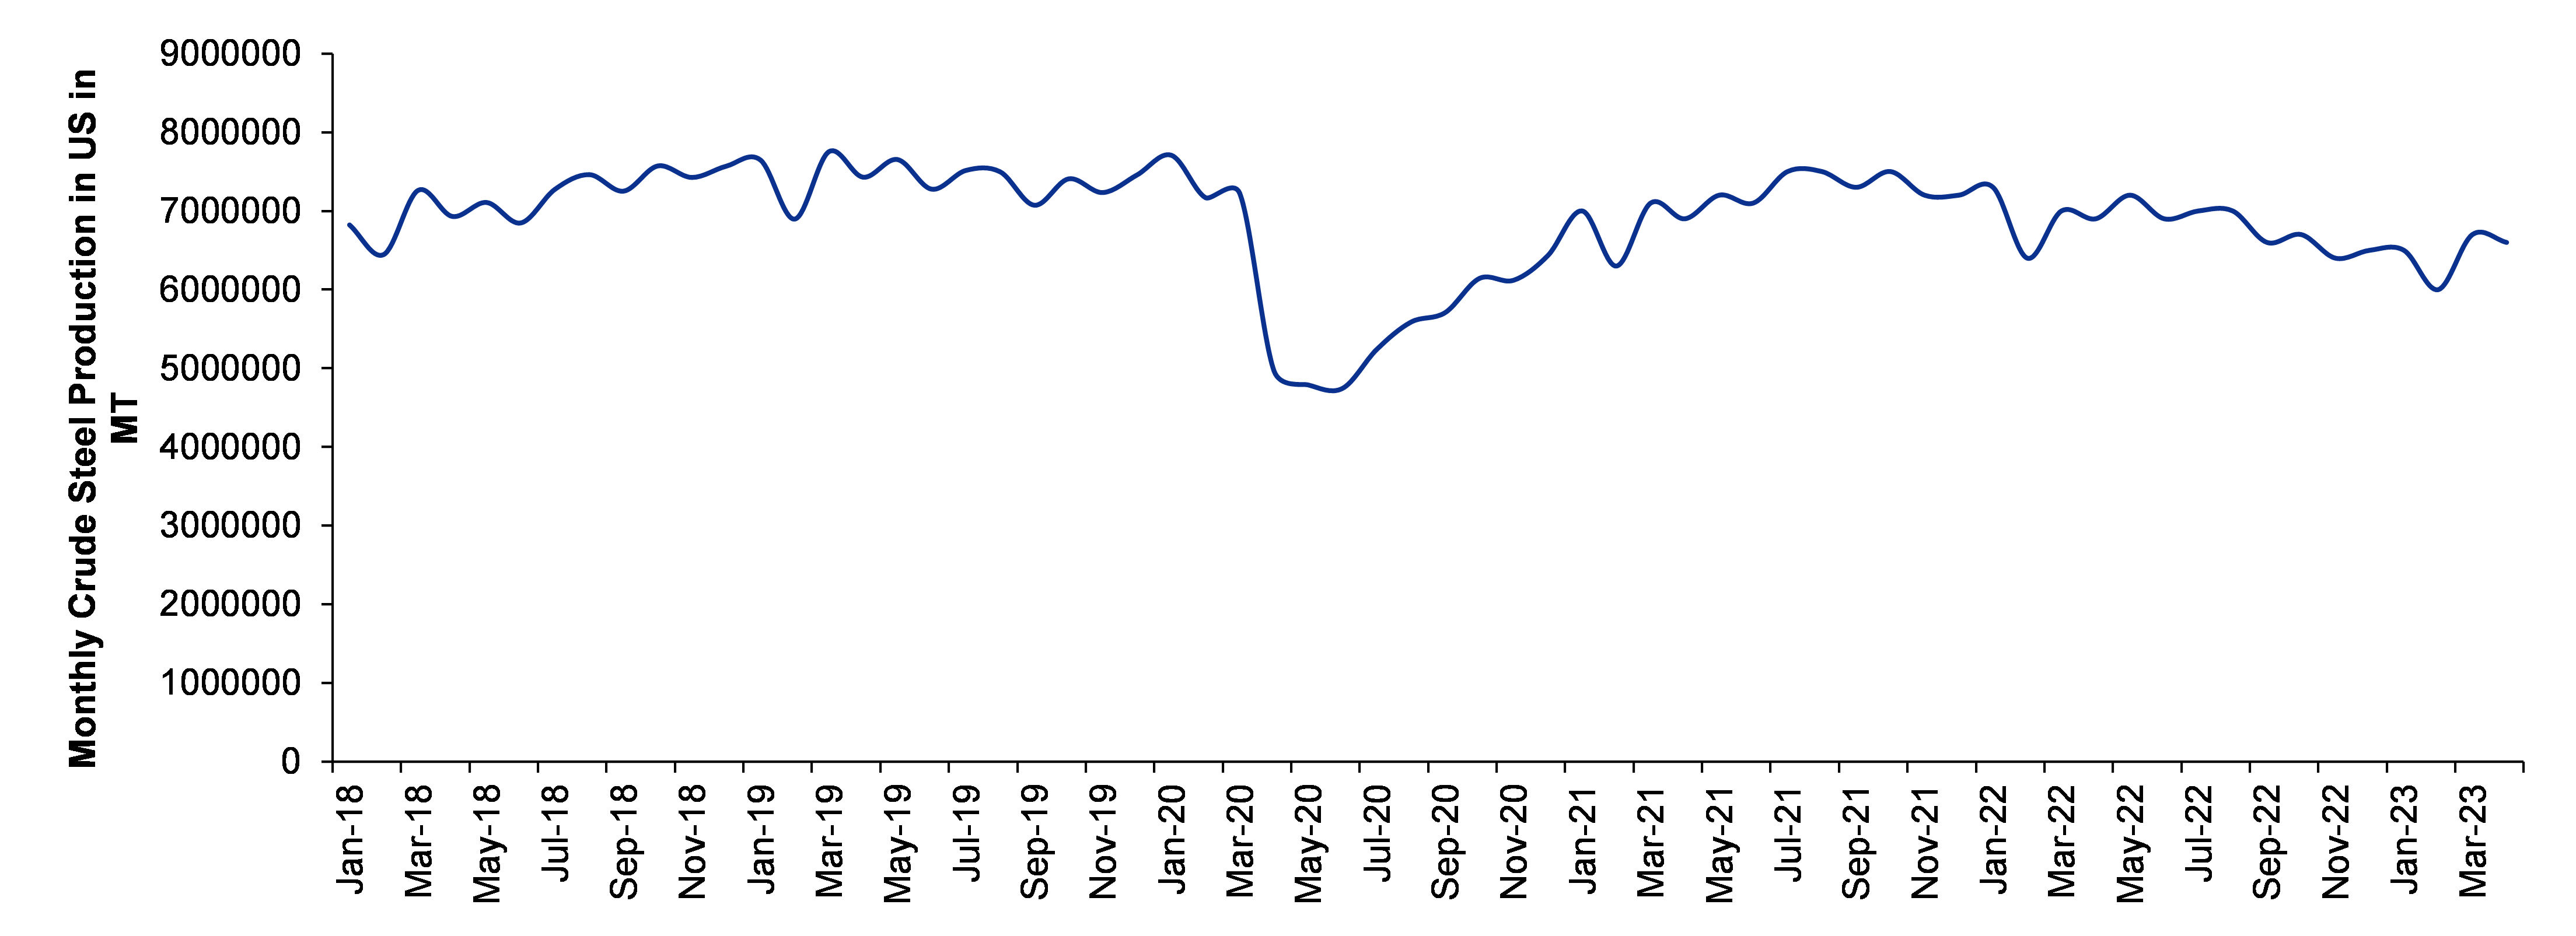
Figure 31: Monthly crude steel production in the US (in mt)

SOURCE: INCRED RESEARCH, STEELMINT  


Figure 32: Manufacturers’ new orders for steel mills in the US

SOURCE: INCRED RESEARCH, COMPANY REPORTS  

Combining all the three graphs, what we can see is that new orders and inventory are at an all-time high. However, monthly crude steel production has gone even below the pre-pandemic levels. Hence, all these three signal a drawdown in inventory level. As inventories revert to the historical mean (we expect this to happen by the end of FY24F), it will lead to improvement in the top line of HEG, indicating its bright future. However, in the medium term, the company faces headwinds.

The Federal Reserve’s rate hike cycle is not impacting US demand

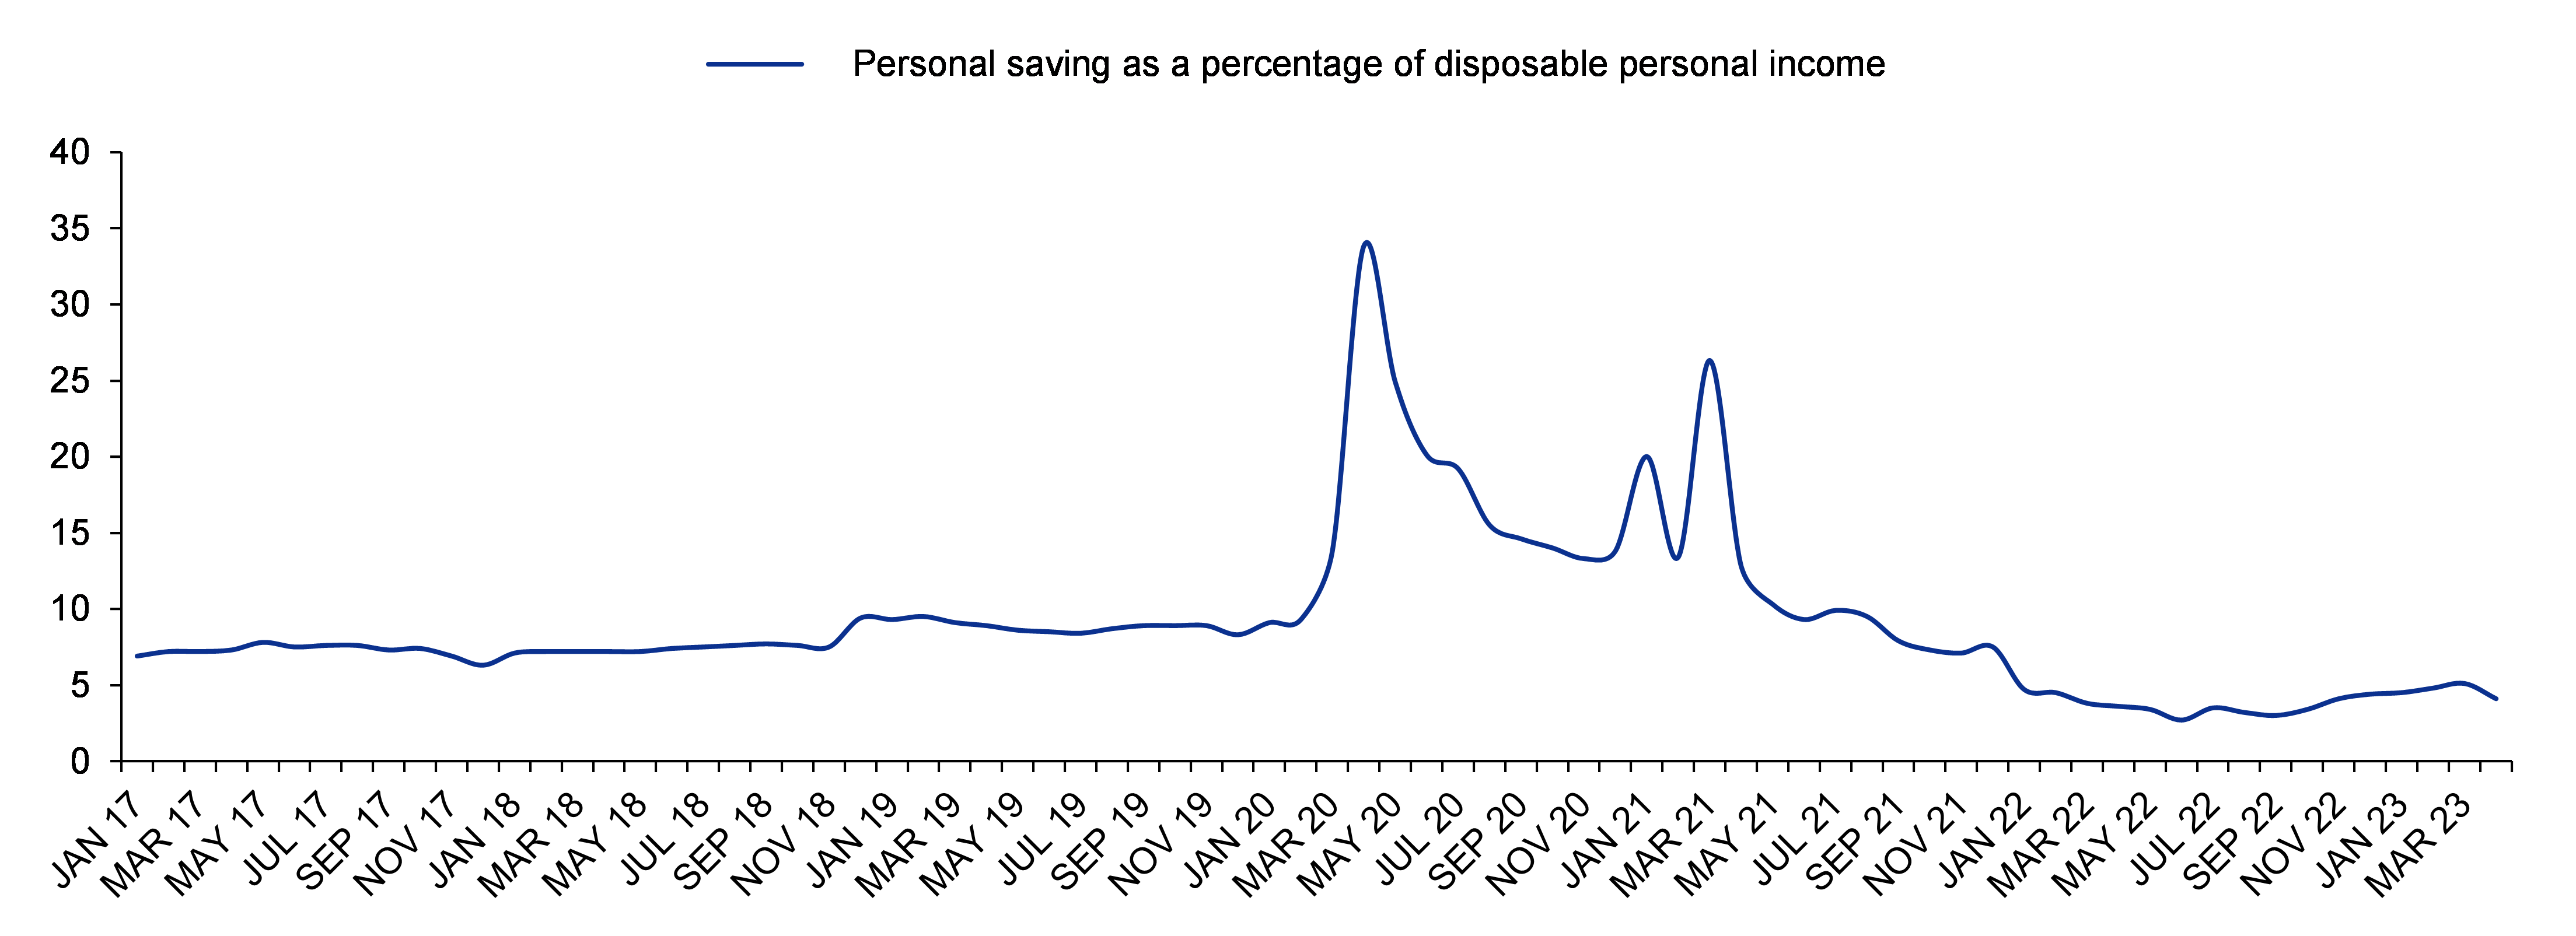
If we look at the data on new orders for steel mills in the US, they are at an all-time high. So, the logical question is: what’s driving them? In one word, the answer is ‘consumers. The excess money that Americans saved during the Covid-19 pandemic resulted in this consumption-led growth. During the pandemic, Americans saved close to 33% of their domestic income, which historically was close to 9%. Until and unless these excess savings are exhausted, the consumption-led growth will continue. But when will these excess savings be entirely consumed? We have tried to do an analysis to predict the same.


Figure 33: Personal savings, as a percentage of total disposable income, spiked during the Covid-19 pandemic but currently it’s at a record low level, which means US consumers are spending the funds accumulated during the pandemic

SOURCE: INCRED RESEARCH, COMPANY REPORTS  


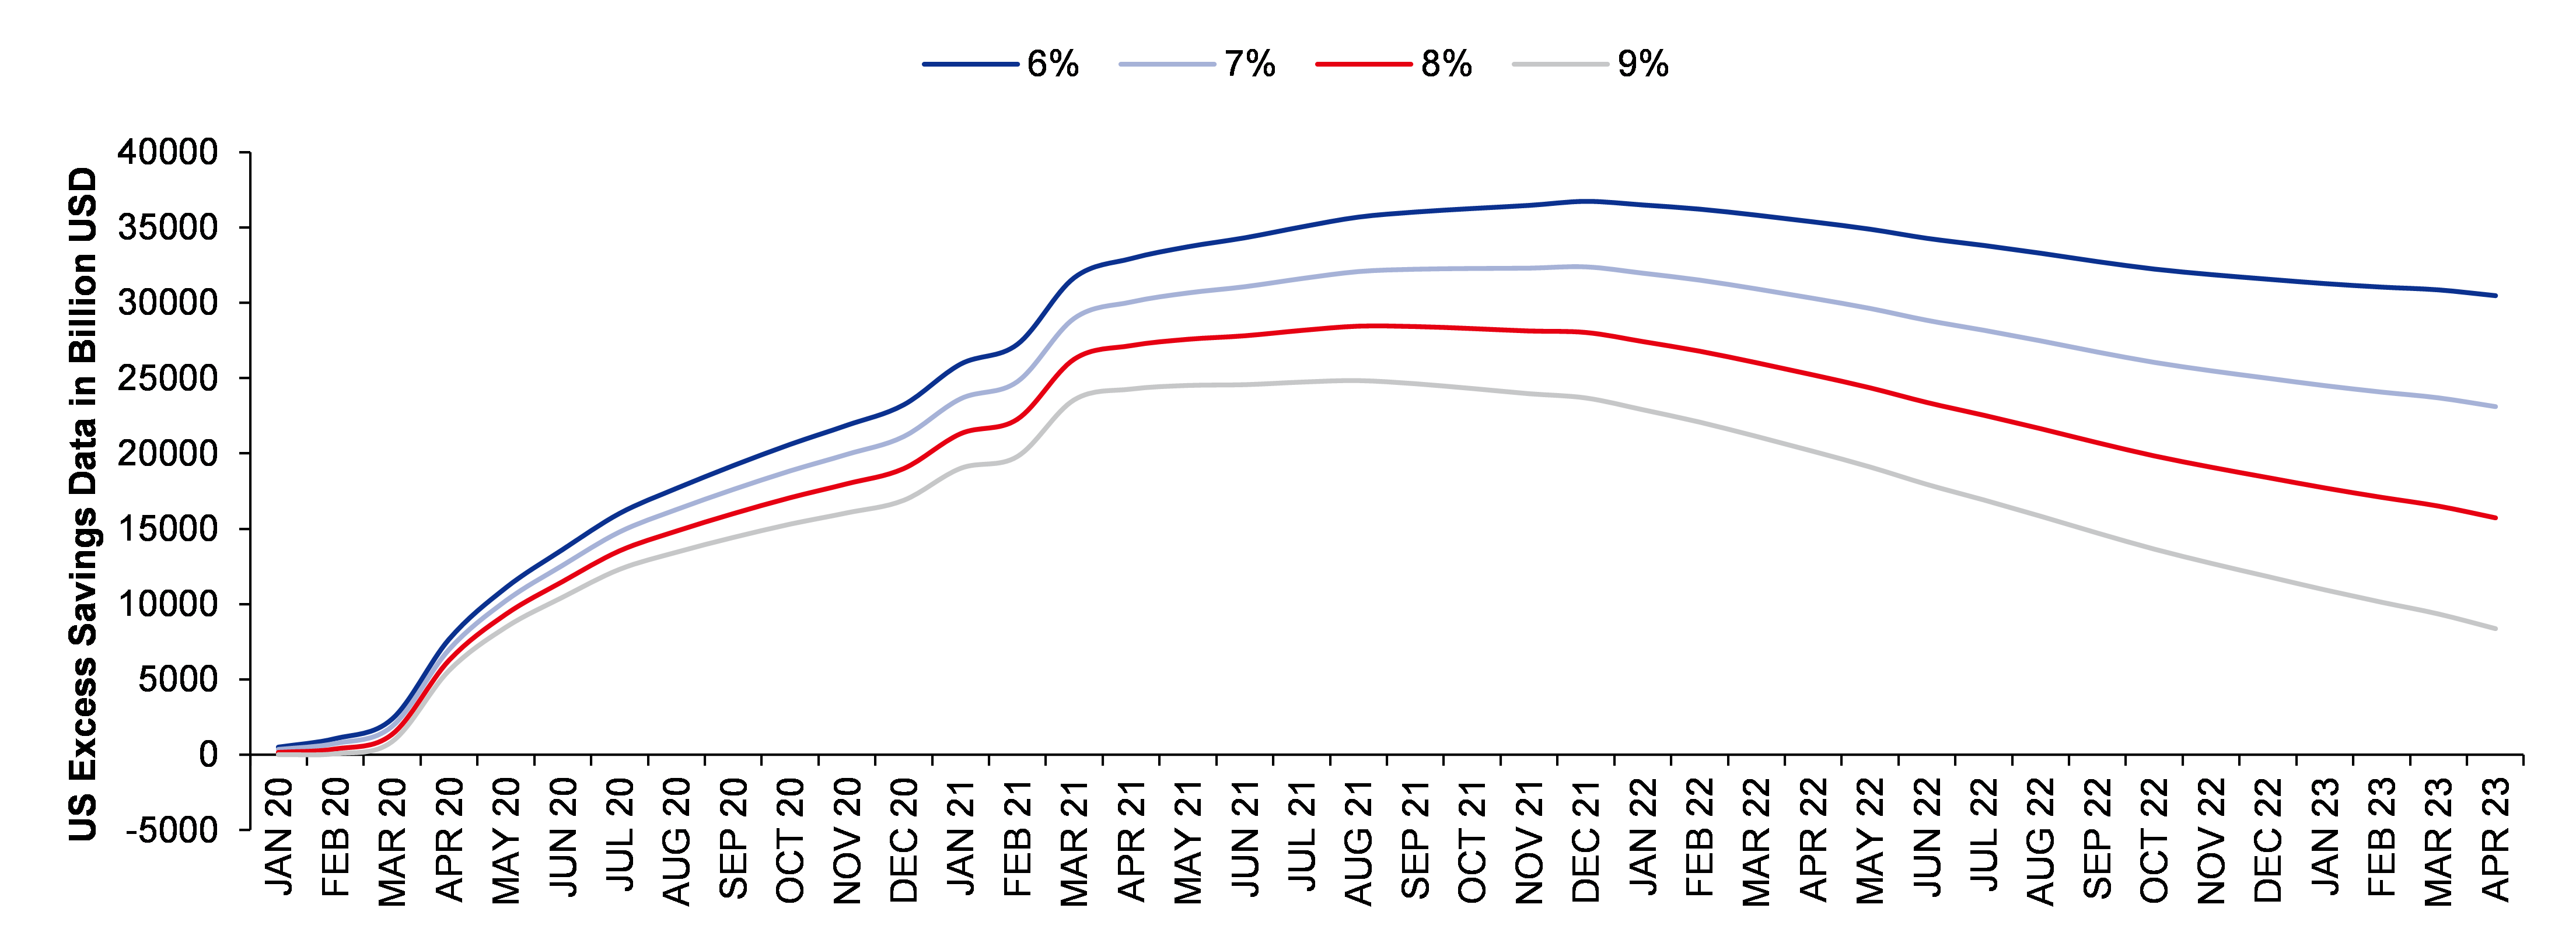
Figure 34: US excess savings data

SOURCE: INCRED RESEARCH, COMPANY REPORTS  

In this analysis, we have assumed four different scenarios. For instance, let’s assume the normal savings rate is 6%, and any savings above 6% of disposable income is termed as excess savings. Now, 9% is most likely to be the scenario which plays out in realty, as the historical savings rate for American consumers has been close to 9%. And if that’s the case, the excess savings of US consumers will be completely exhausted in eight to nine months, and that is the time we expect consumer spending to start declining, thereby affecting industries like steel. To further understand, let’s look at the industries powering this steel consumption. There are mainly two industries responsible for this – non-residential construction and automobile sales.

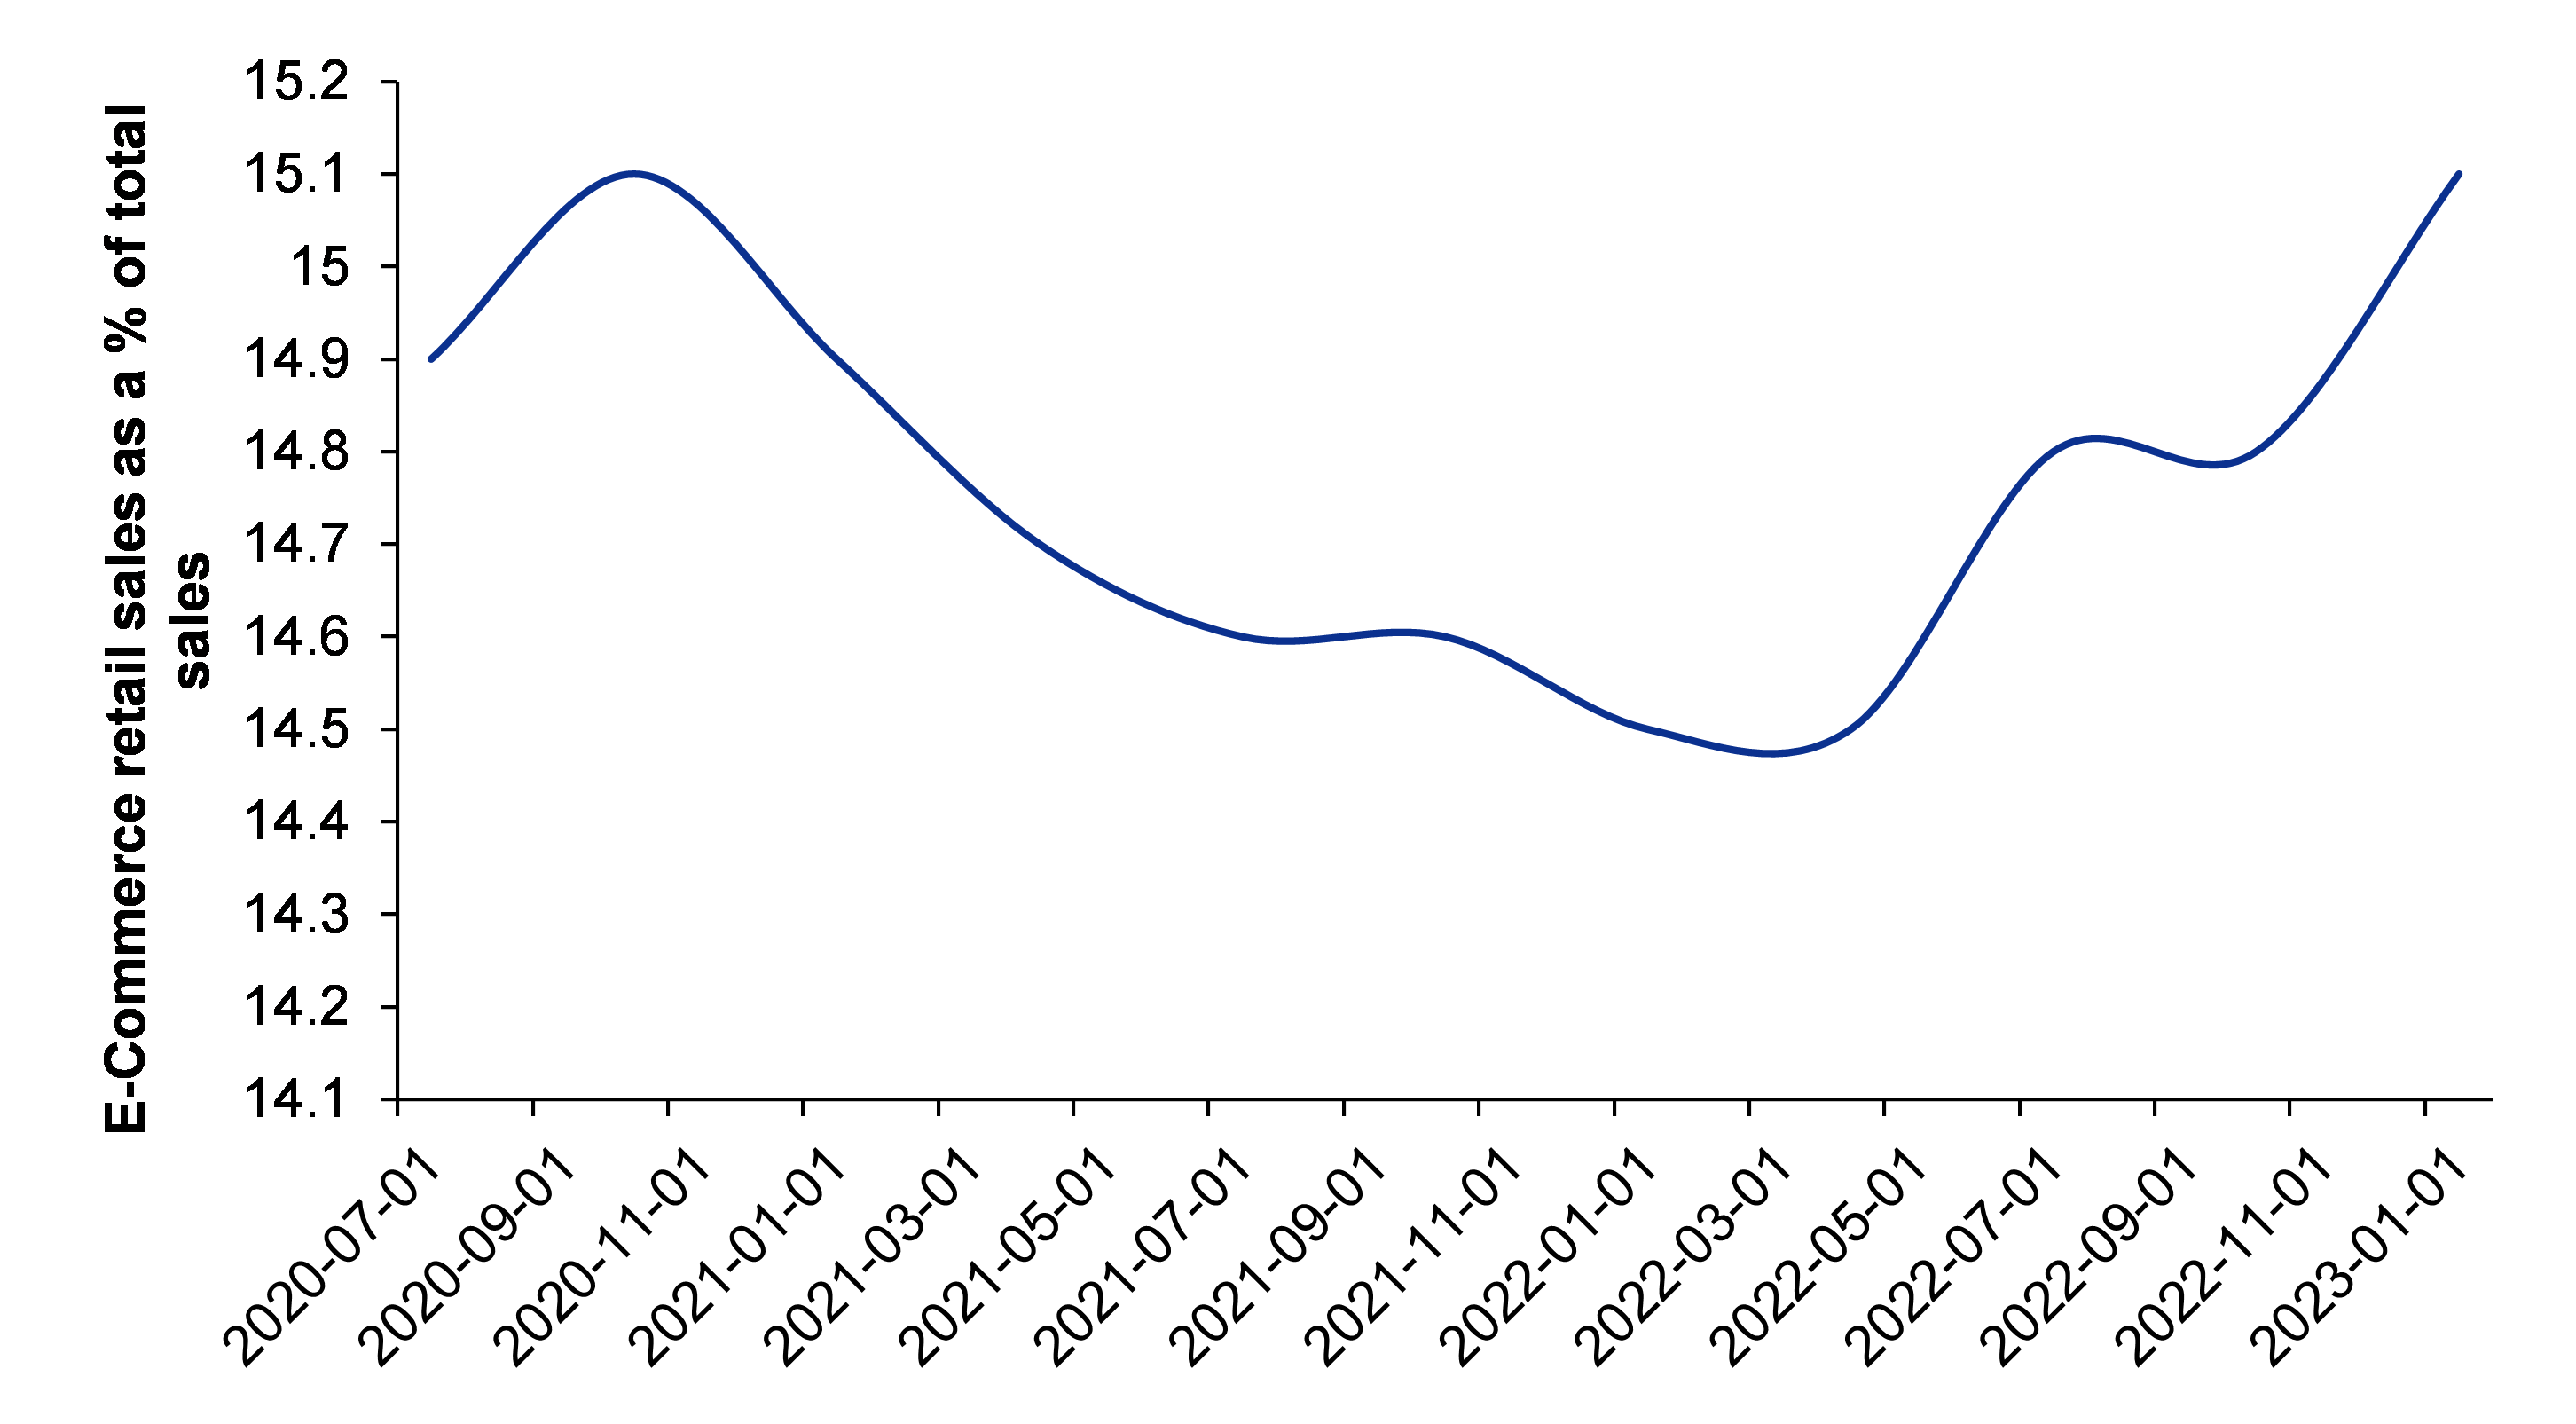
E-commerce is spiking the demand for US steel mills

Non-residential construction in the US is rising. But if we break up non-residential construction further, the distribution component of the retail category has witnessed the strongest growth of any major building sector over the past decade. Due to explosive growth in e-commerce, the construction of distribution facilities has increased by nine-fold over this period, compared to just over 50% in overall gains in spending on buildings. The other two major non-residential building categories – offices and lodging – essentially witnessed no gains last year as both these categories are still adjusting to the reduction in demand during the pandemic. The institutional categories saw only modest spending growth last year, with healthcare and amusement/recreation being the only major sectors with a growth of 5% or more.

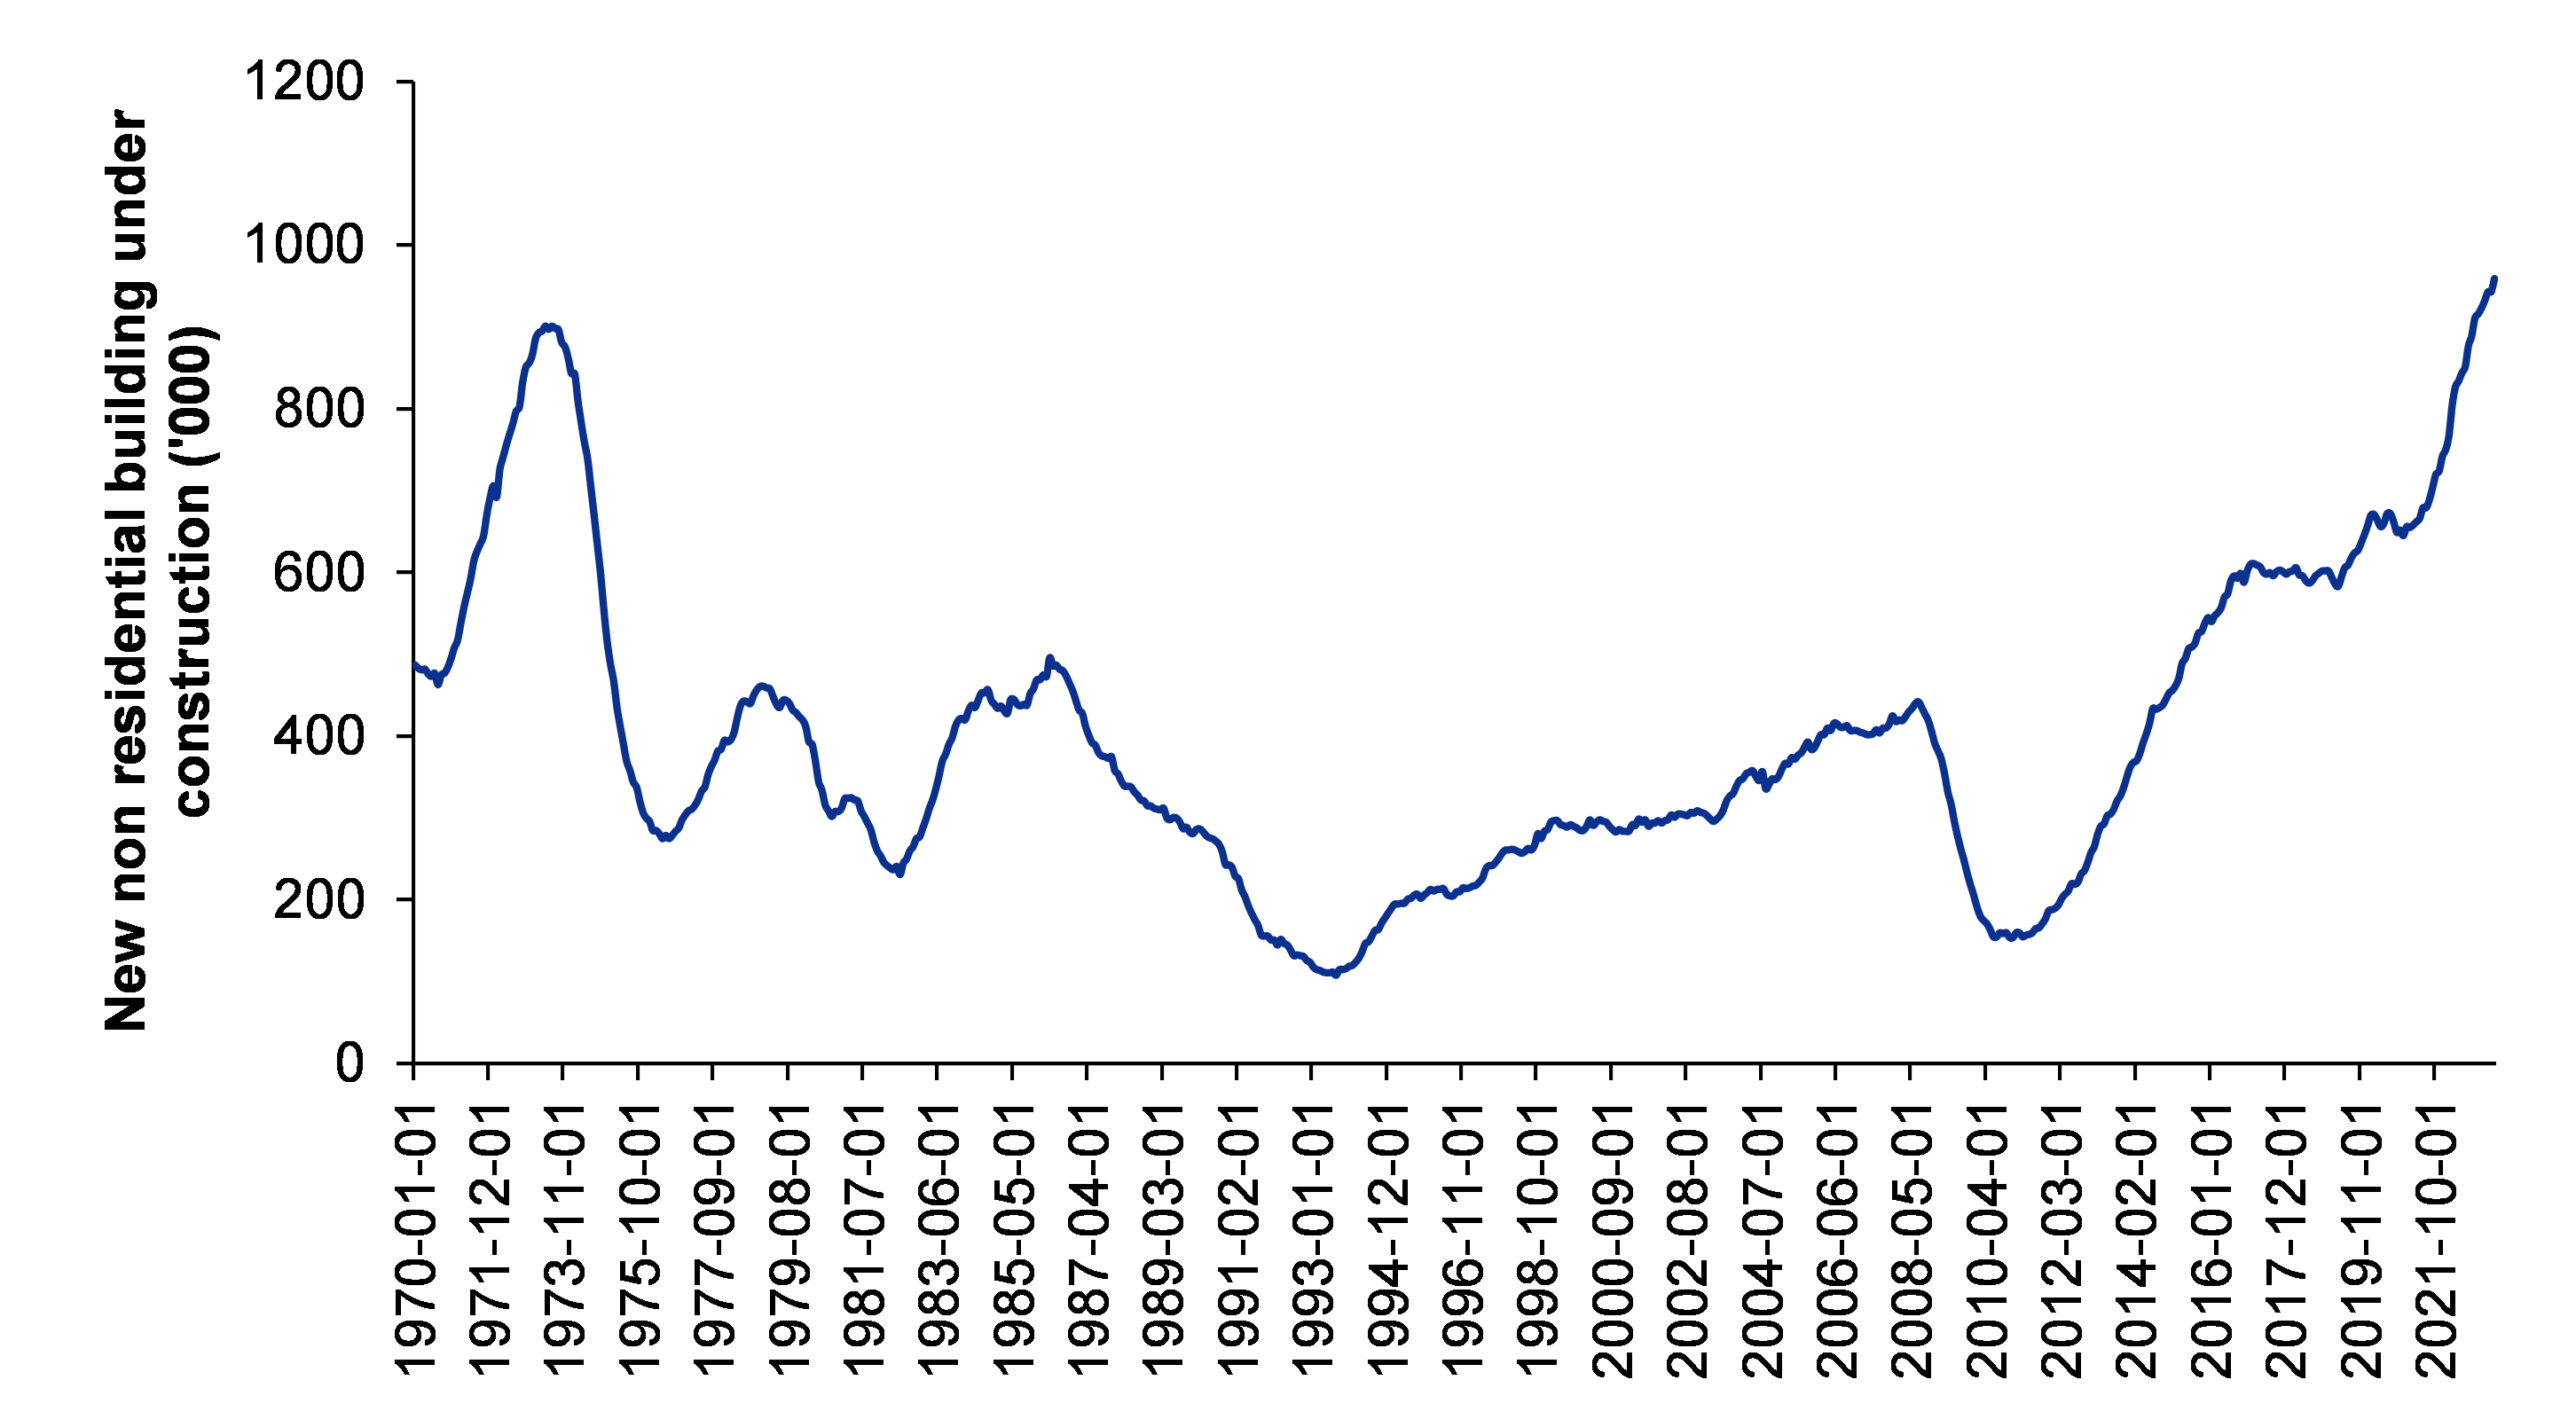
Figure 35: Non-residential buildings currently under construction

SOURCE: INCRED RESEARCH, COMPANY REPORTS  


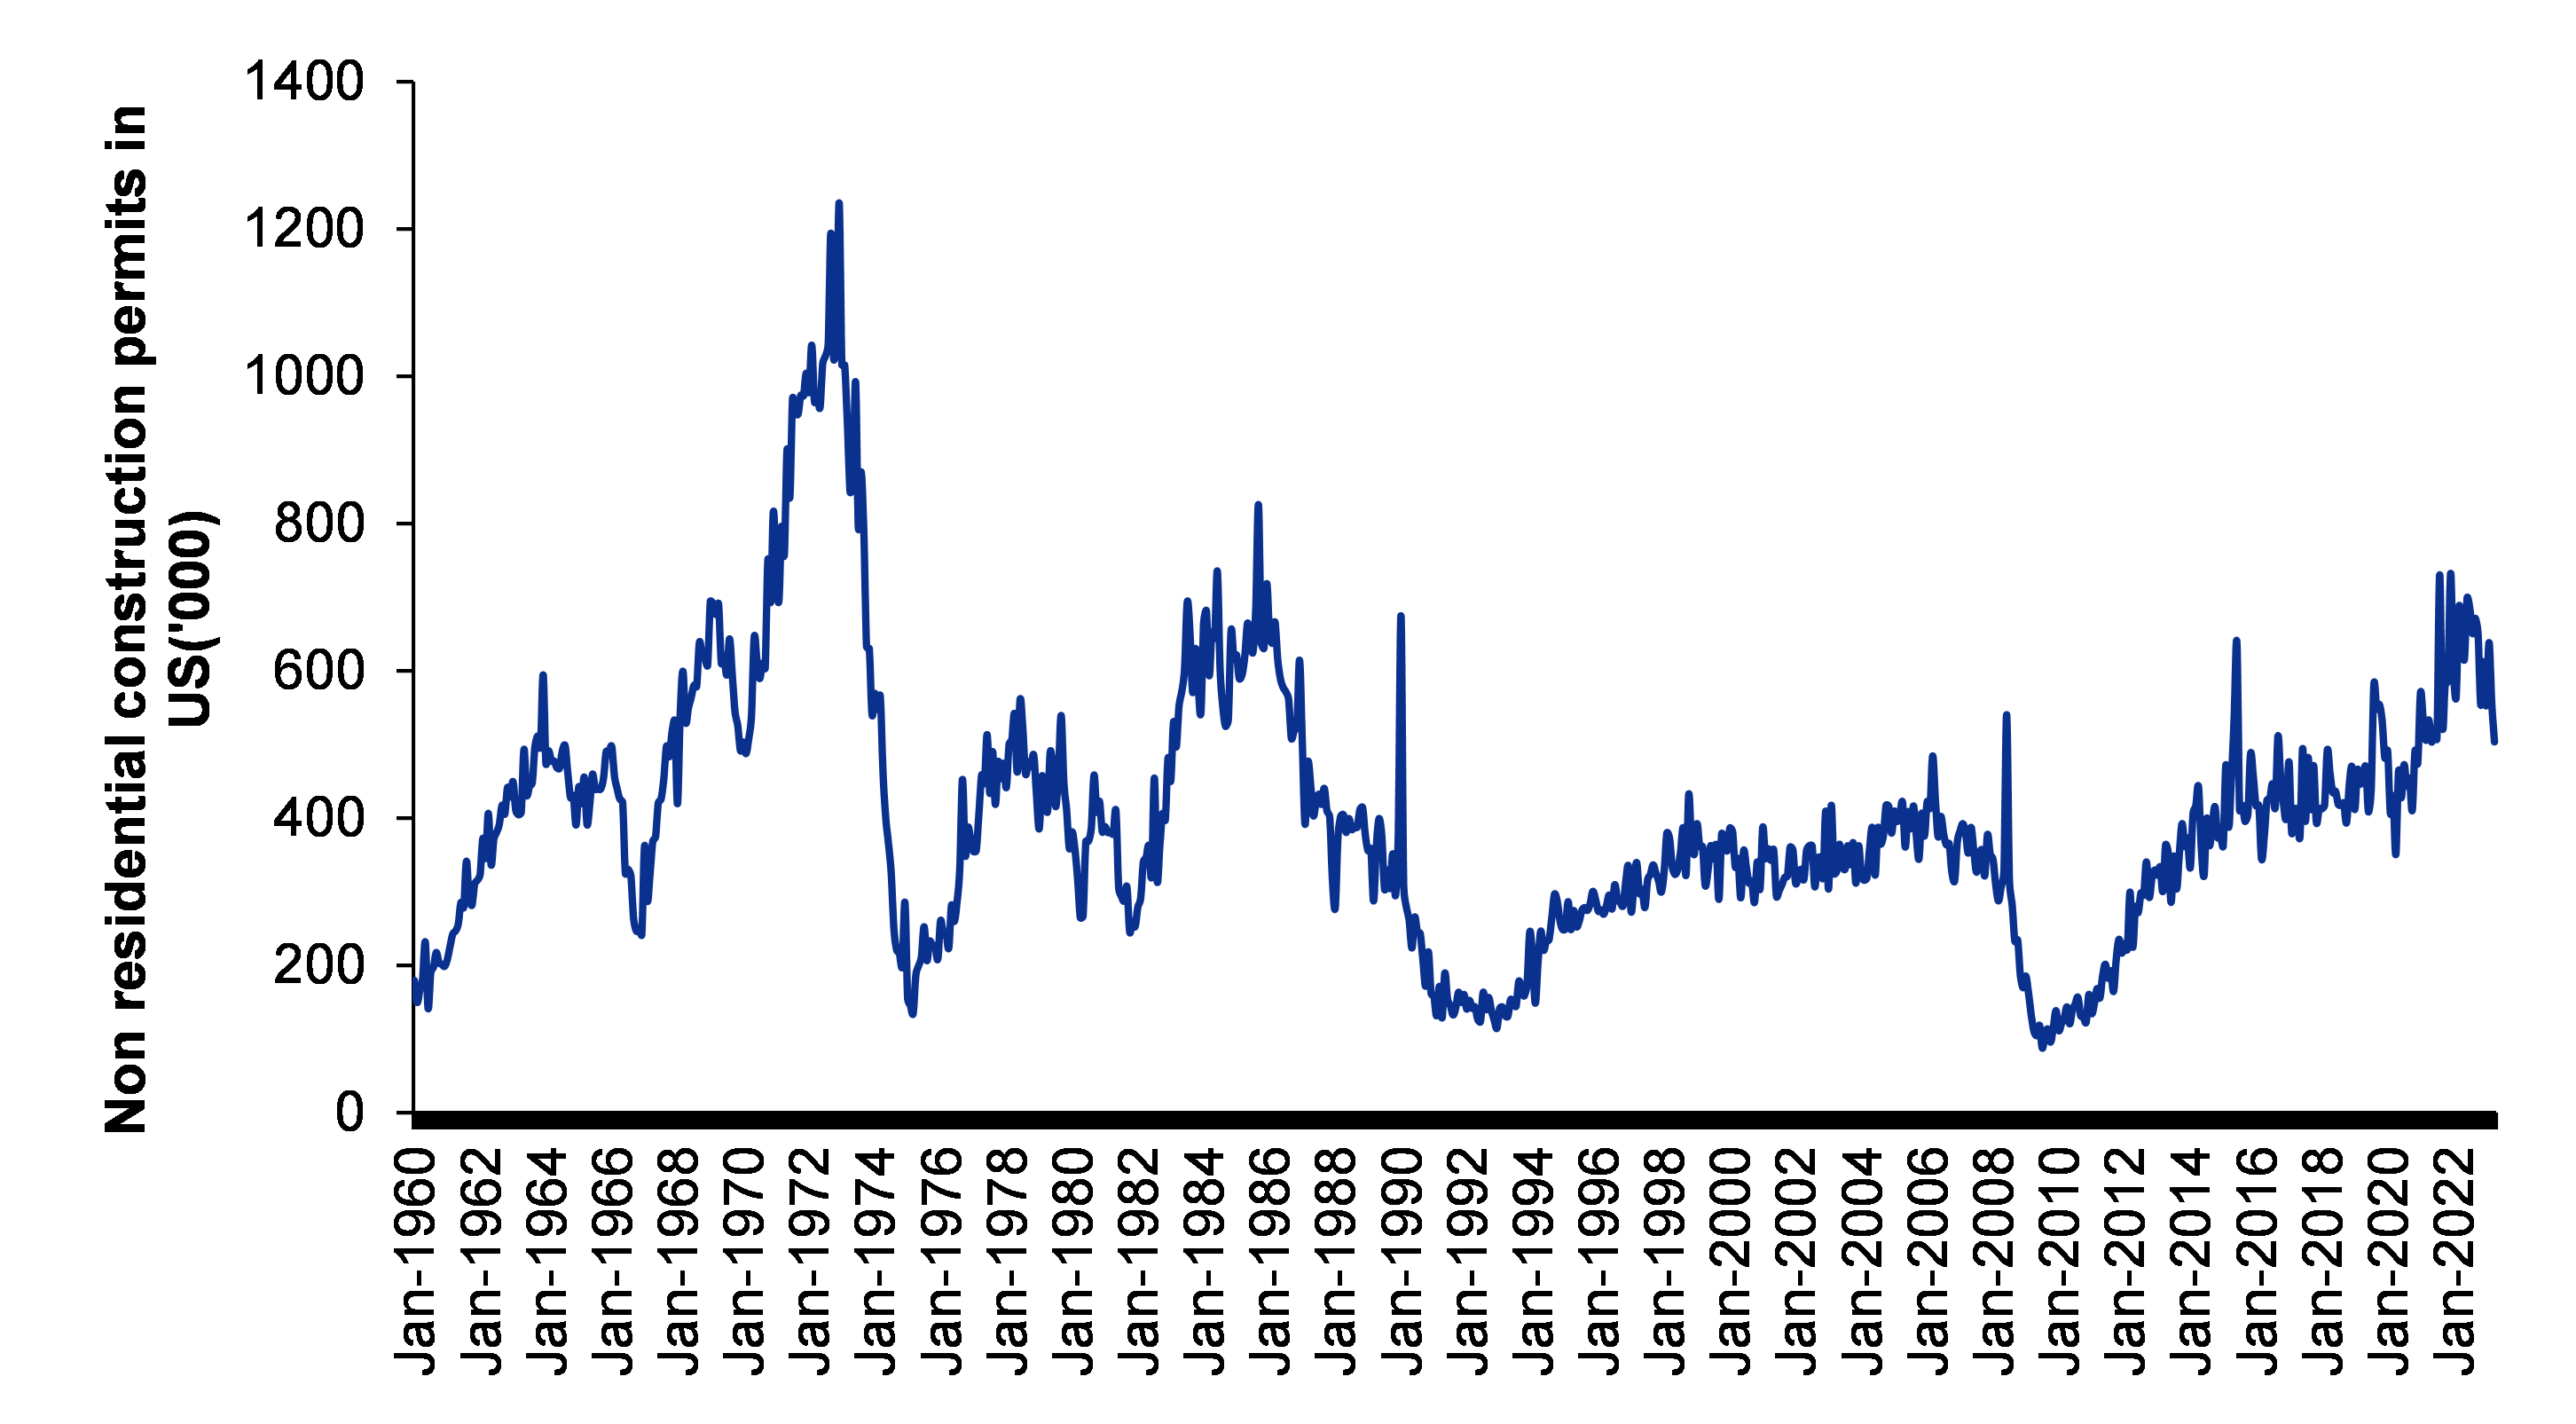
Figure 36: Non-residential construction permits in the US

SOURCE: INCRED RESEARCH, COMPANY REPORTS  

On looking at these two graphs above, we can see that non-residential buildings under construction in the US are at an all-time high, thus fueling the country’s steel industry. However, non-residential building permits, which often act as a leading indicator of non-residential construction, are showing signs of moderation. Hence, it needs to be observed closely to observe any possible trend.

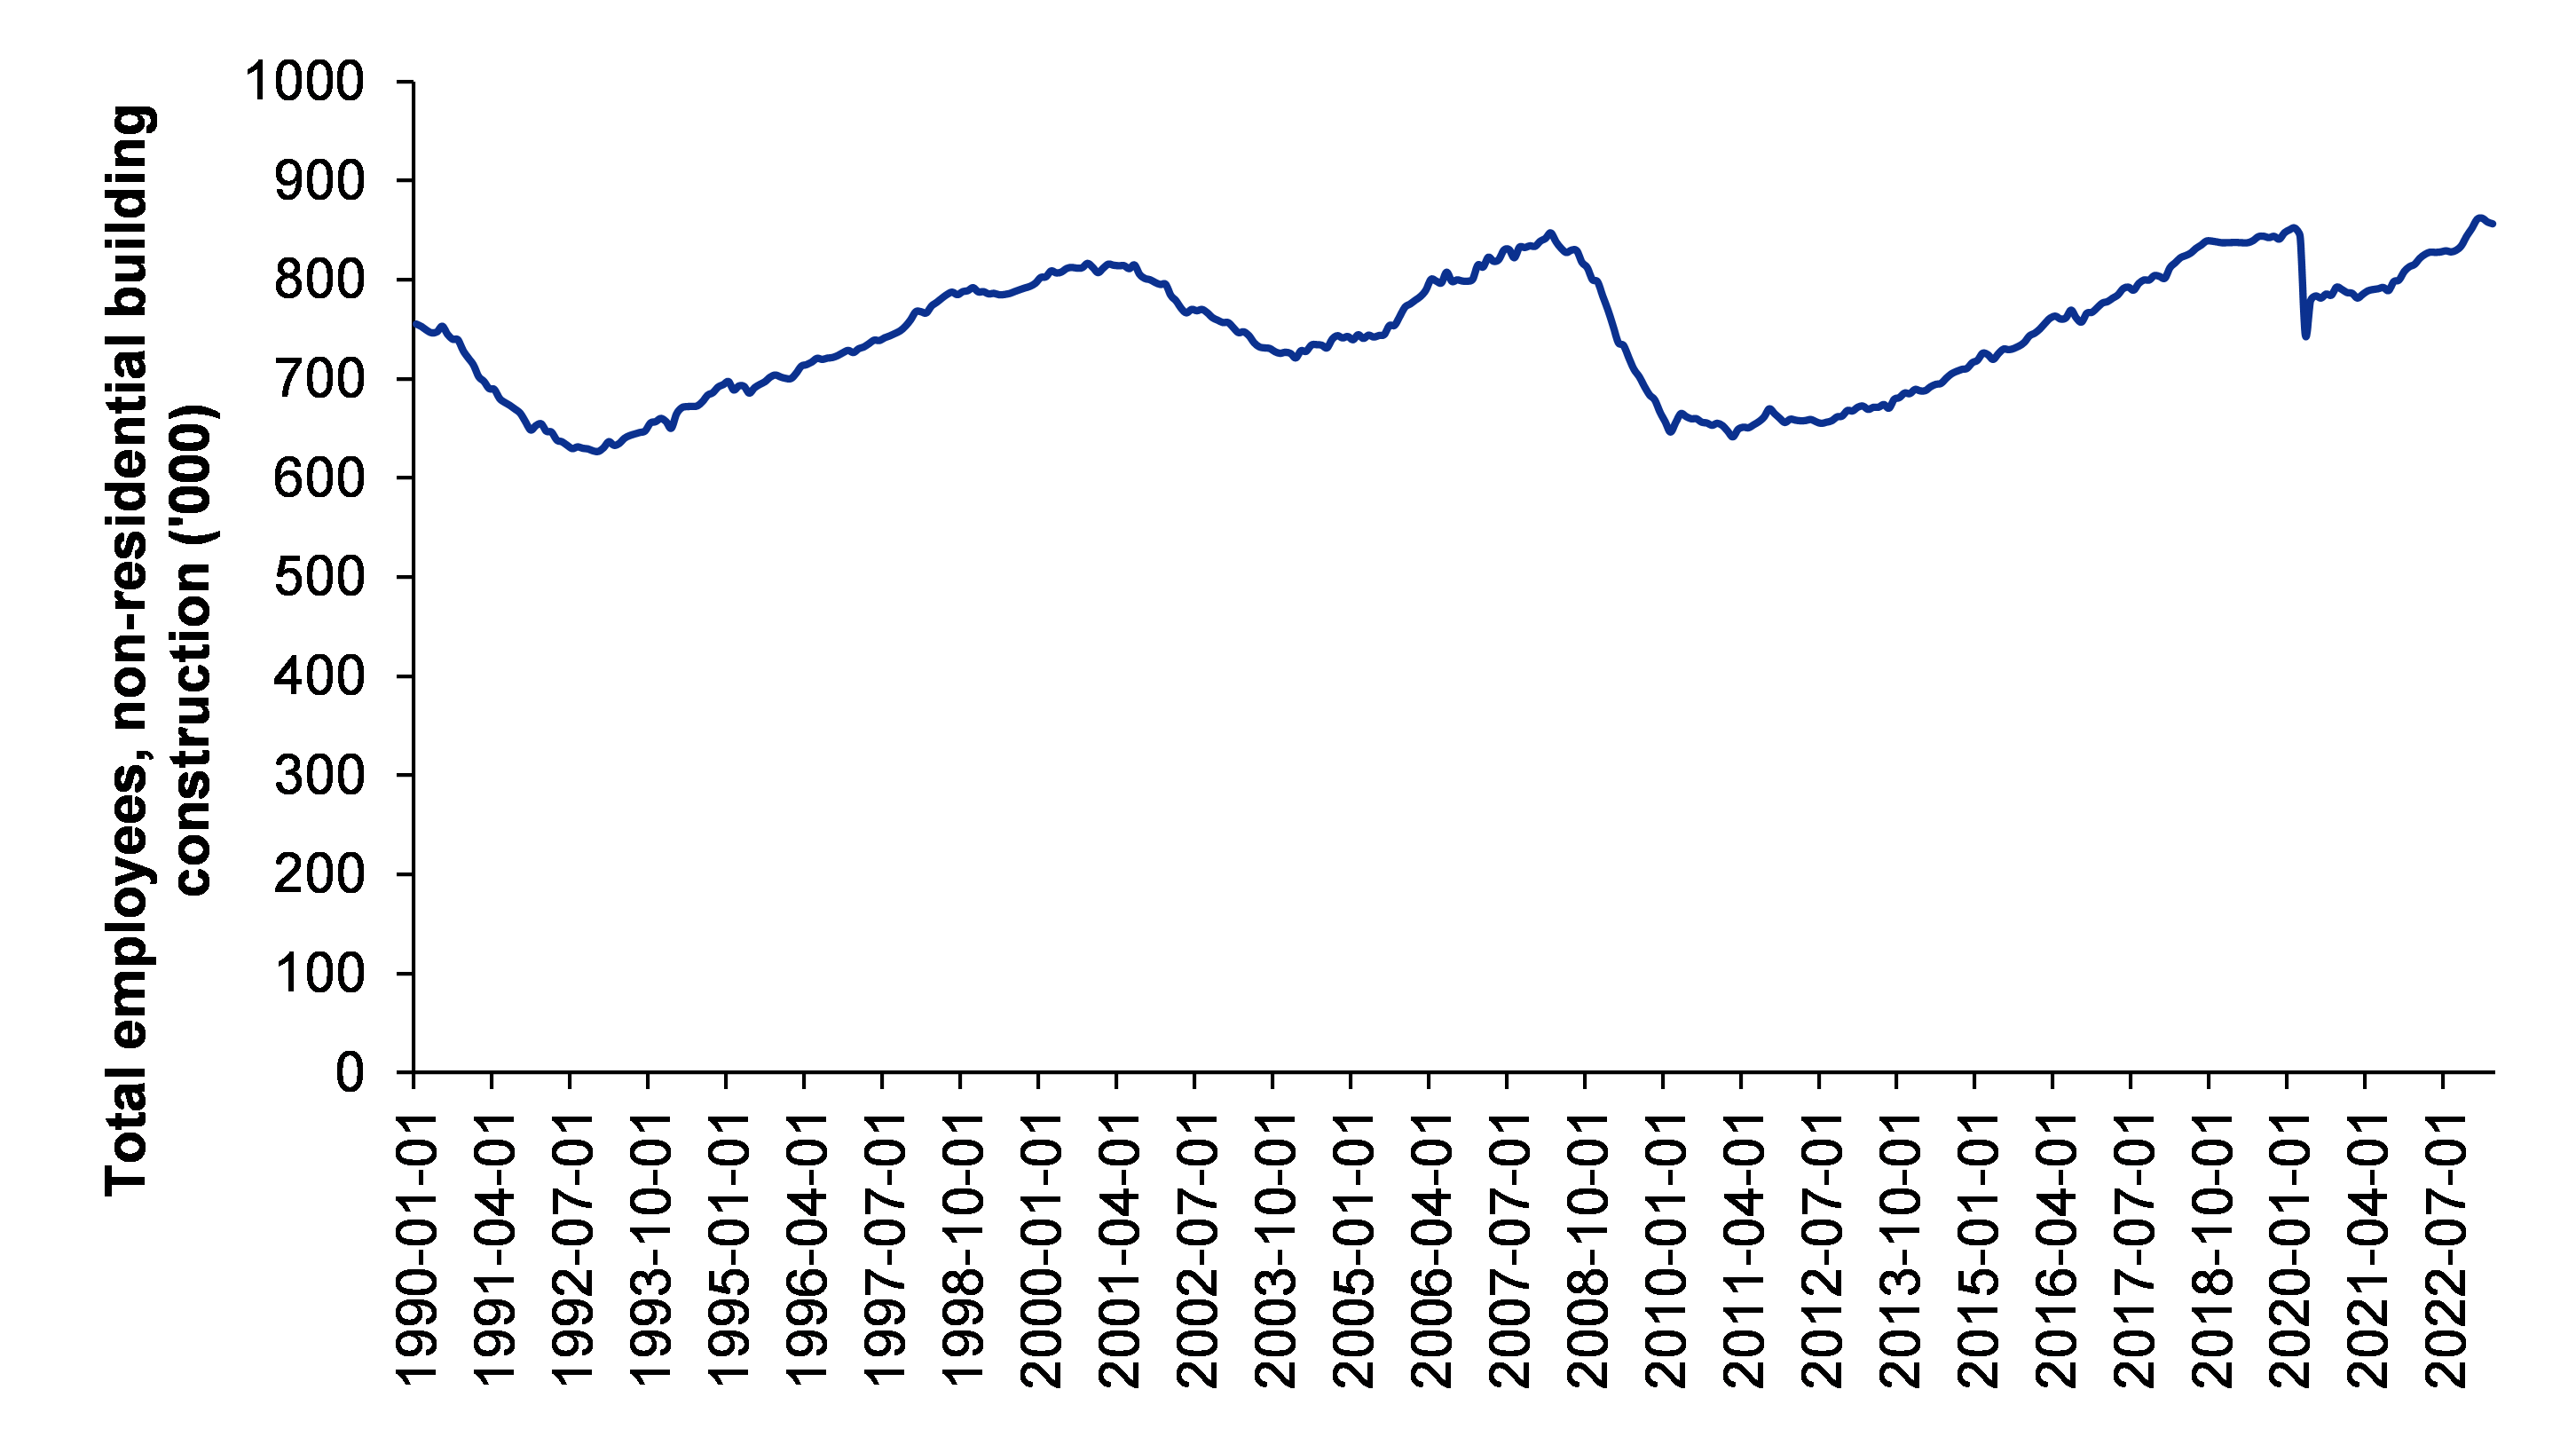
Figure 37: Total employees deployed in non-residential building construction

SOURCE: INCRED RESEARCH, COMPANY REPORTS  


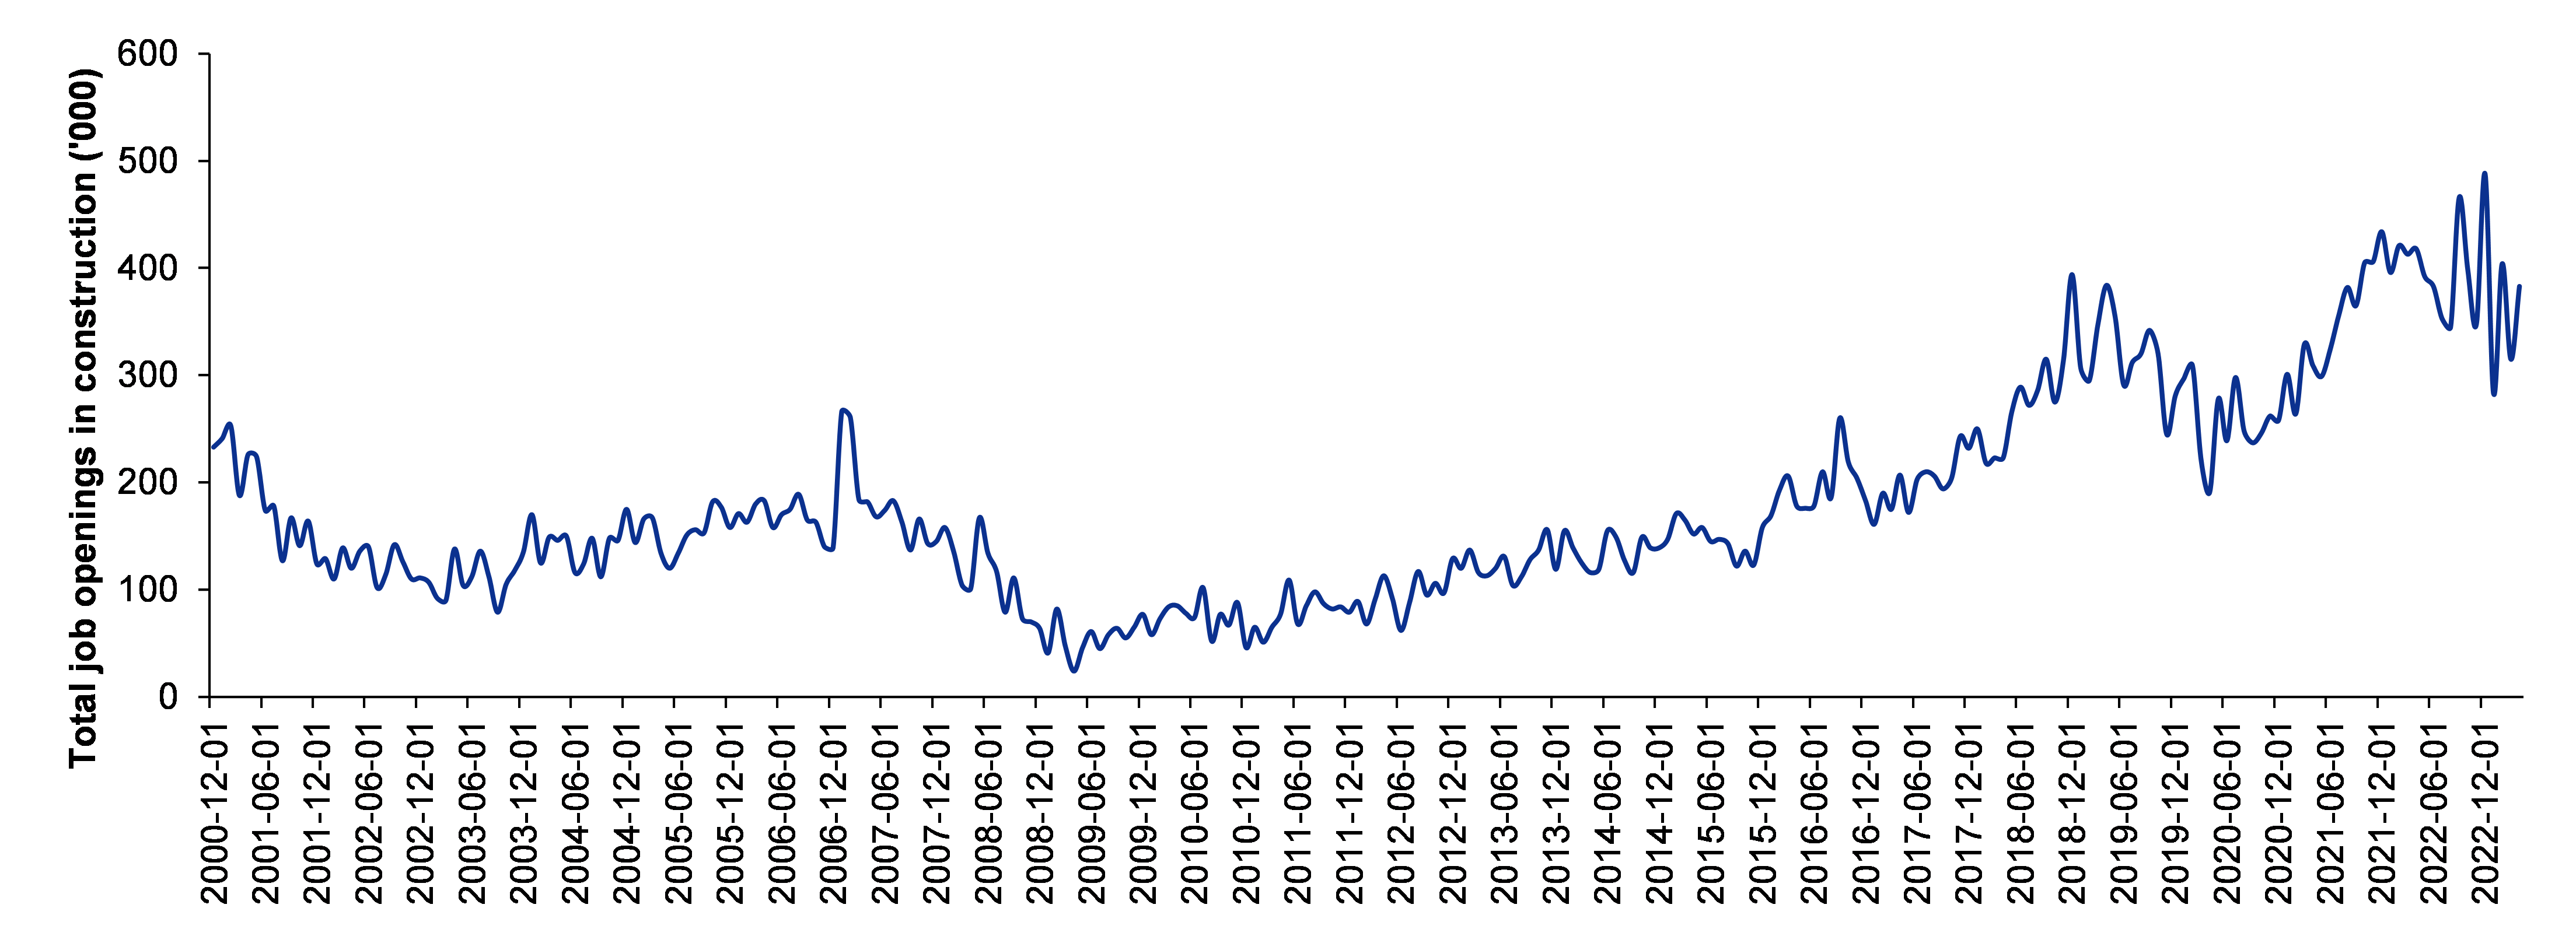
Figure 38: Total job openings in the construction sector

SOURCE: INCRED RESEARCH, COMPANY REPORTS  

Looking at these two graphs above, we can see that the number of people currently employed in the construction sector is at an all-time high. However, new job openings are showing signs of a decline. This suggests a bearish outlook, but more data is required for an elaborate conclusion.

Figure 39: E-commerce retail sales, as a % of total sales, at pandemic highs, driving the increase in warehousing requirement

SOURCE: INCRED RESEARCH, COMPANY REPORTS  

Automobiles sales are also going up due to pent-up demand

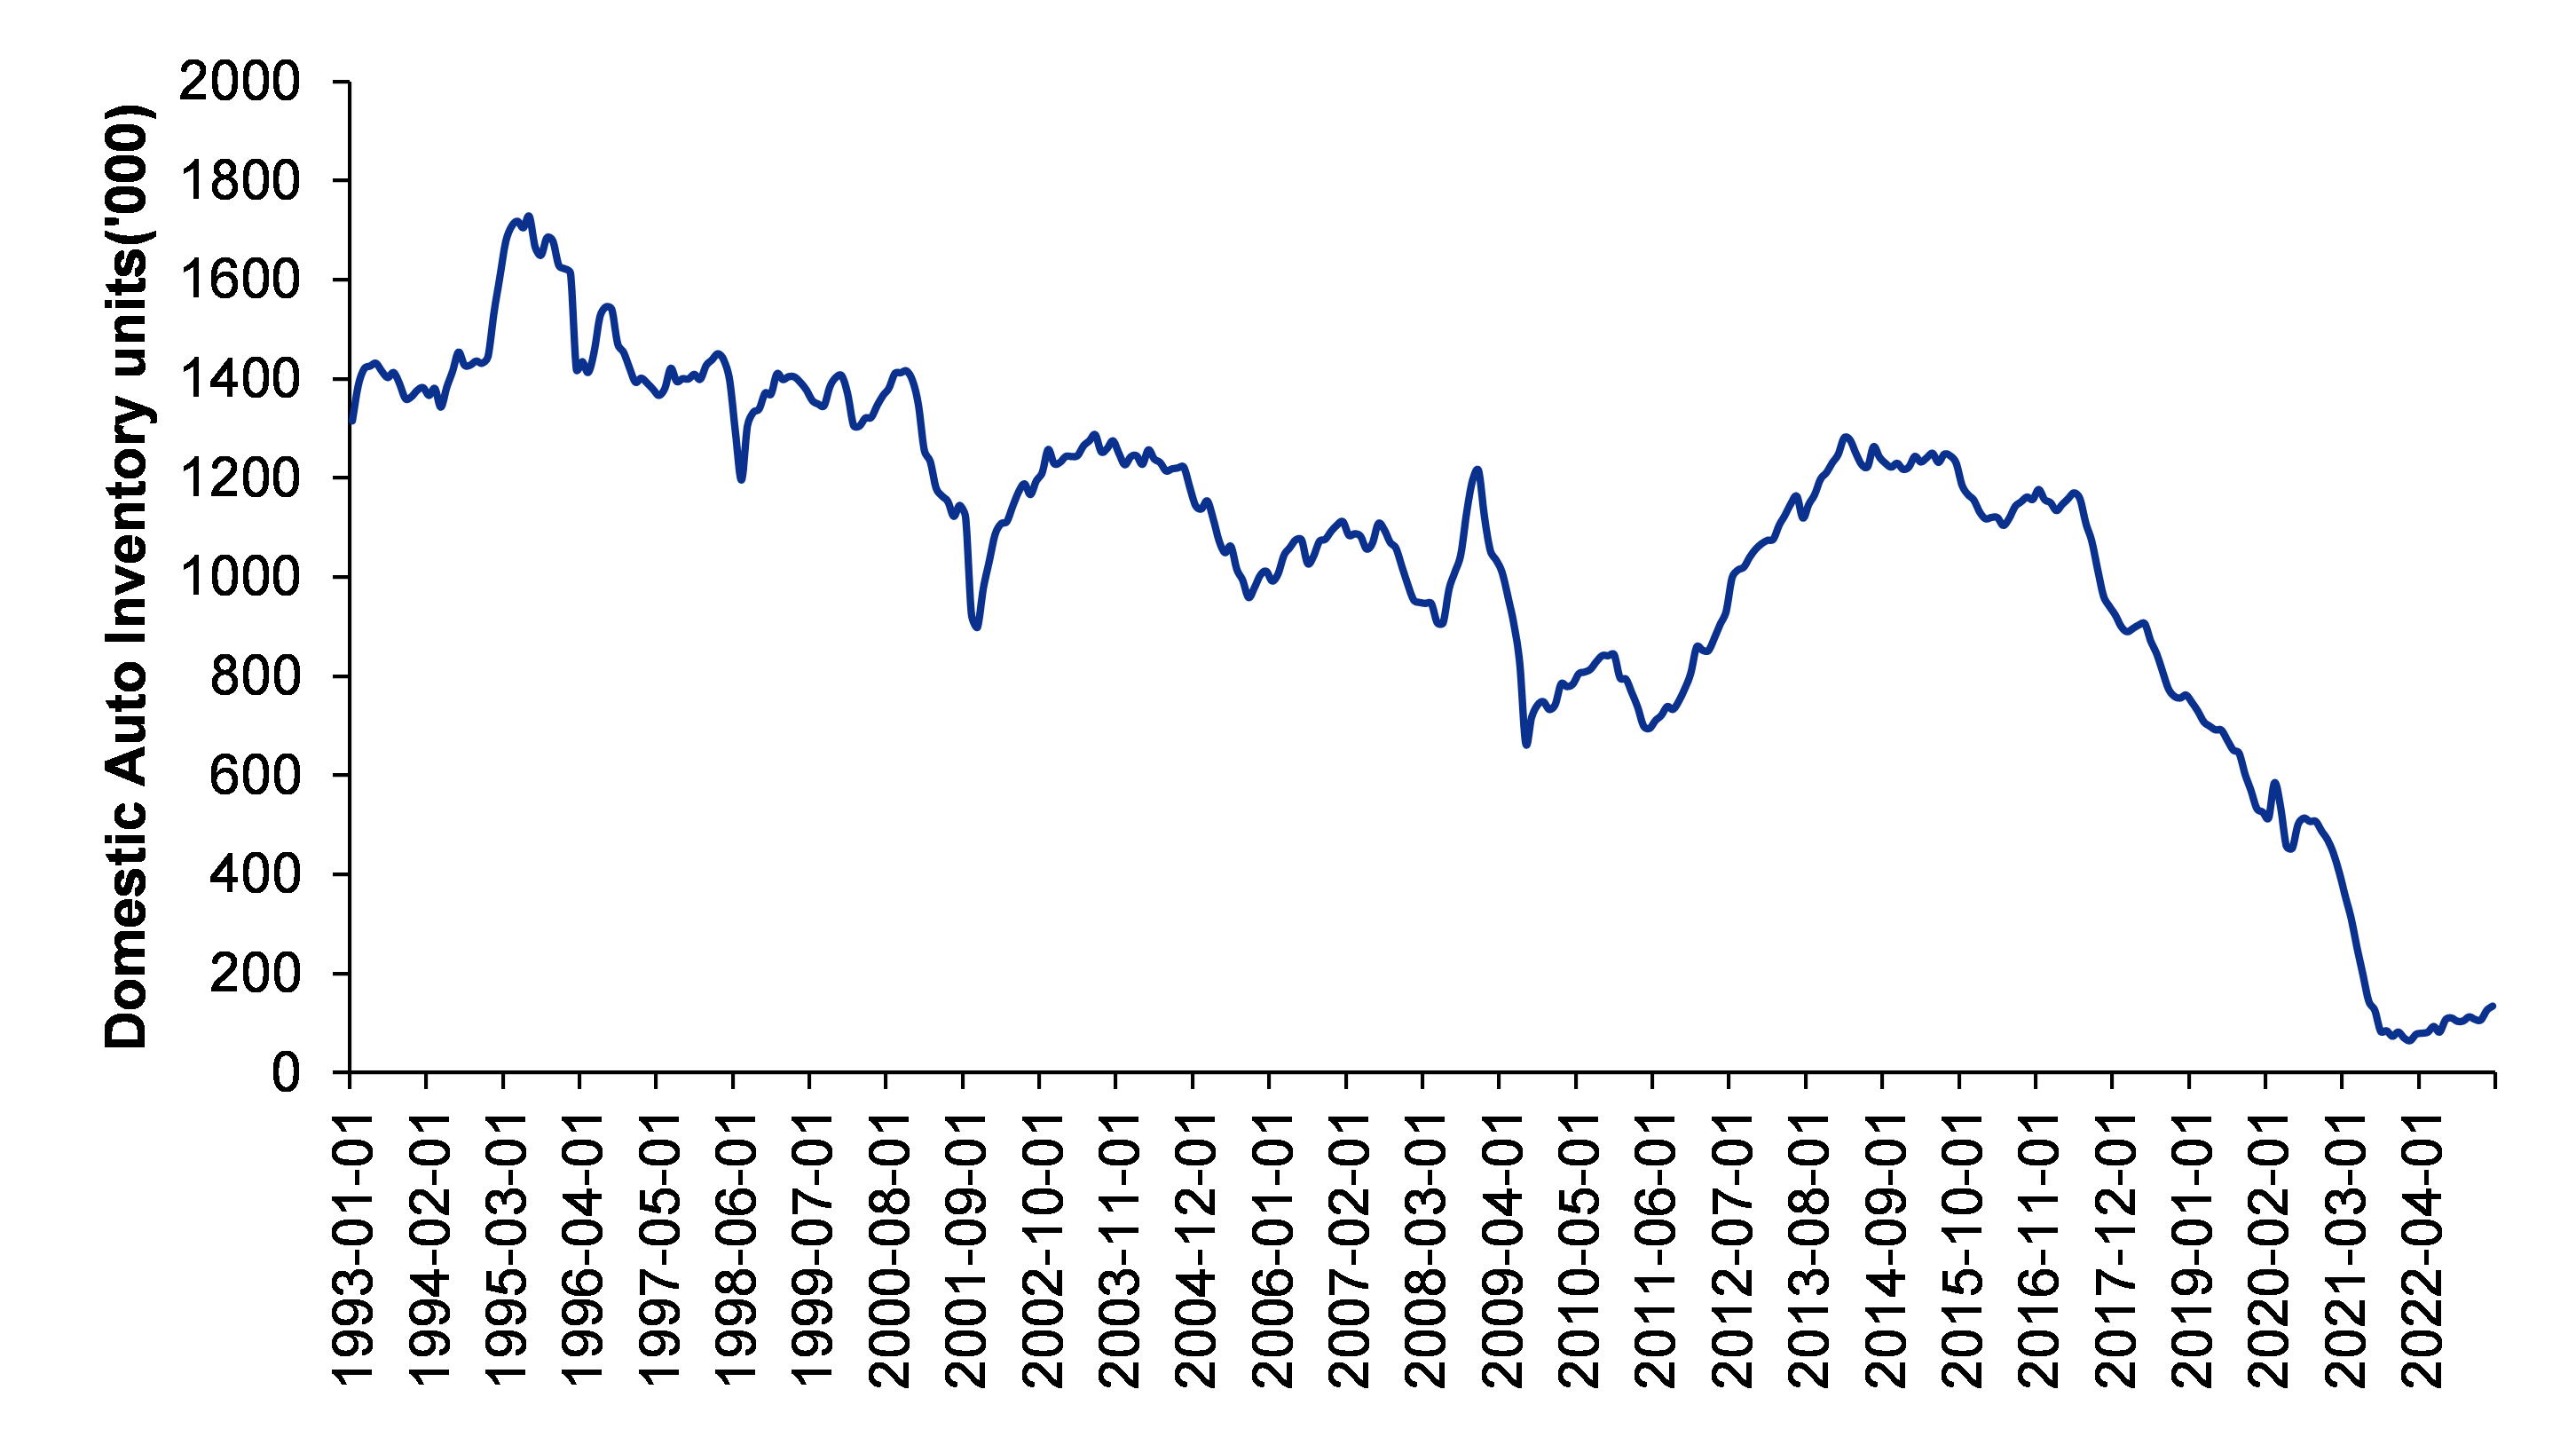
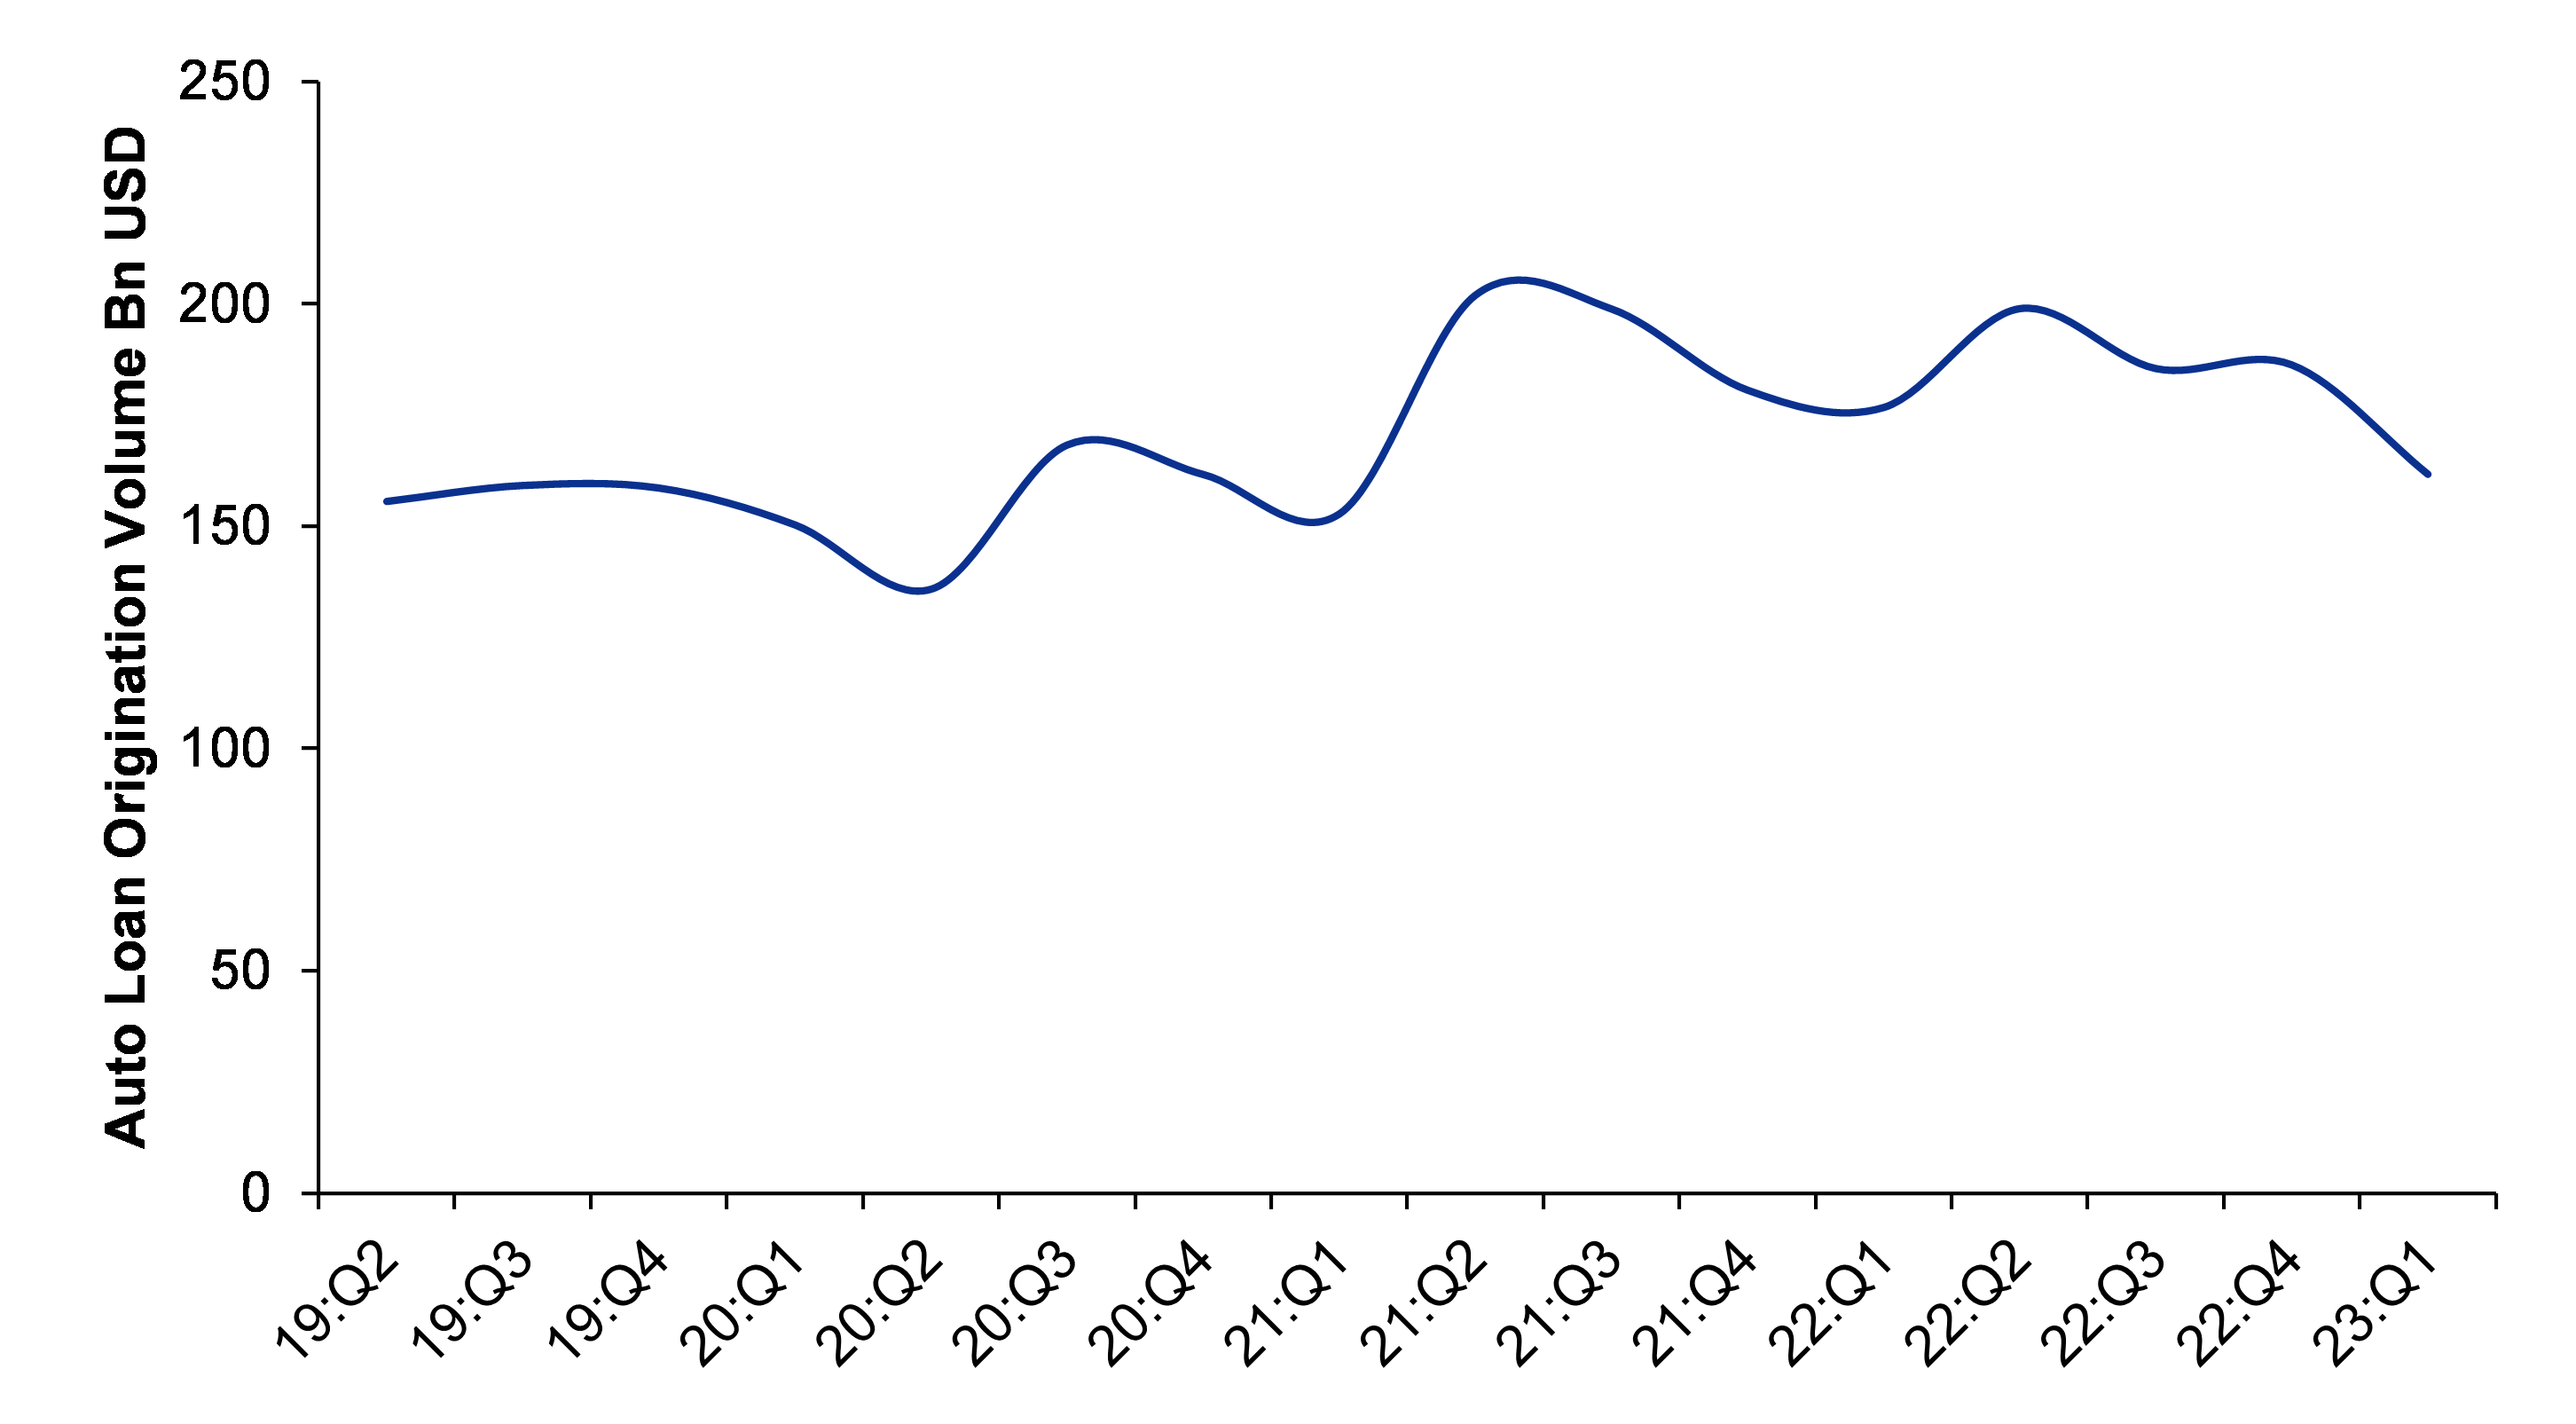
Automobile companies in the US are posting robust sales numbers, mainly driven by the pent-up demand post-pandemic, and low inventory. However, automobile loan volume origination, a leading indicator for volume sales, is showing signs of a decline, suggesting a weaker outlook.

Figure 40: Declining automobile inventory as a result of which there was pent-up demand, which resulted in robust prospects for the automobile sector

SOURCE: INCRED RESEARCH, COMPANY REPORTS  


Figure 41: Automobile loan origination volume decreased sharply in Jan-Mar 2023 - this suggests that US Fed rate hike is finally coming to the fore and hence, there can be some moderation in automobile sales in the coming quarters

SOURCE: INCRED RESEARCH, COMPANY REPORTS  

China produces half of the world’s steel

The talk on any commodity is incomplete without looking at the Chinese market. China produces half of the world’s steel and hence, any change in China’s production schedule has serious repercussions for the global steel industry. However, a significant portion of Chinese steel is still produced via the blast furnace route (~89%), and hence, it has a lot of catching up to do as far as EAF production is concerned. Although the Chinese government aims to decrease steel production via the BF route, anything which the Chinese say must be taken with a pinch of salt. Moreover, HEG doesn’t sell any electrodes in China, but it competes with Chinese companies in UHP electrodes. China’s construction sector - the major consumer of steel - has been in the doldrums since the Evergrande realty crisis in 2021.

China’s real estate outlook looks bleak  

China’s real estate market received a huge shock when its government, in an attempt to rein in the highly indebted property development sector, enacted a ‘three red lines’ rule in 2020 to regulate the leverage taken on by developers, limiting their borrowing based on the following metrics: debt-to-cash, debt-to-equity, and debt-to-assets. All those real estate developers who didn’t perform well on these metrics were cut off from Chinese lenders and were first told to repay their huge debt. This started a series of defaults in the Chinese real estate market, which has been continuing even now.

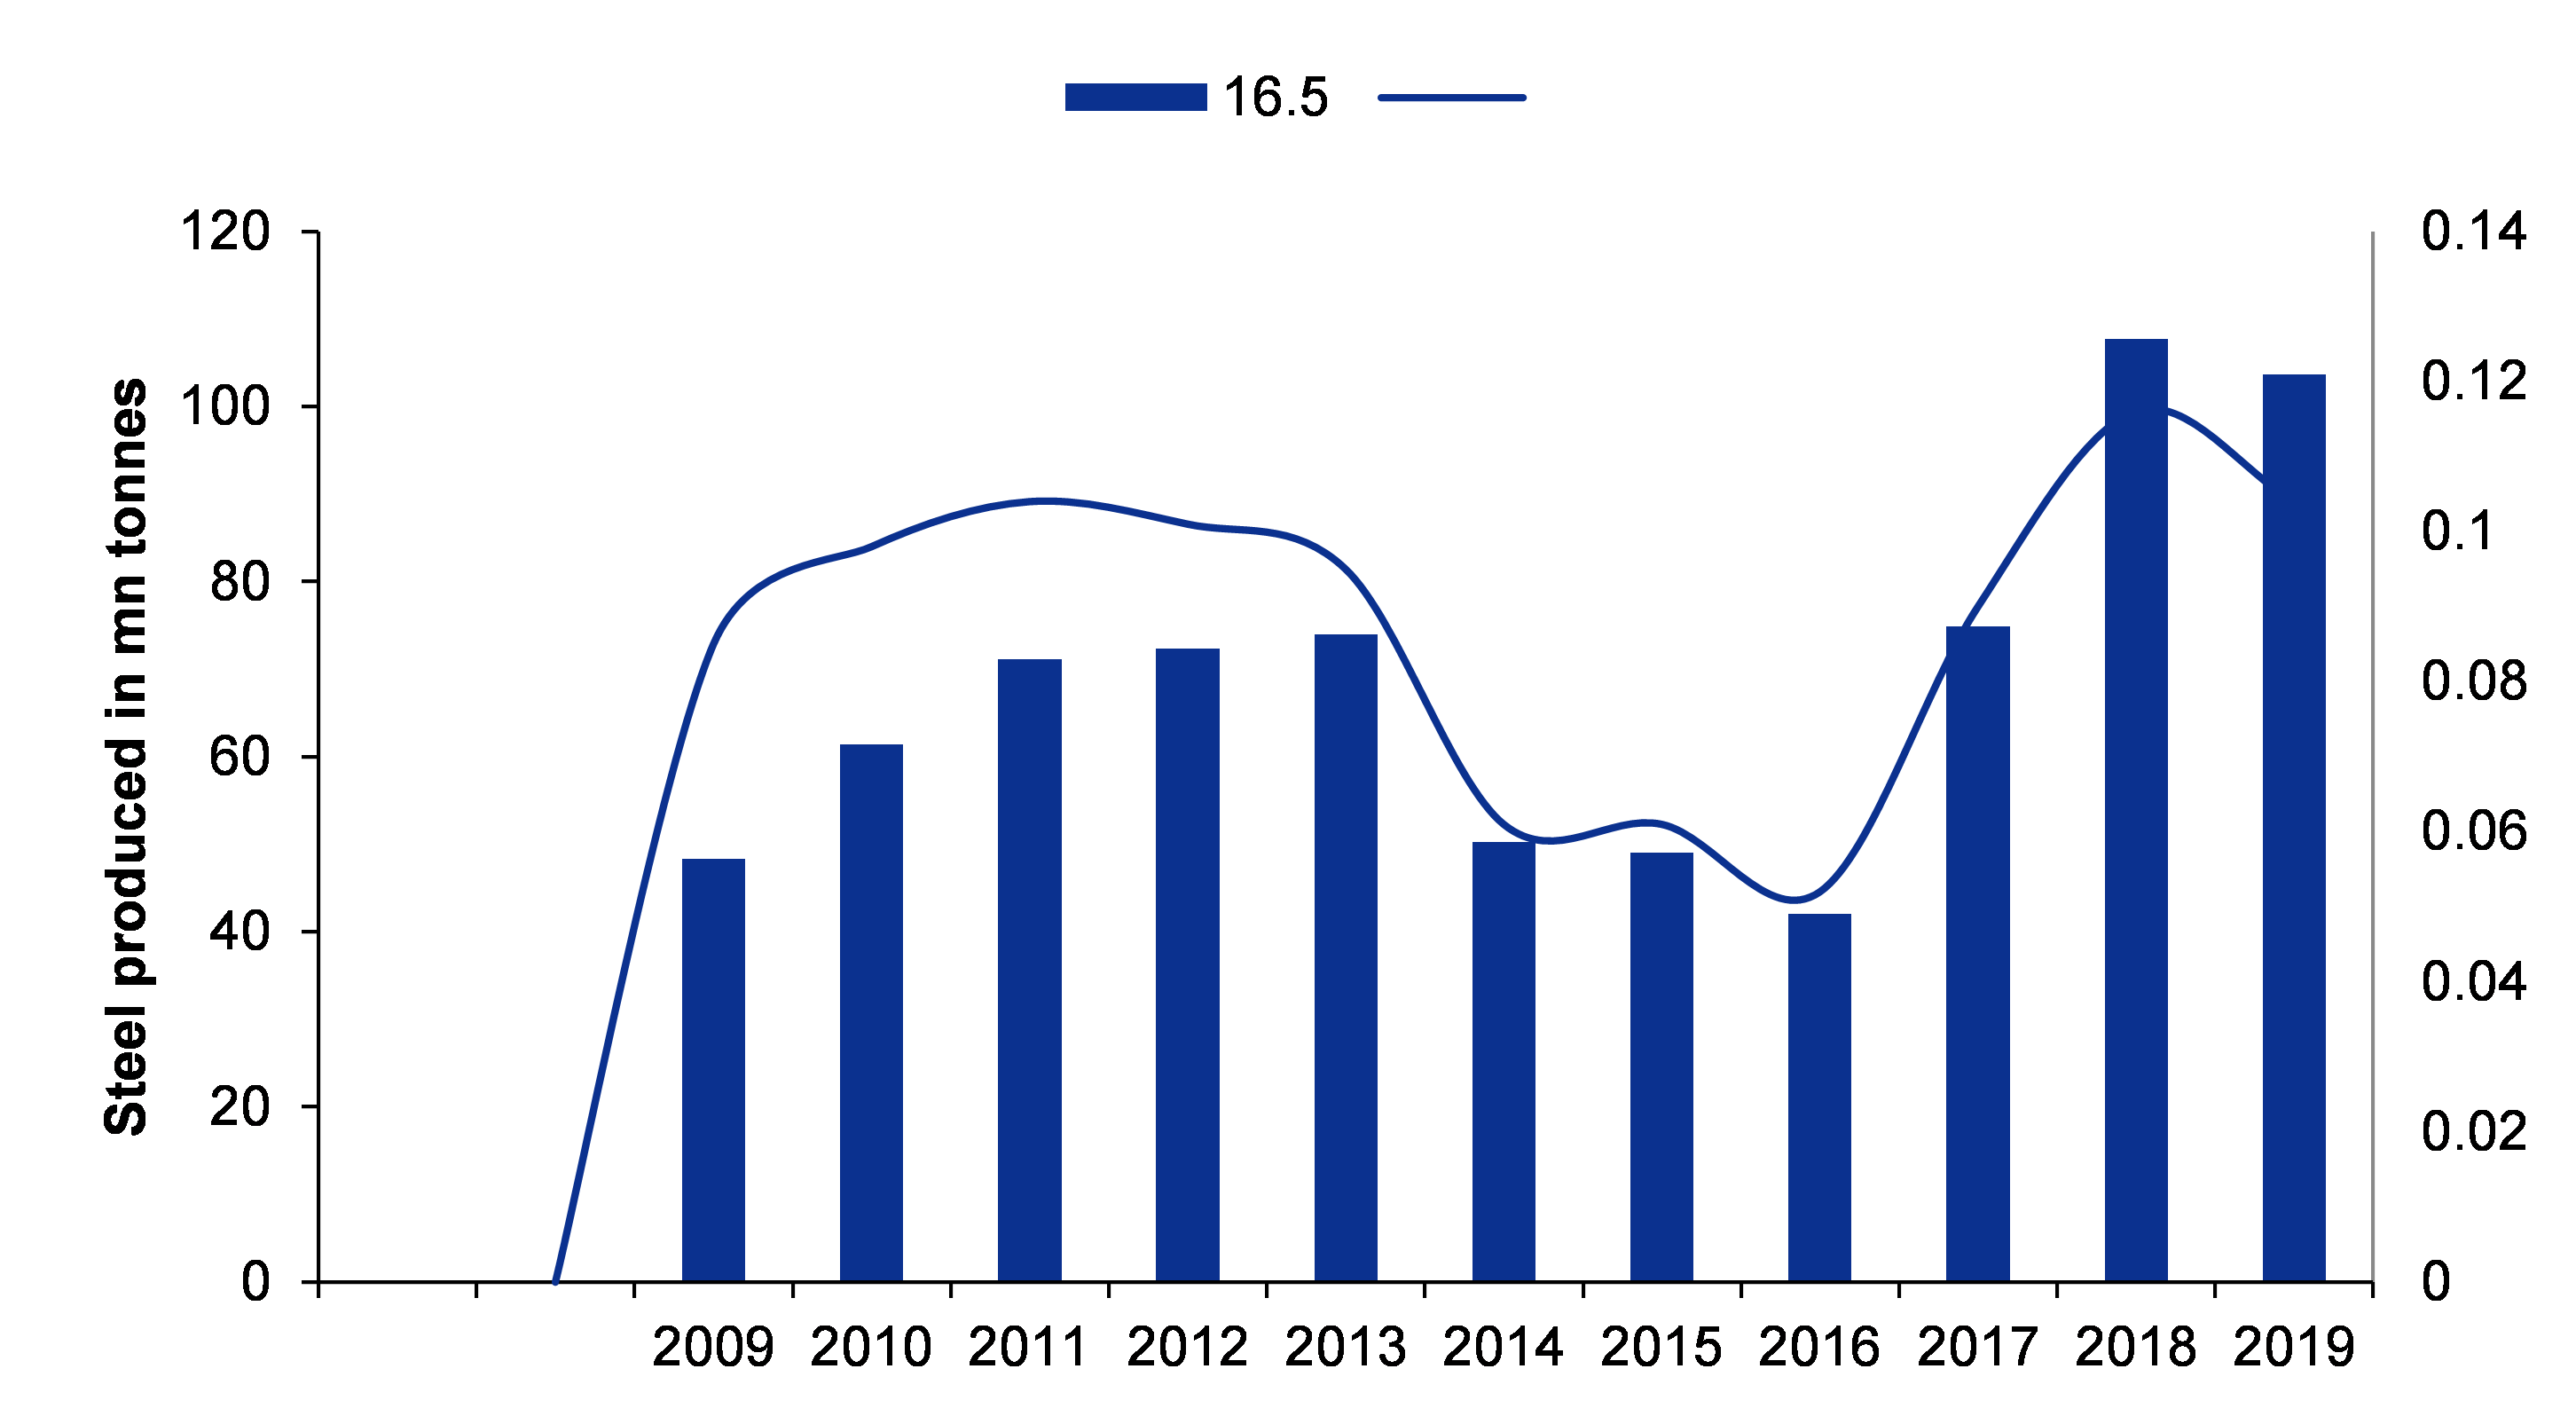
Figure 42: Chinese steel produced via the EAF route; EAF-based steel production, as a % of total volume, has remained constant around 9~10% and although the Chinese government plans to reach 25% by 2030F, there is not much action on the ground

SOURCE: INCRED RESEARCH, COMPANY REPORTS  


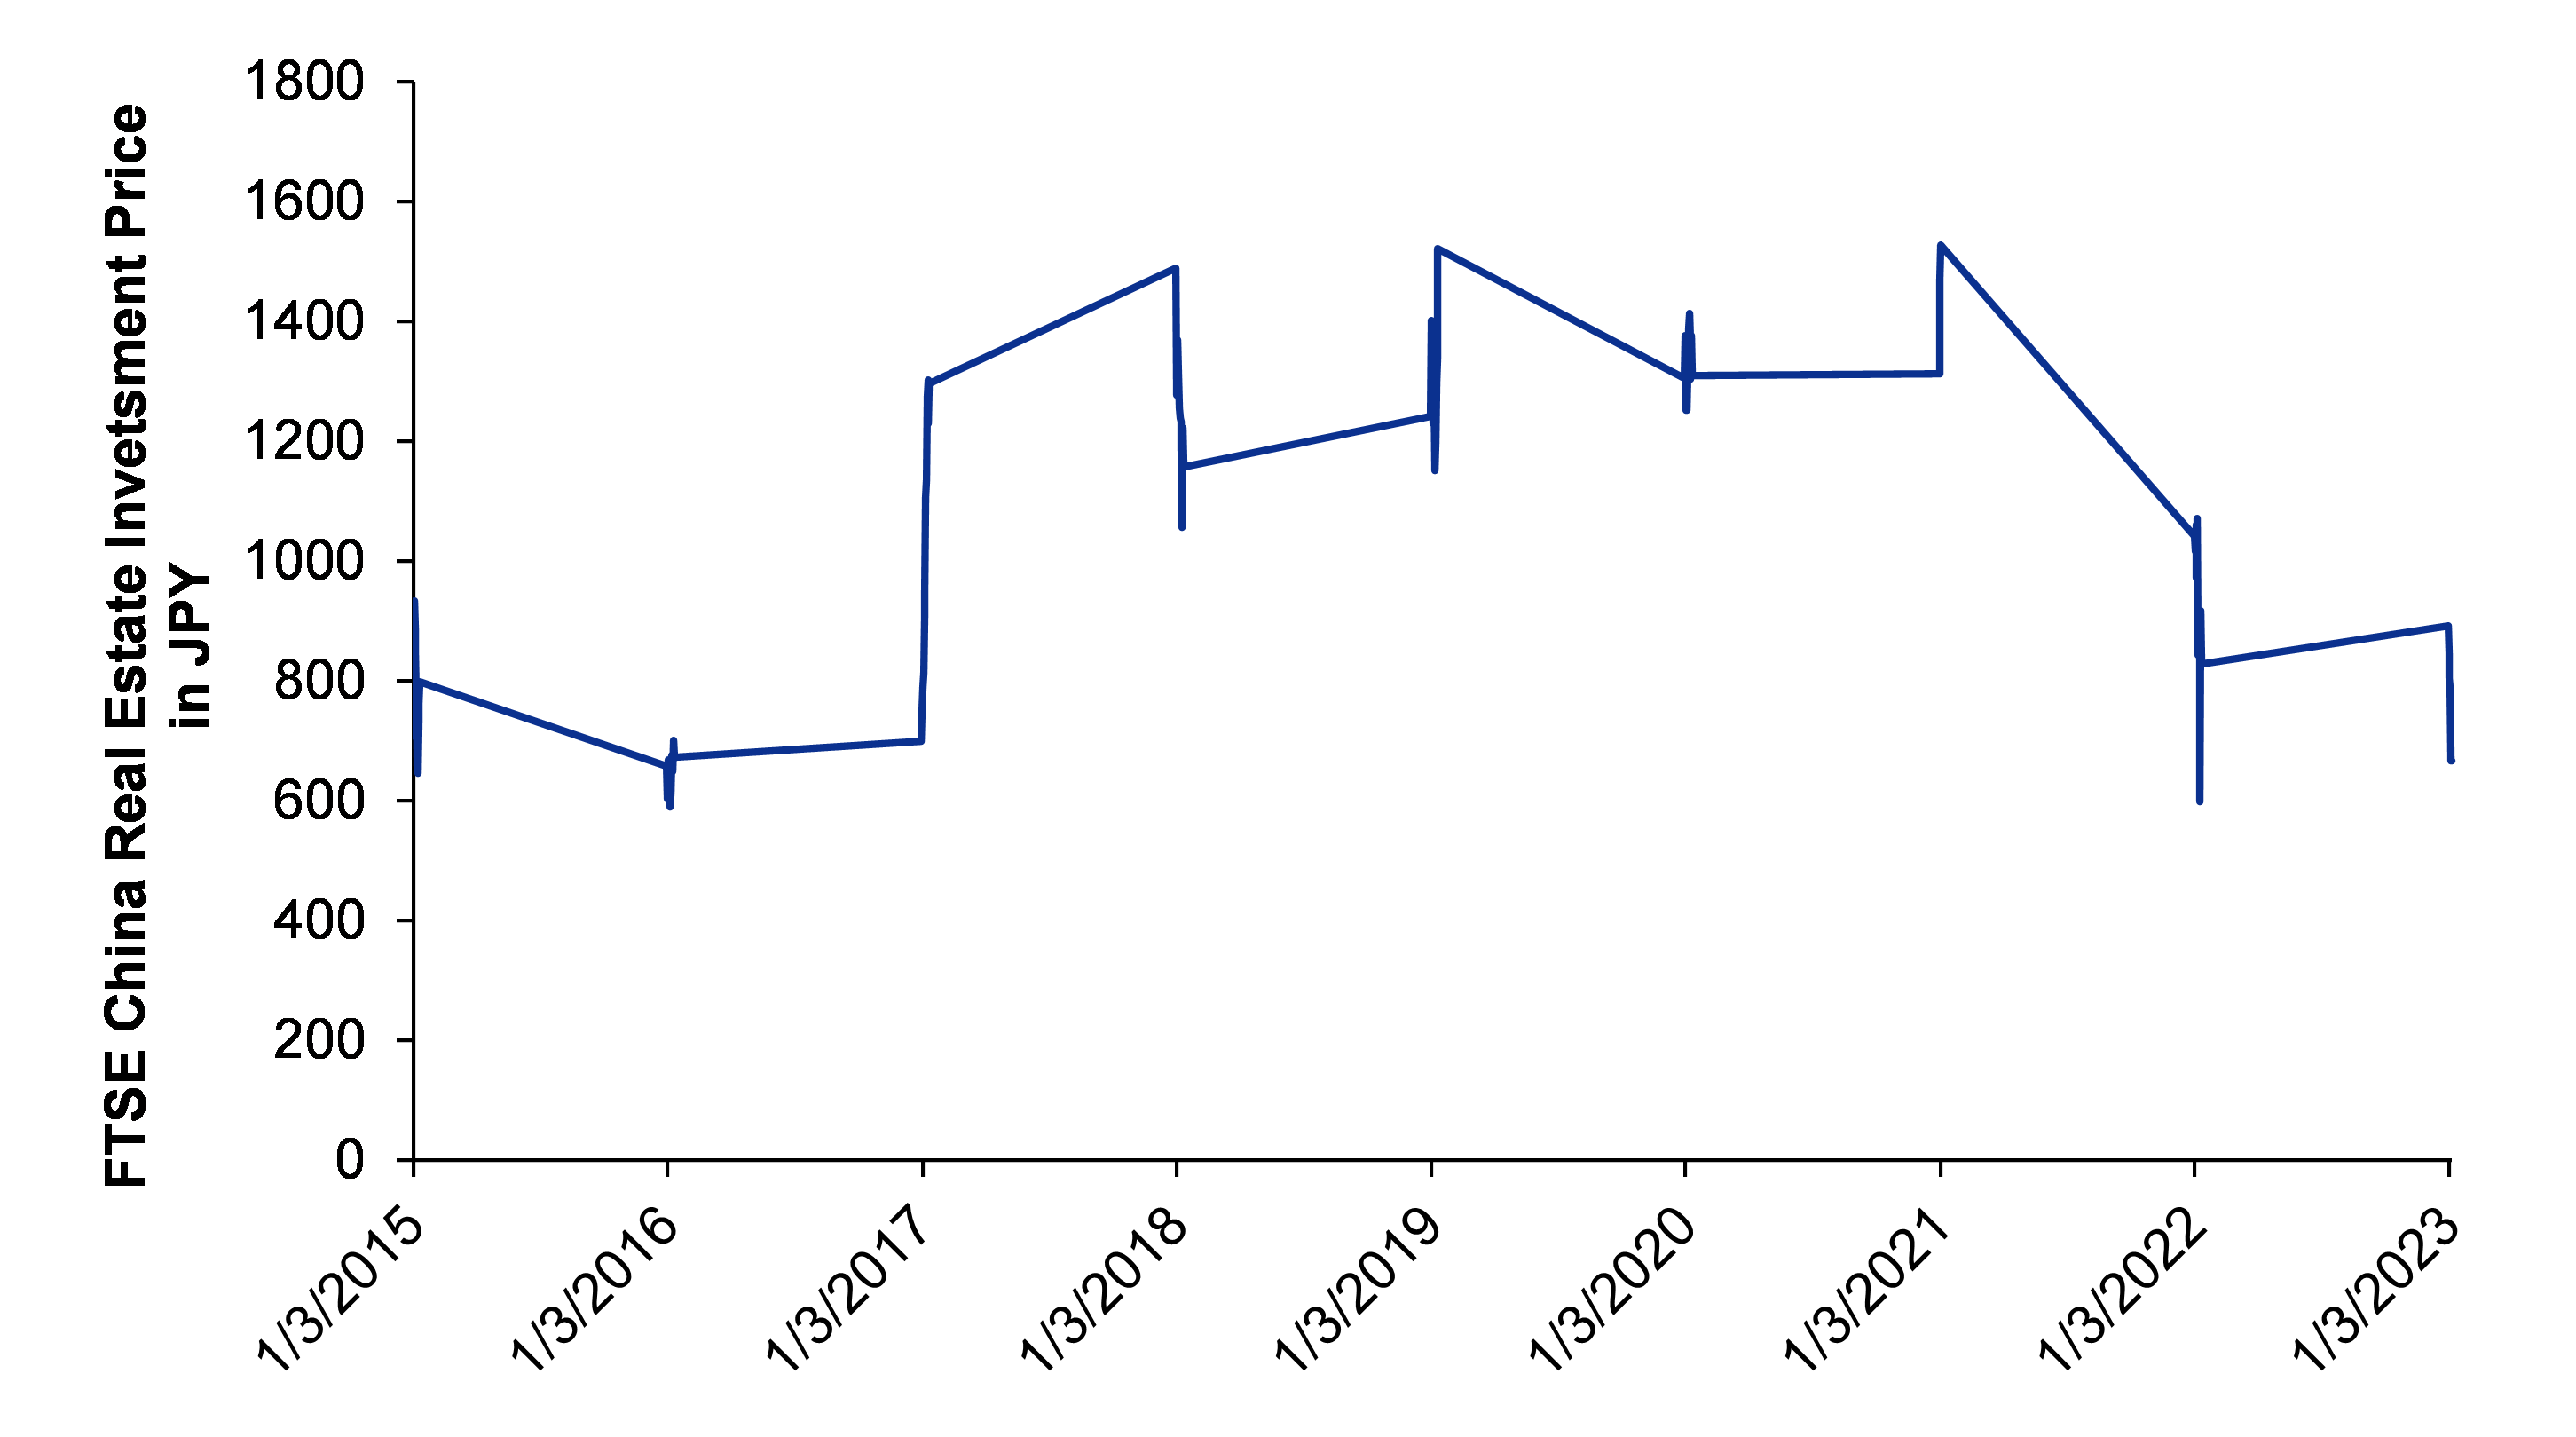
Figure 43: China’s real estate stocks figuring in various indices have seen their prices decreasing considerably since the ‘three red lines’ rule, and are now at multi- year lows

SOURCE: INCRED RESEARCH, COMPANY REPORTS  


Figure 44: China’s housing starts monthly data for Apr 2023 was at 312m m2, - way lower than the highs of 2.48bn m2

SOURCE: INCRED RESEARCH, COMPANY REPORTS  


Tracking China’s steel industry

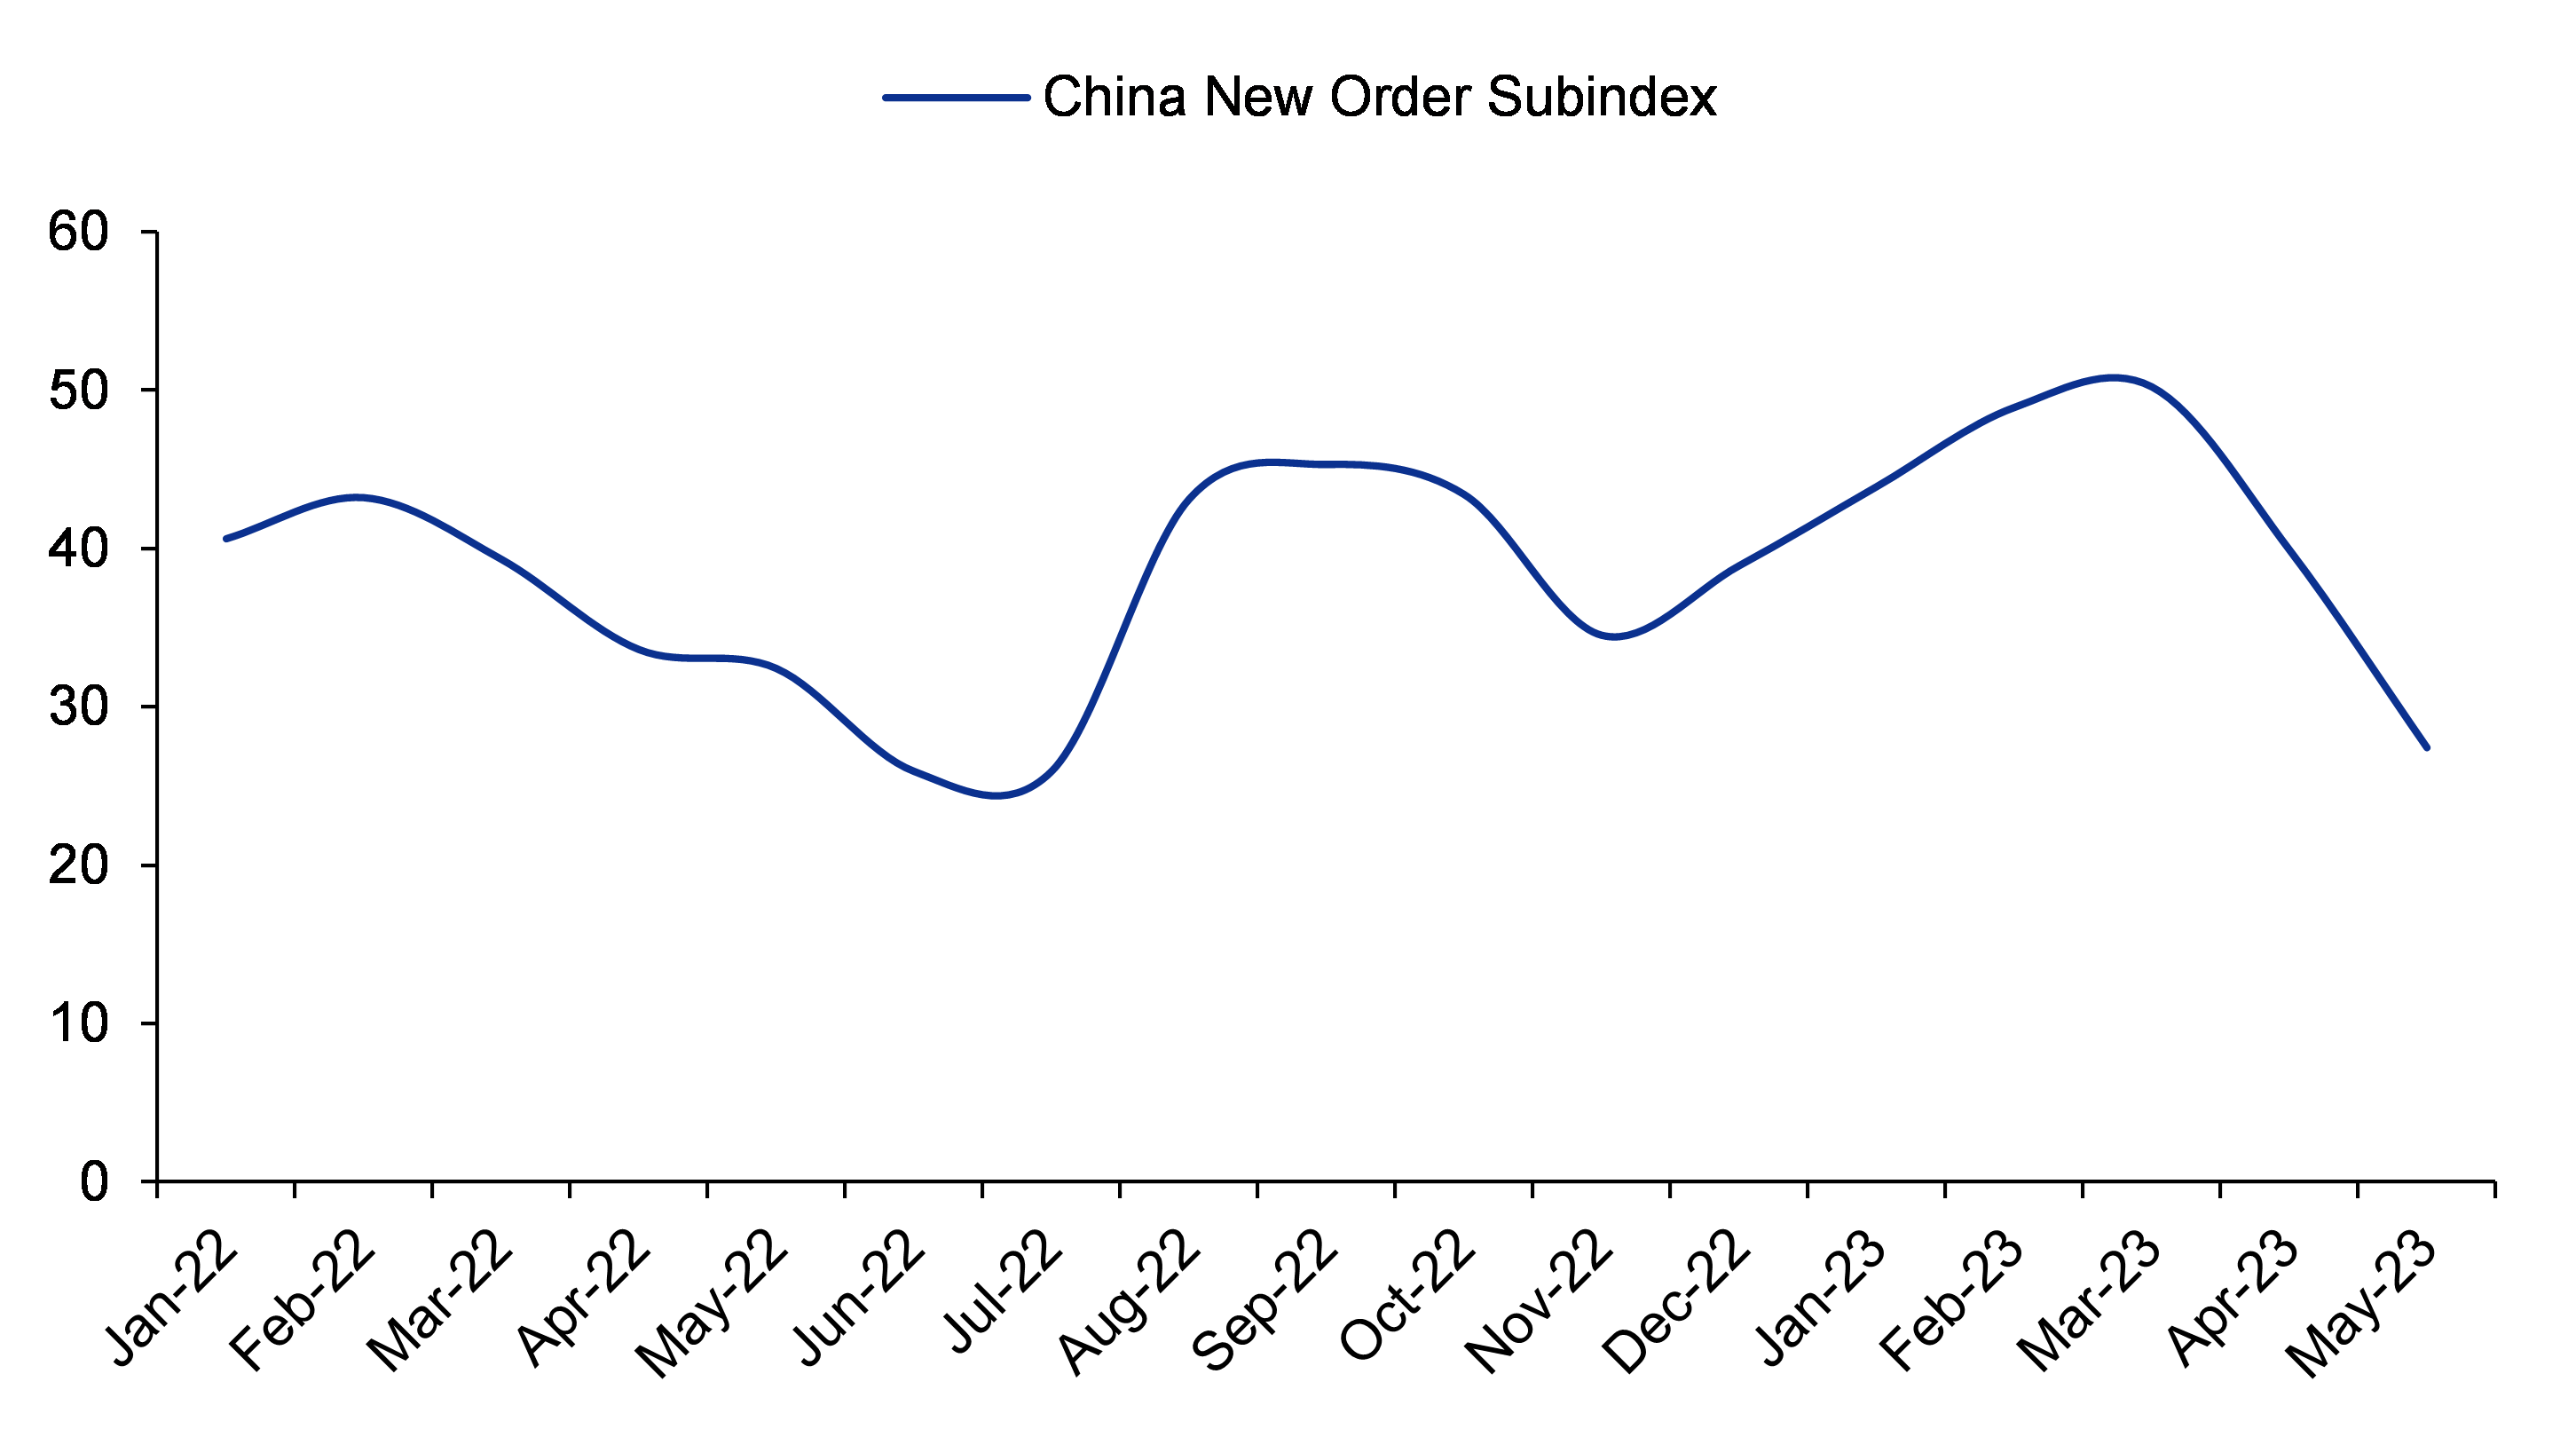
Figure 45: China’s New Order Index for steel has been continuously declining, suggesting a bleak future as far as the steel industry in China is concerned

SOURCE: INCRED RESEARCH, COMPANY REPORTS  

As the New Order Index in China declines, most of the steel which the country manufactures will be transported to the global market, depressing steel prices. As most of the steel in China is manufactured by the BF route, this is bad news for HEG.

Figure 46: China’s monthly steel exports (in mt)

SOURCE: INCRED RESEARCH, COMPANY REPORTS  

If we look at the monthly export data and the New Order Index in conjunction, we observe that as the New Order Index for steel increases, China consumes more of its steel and hence, exports less to the world. In that scenario, the current New Order Index of 27 signals alarm bells for the world. It should be noted that if the index trends below 50, it suggests a contractionary environment.

Blast furnace route still rules the roost for Indian steel
makers

As far as India is concerned, HEG sells both UHP and HP electrodes. However, India’s adoption of the EAF route for steelmaking has been relatively slow, as the percentage of steel manufactured through the EAF route has remained relatively constant since the last decade. The World Steel Association data shows that a lot of steel in India is produced via the EAF route. However, that is not the case, as a significant amount was produced via the induction furnace route as well, which is even more polluting than the blast furnace route.

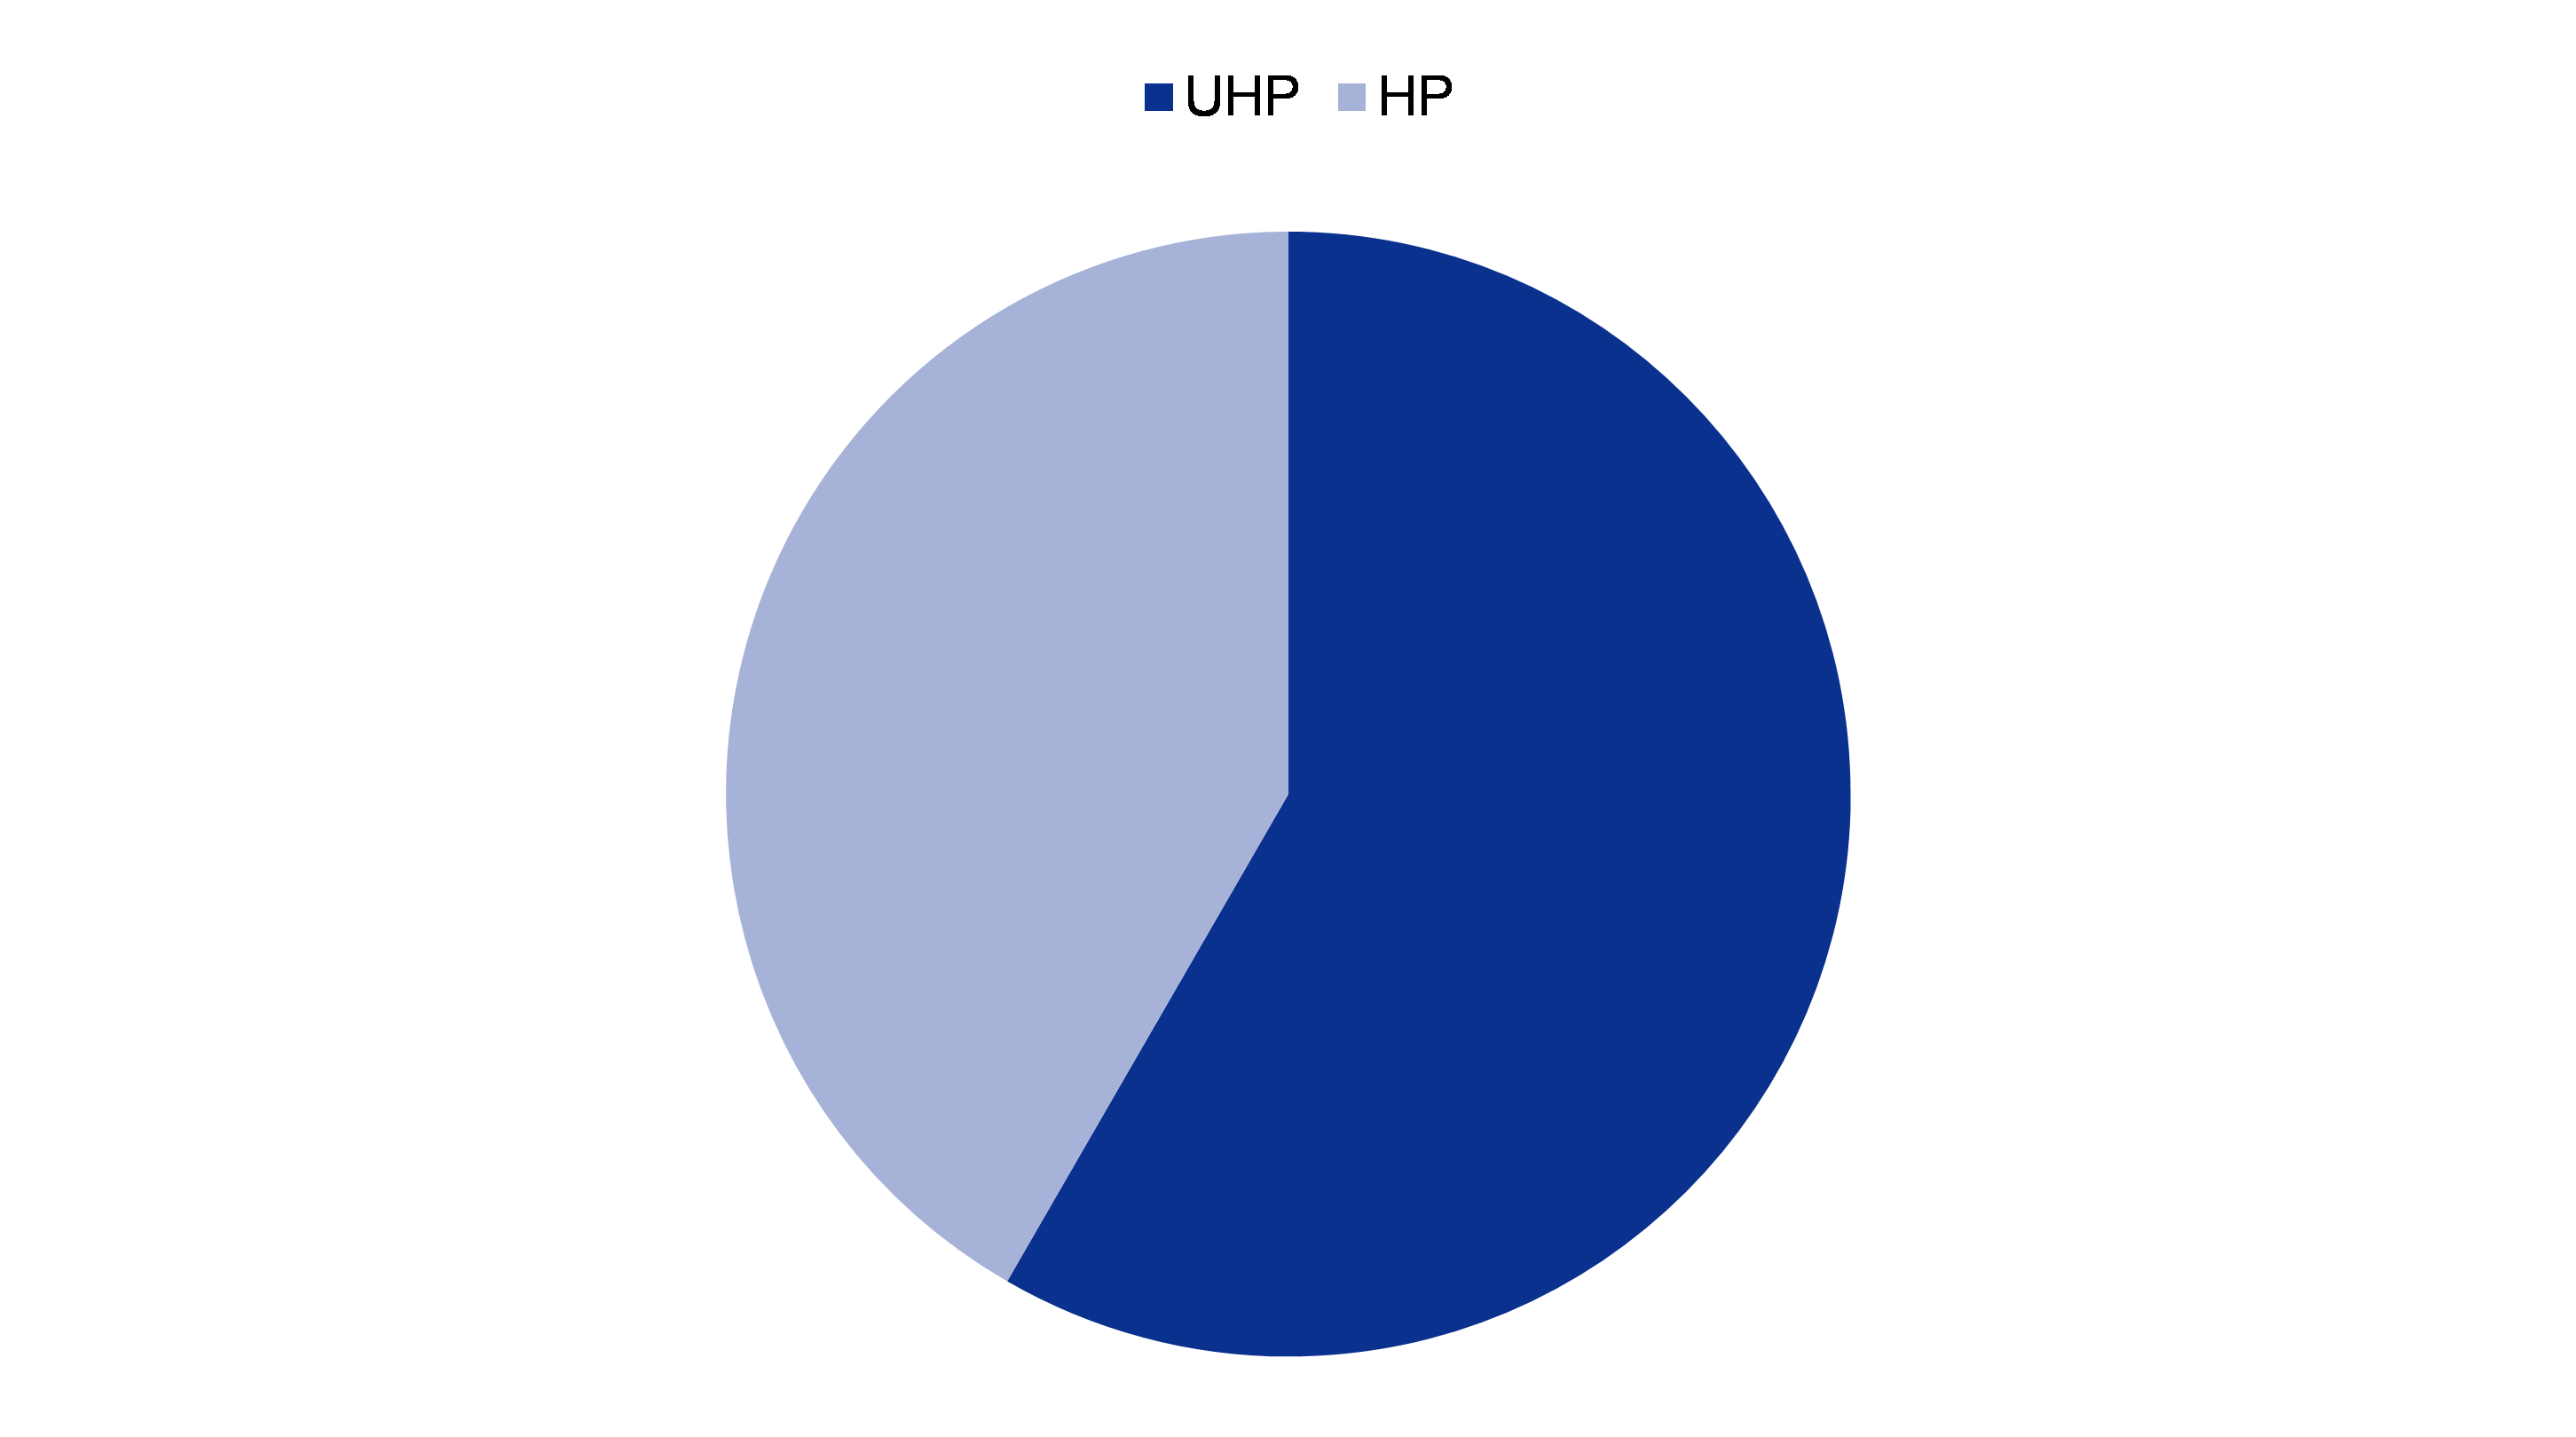
Figure 47: Split between UHP and HP electrode segments in Indian market

SOURCE: INCRED RESEARCH, COMPANY REPORTS  


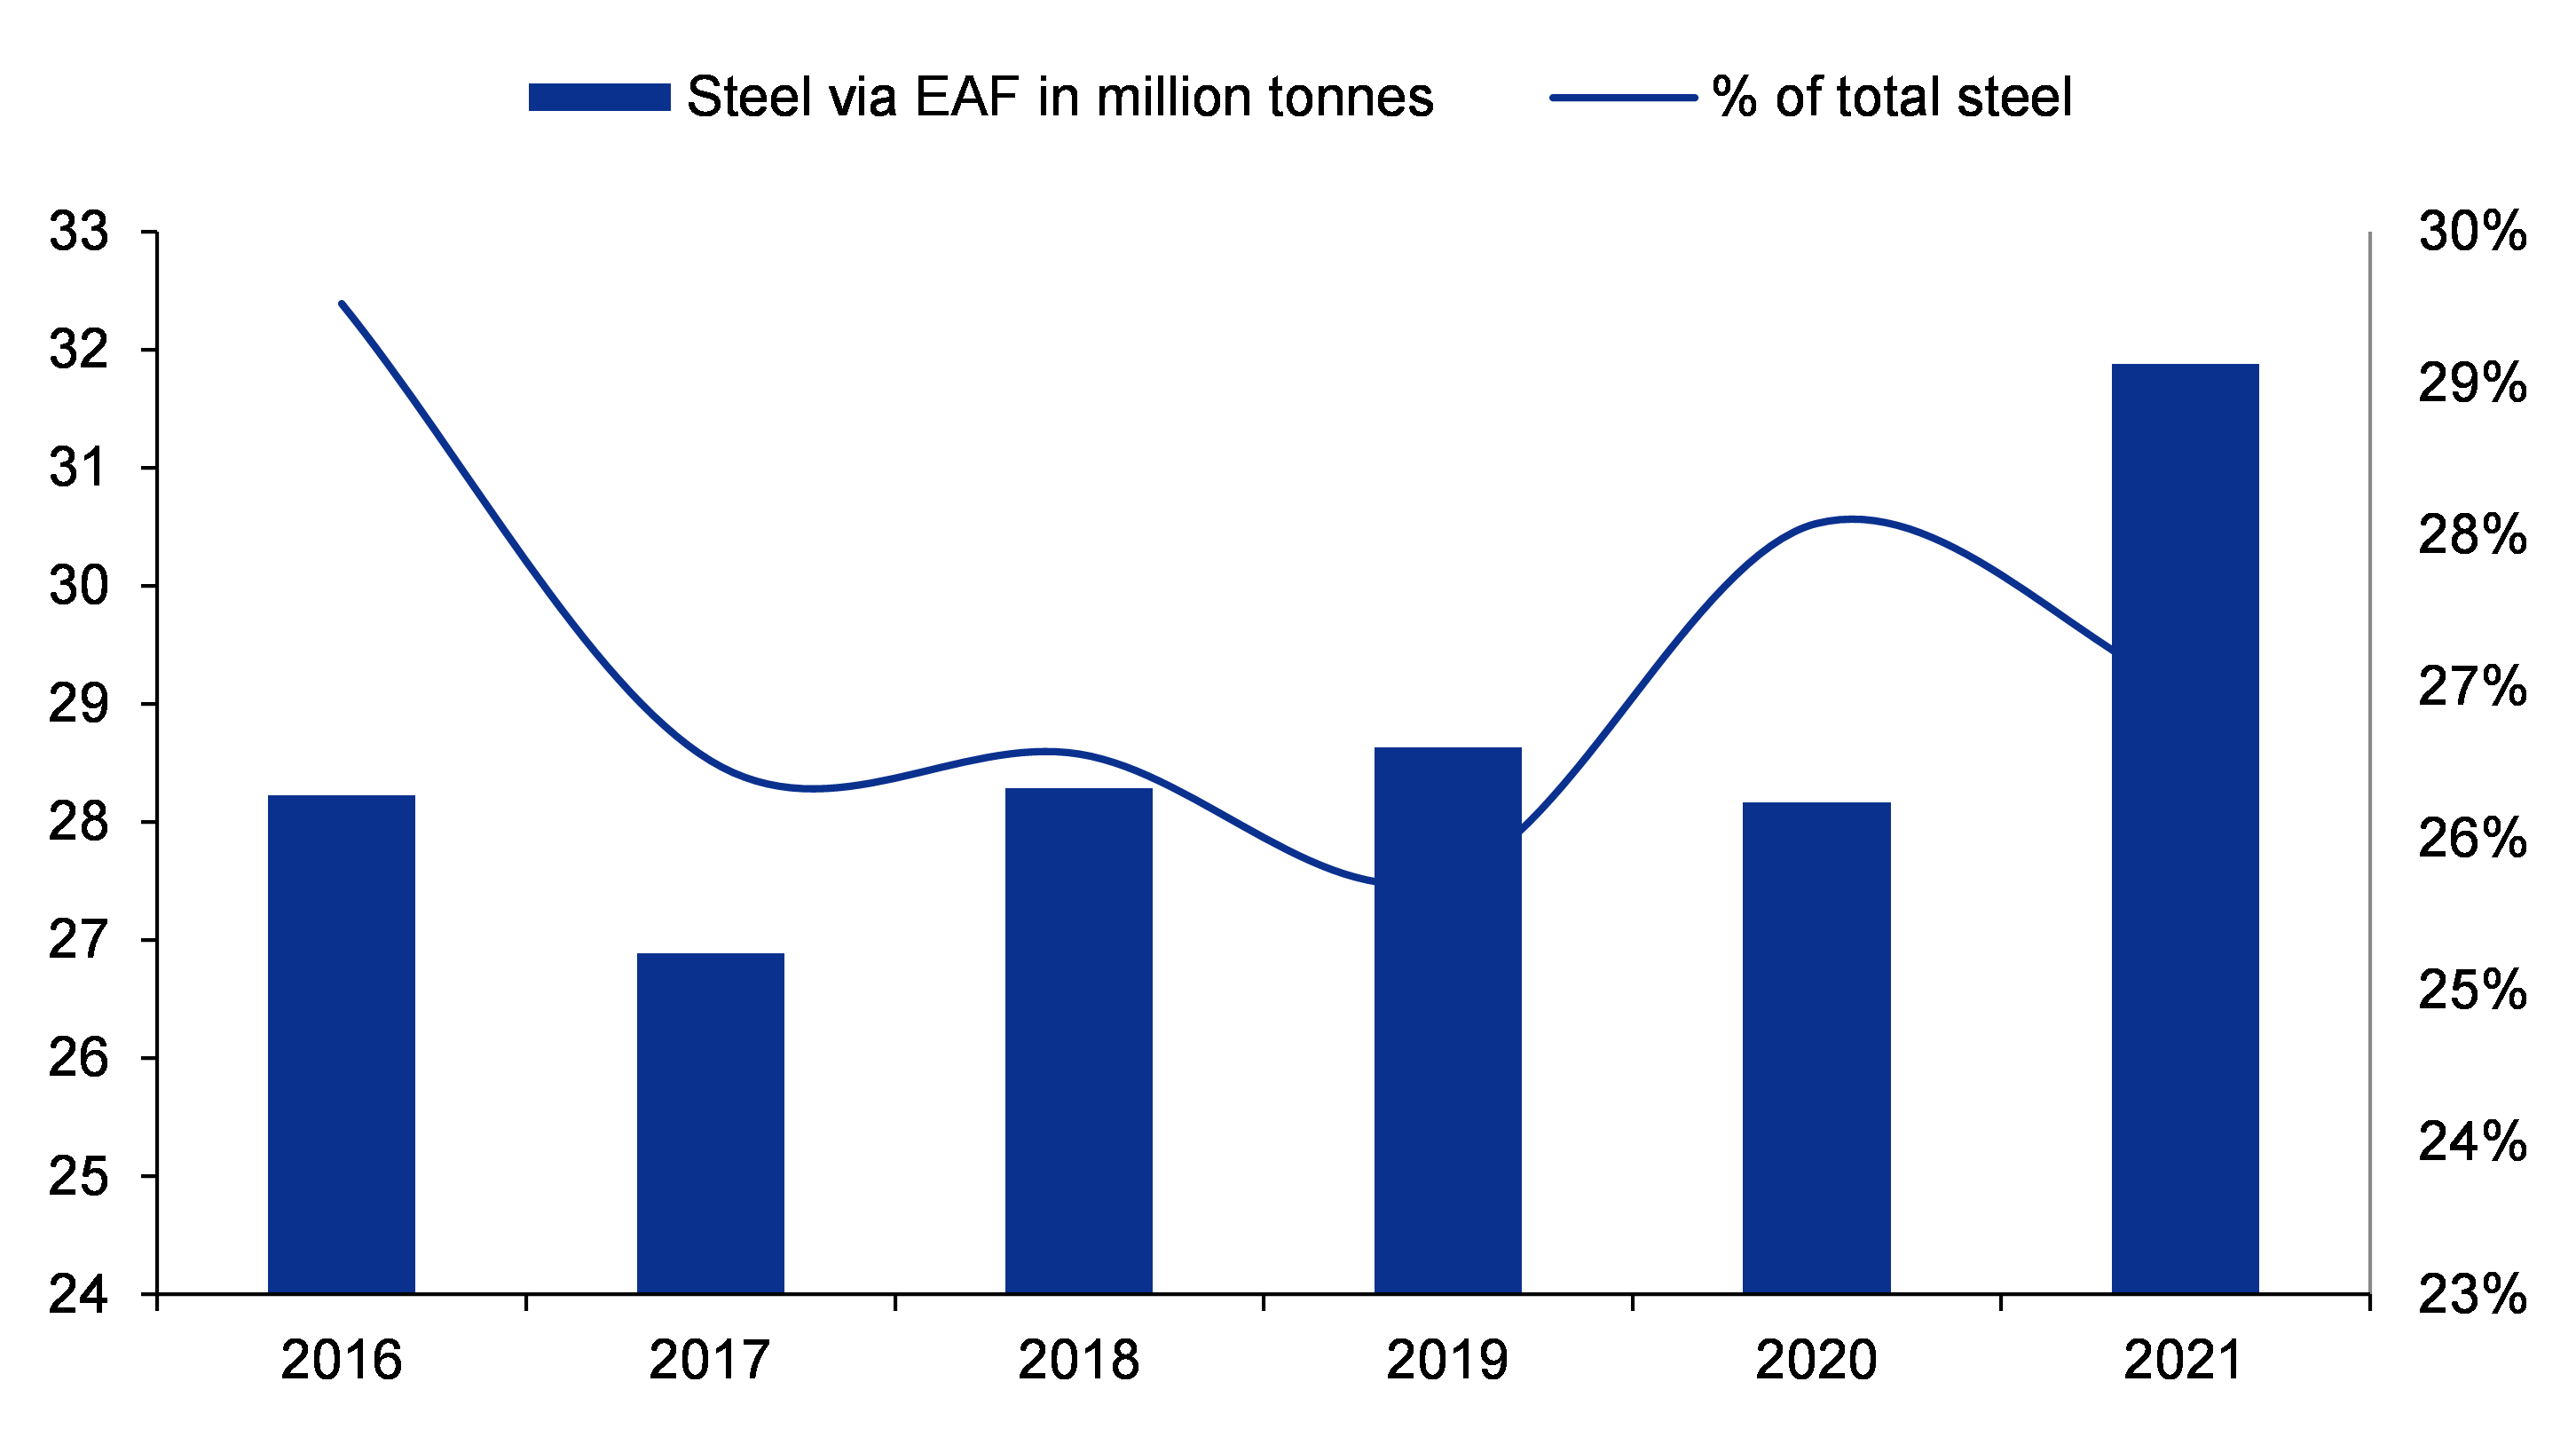
Figure 48: India’s steel production via the EAF route - a lot of steel in India was produced via the highly polluting induction furnaces, which are getting displaced

SOURCE: INCRED RESEARCH, COMPANY REPORTS  


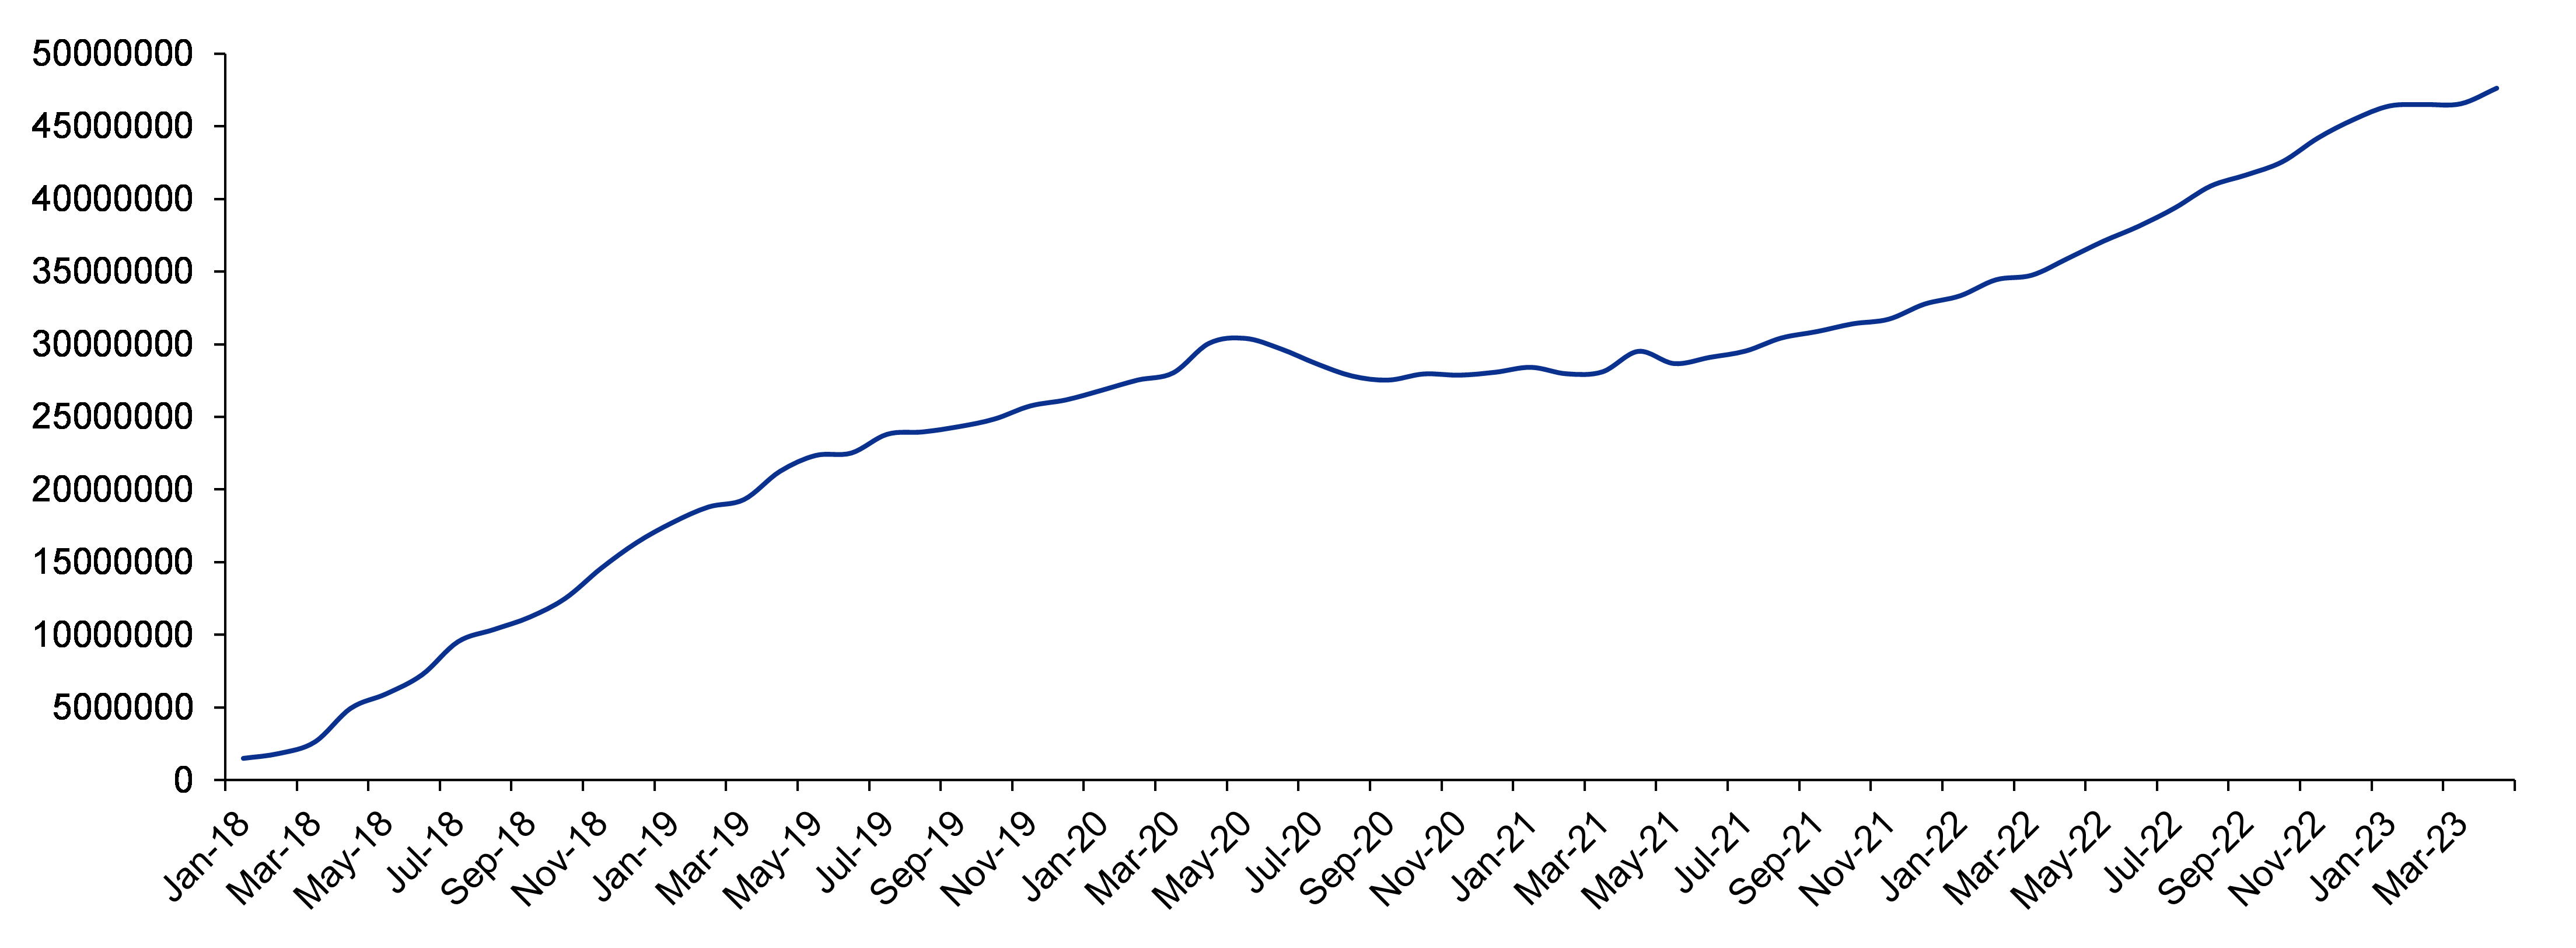
Figure 49: Monthly inventory data of Indian steel companies (in mt)

SOURCE: INCRED RESEARCH, COMPANY REPORTS  


Inventory at Indian steel mills is at an all-time high

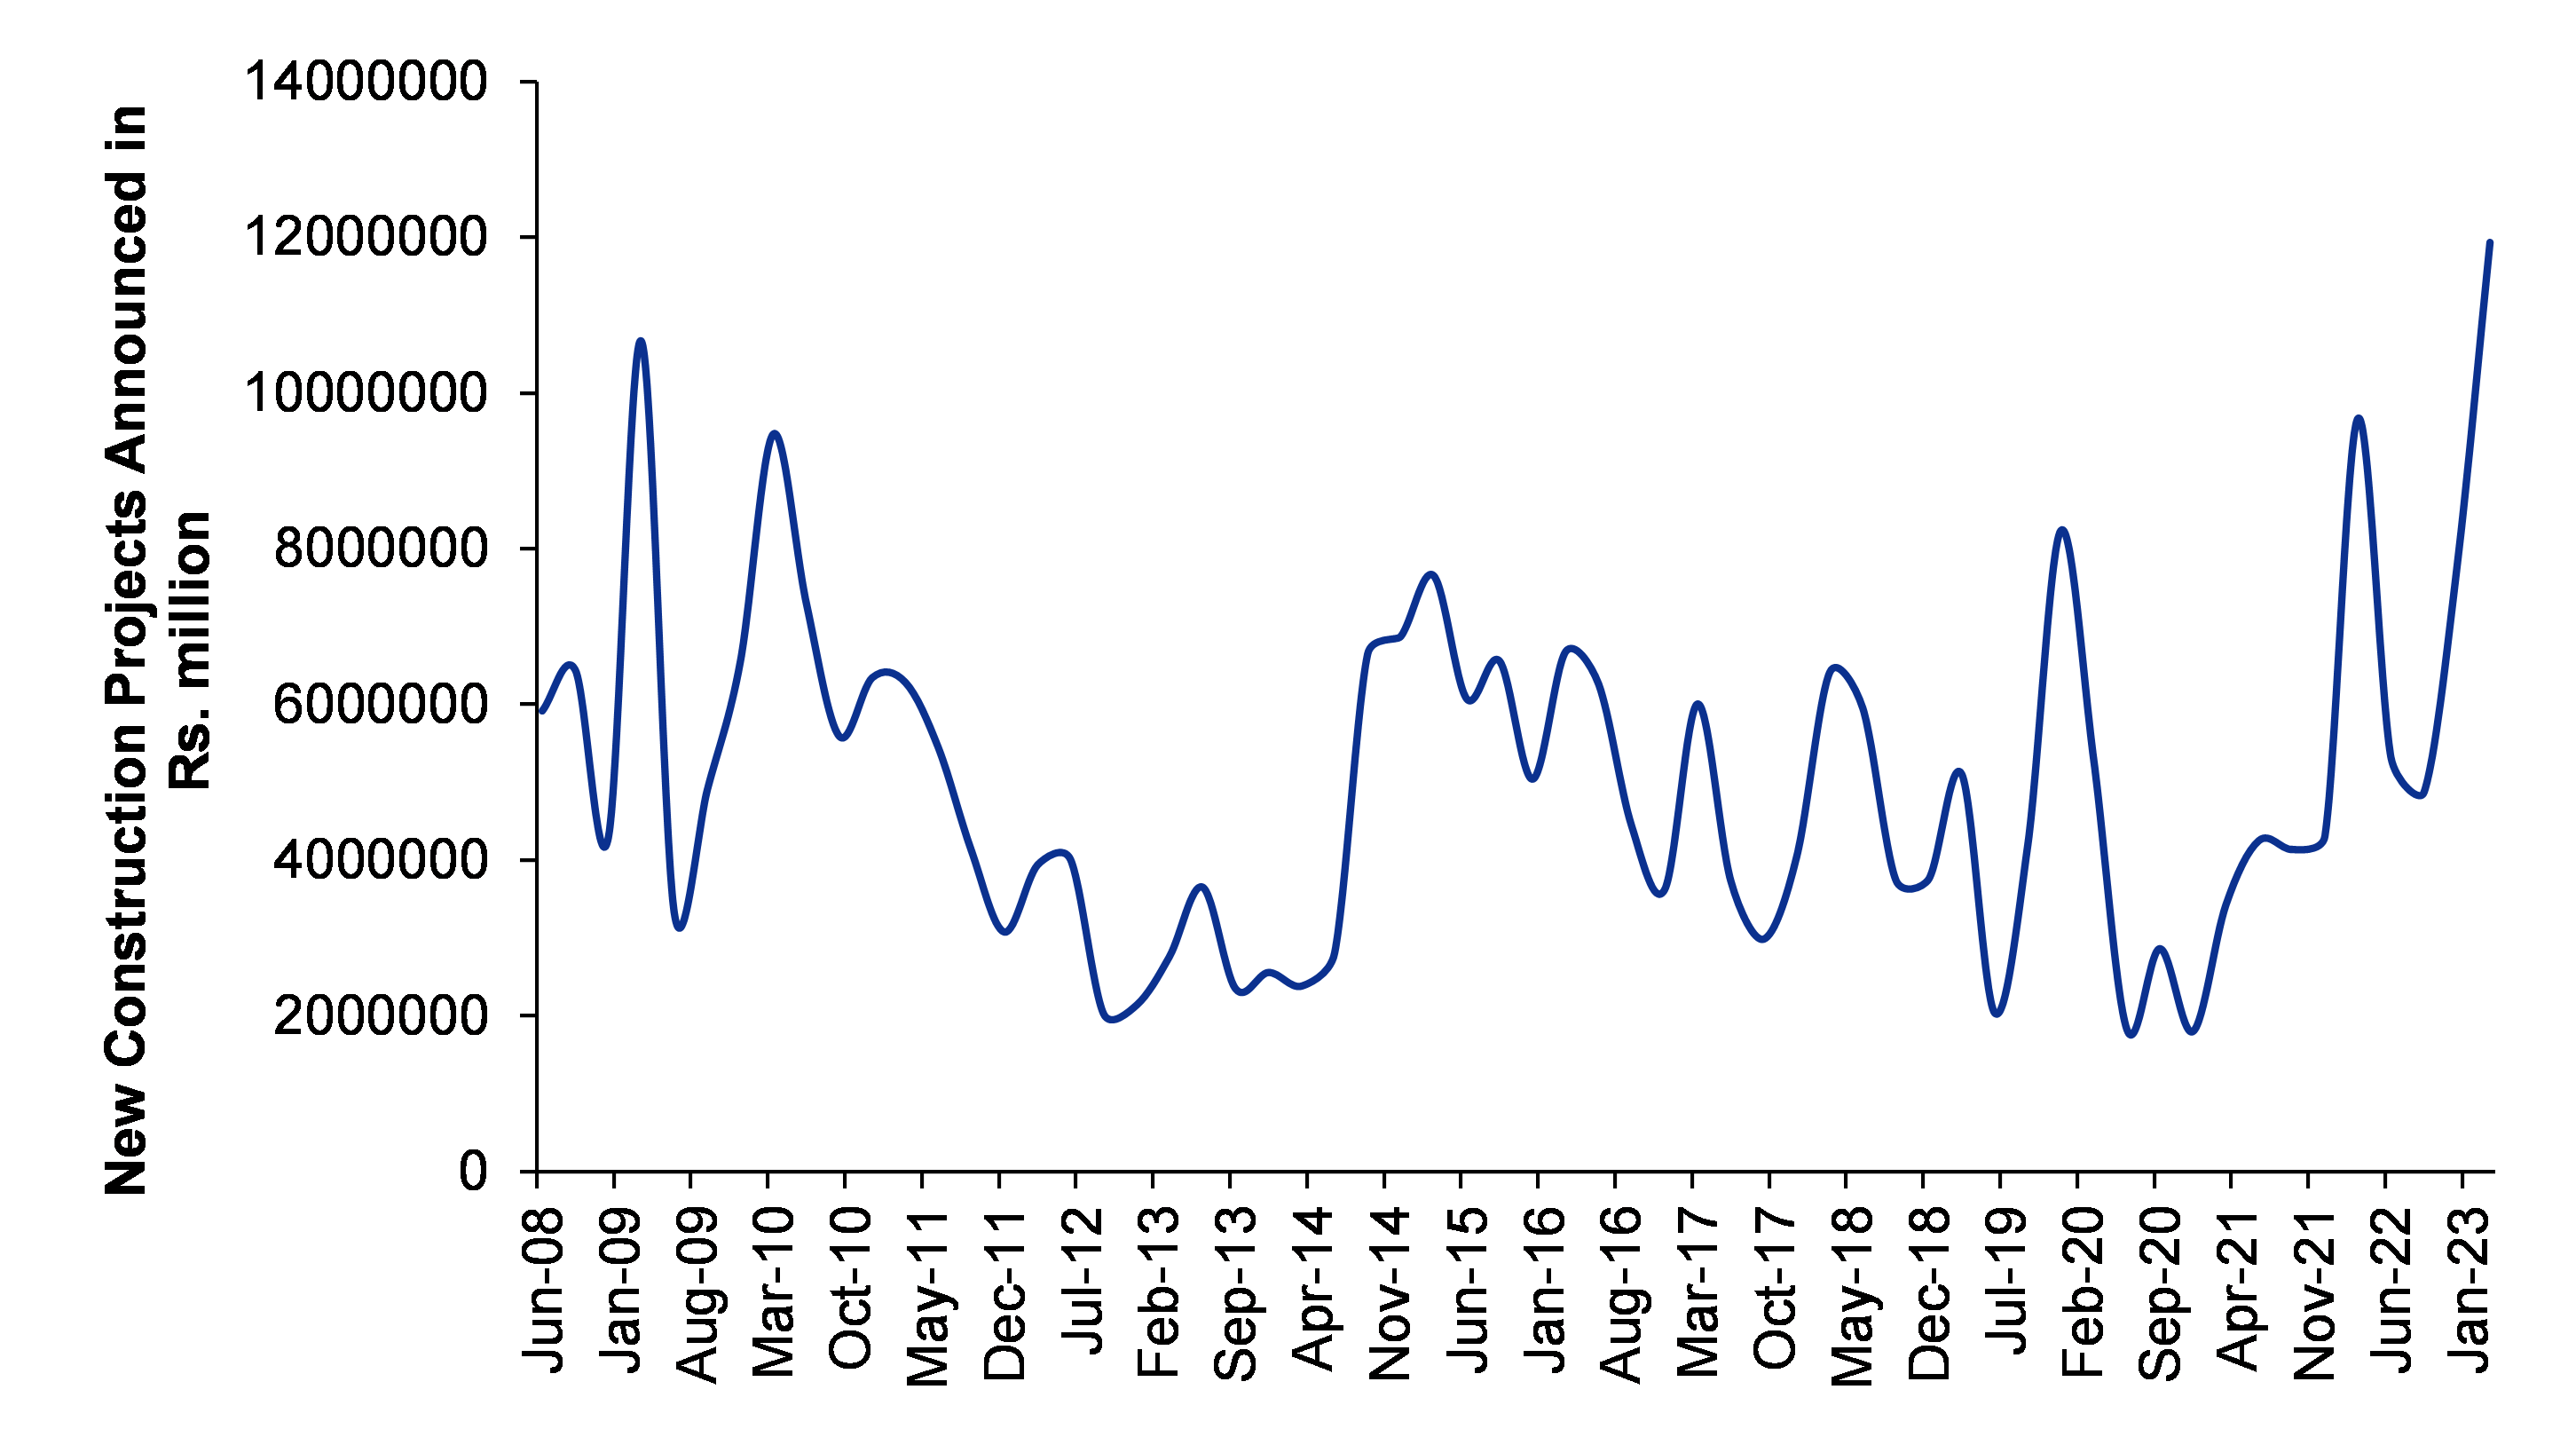
We calculated the inventory based on this formula: monthly production + monthly imports - monthly exports - monthly consumption.  As we can see from the graph above, steel companies have been continuously adding inventory. As and when this inventory decreases, green shoots will start emerging as far as the Indian graphite industry is concerned. Are there any triggers which predict this decrease in inventory? Not, in the near term, at least. New construction projects could boost consumption, but signs of it are tell-tale as of now.

Figure 50: New construction projects announced are at an all-time high

SOURCE: INCRED RESEARCH, COMPANY REPORTS  


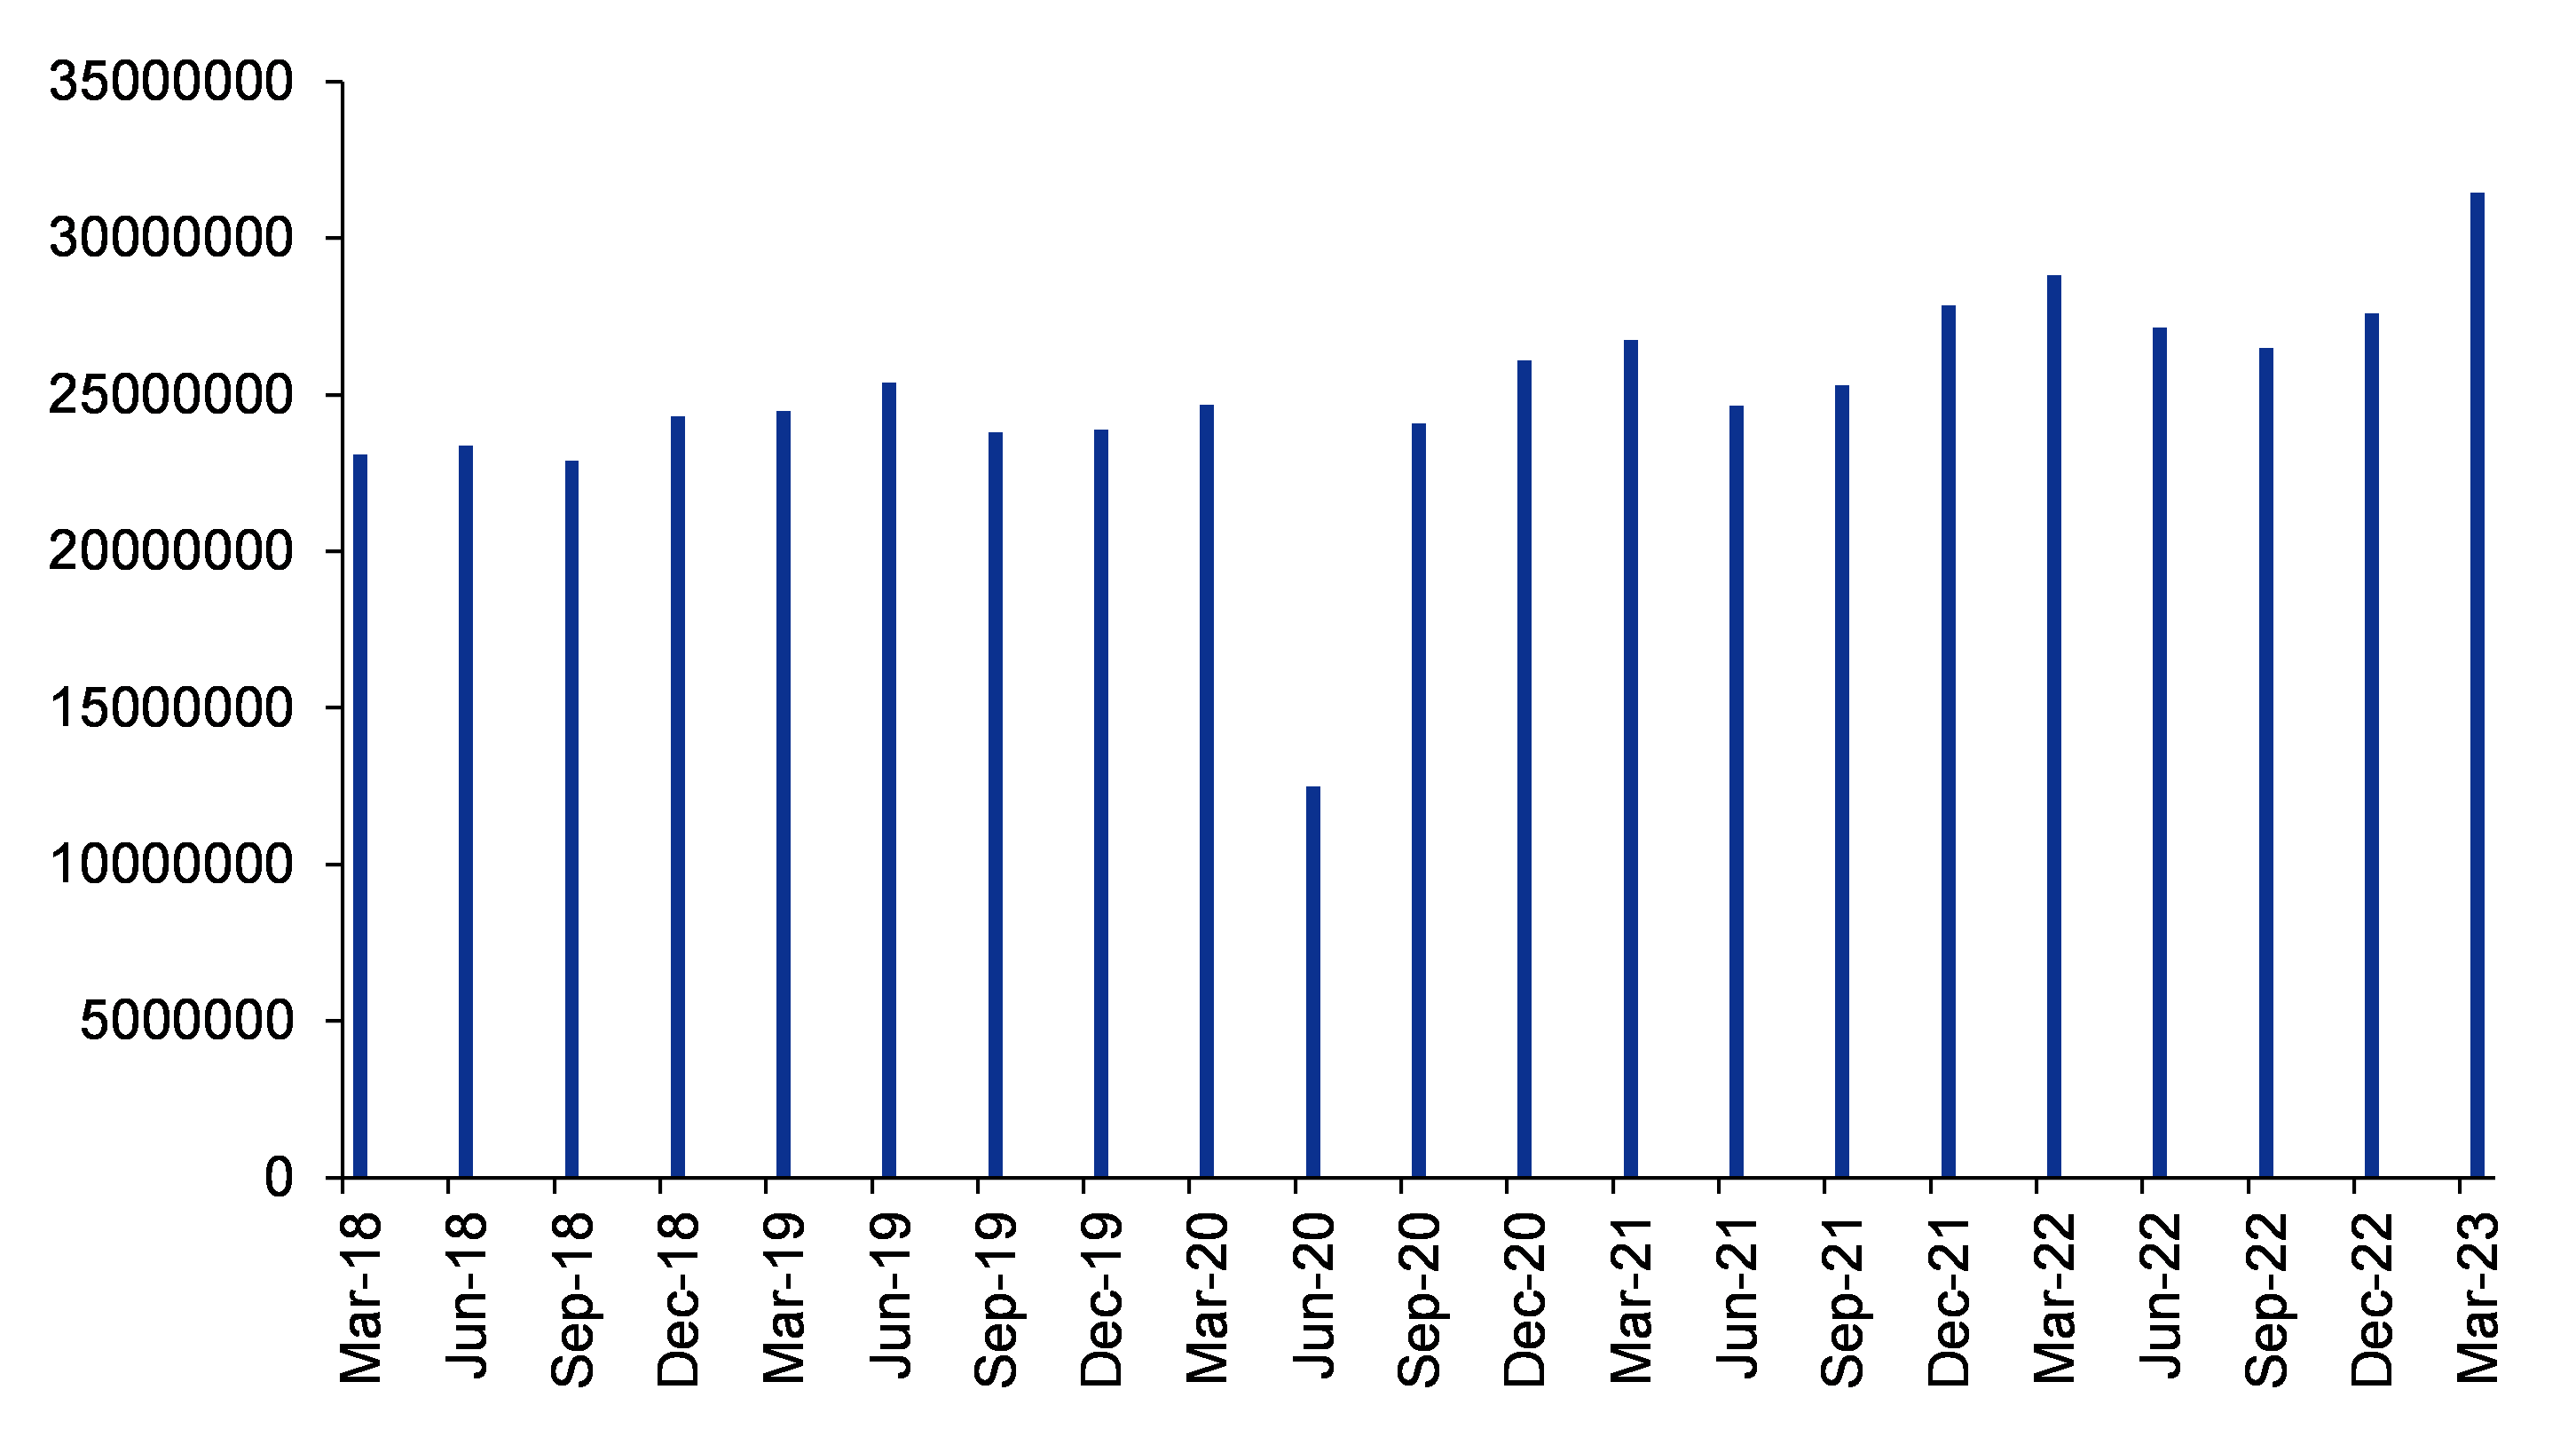
Figure 51: Quarterly steel volume (in mt) was the highest during Jan-Mar 2023 quarter

SOURCE: INCRED RESEARCH, COMPANY REPORTS  


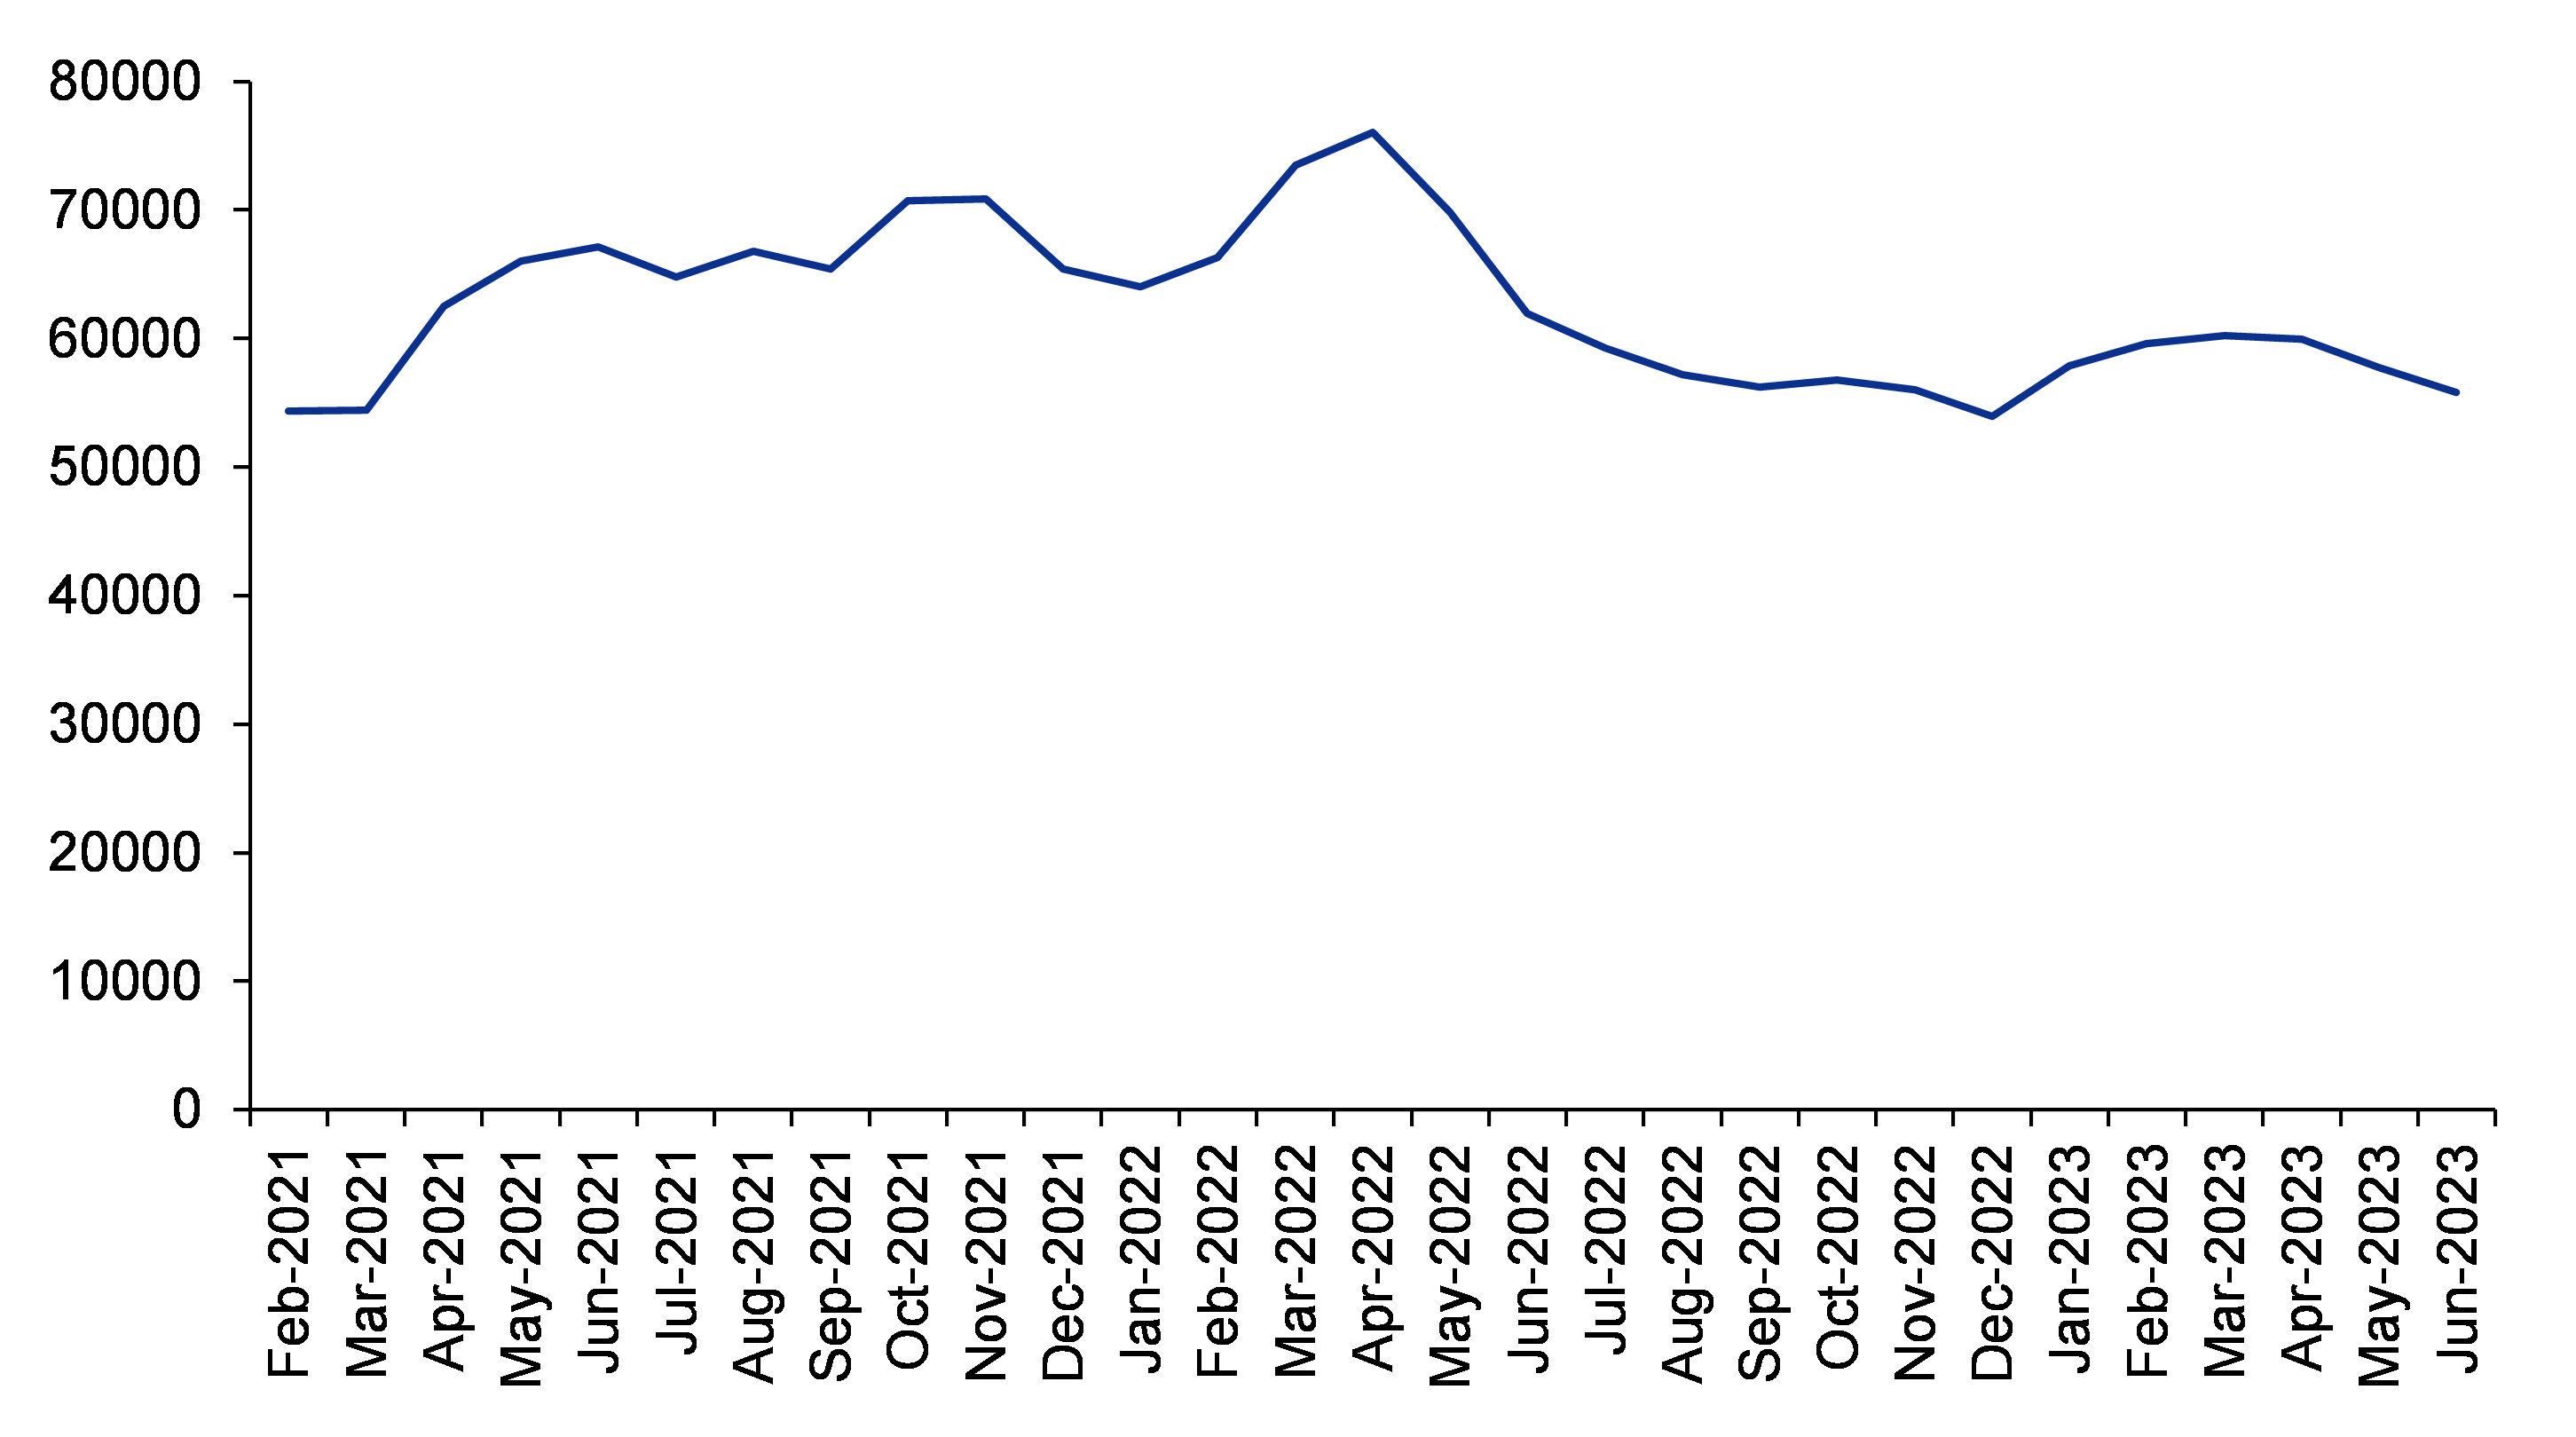
Figure 52: Pricing pressure in hot rolled coil or HRC after the Jan-Mar 2023 quarter was mainly because of subdued demand

SOURCE: INCRED RESEARCH, COMPANY REPORTS  


BY THE NUMBERS

Profit & Loss
(Rs mn) Mar-22A Mar-23A Mar-24F Mar-25F Mar-26F
Total Net Revenues 22,016 24,672 21,036 29,442 34,914
Gross Profit 13,726 15,521 13,674 20,021 23,742
Operating EBITDA 7,515 6,197 7,363 11,188 13,267
Depreciation And Amortisation (793) (1,023) (1,456) (2,013) (2,185)
Operating EBIT 6,723 5,174 5,907 9,175 11,083
Financial Income/(Expense) (75) (260) (75) (75) (75)
Pretax Income/(Loss) from Assoc.
Non-Operating Income/(Expense)
Profit Before Tax (pre-EI) 6,648 4,914 5,832 9,100 11,008
Exceptional Items
Pre-tax Profit 6,648 4,914 5,832 9,100 11,008
Taxation (1,294) (1,450) (1,657) (2,474) (2,951)
Exceptional Income - post-tax
Profit After Tax 5,354 3,464 4,175 6,626 8,057
Minority Interests
Preferred Dividends
FX Gain/(Loss) - post tax
Other Adjustments - post-tax
Net Profit 5,354 3,464 4,175 6,626 8,057
Recurring Net Profit 5,354 3,464 4,175 6,626 8,057
Fully Diluted Recurring Net Profit 5,354 3,464 4,175 6,626 8,057
Cash Flow
(Rs mn) Mar-22A Mar-23A Mar-24F Mar-25F Mar-26F
EBITDA 7,515 6,197 7,363 11,188 13,267
Cash Flow from Invt. & Assoc.
Change In Working Capital (5,548) (3,899) 4,266 (3,734) (2,931)
(Incr)/Decr in Total Provisions (3) (33) (3) (3) (3)
Other Non-Cash (Income)/Expense (290) (193) 319 319 319
Other Operating Cashflow
Net Interest (Paid)/Received (399) (768) (88) (88) (88)
Tax Paid (1,282) (1,480) (1,657) (2,474) (2,951)
Cashflow From Operations (7) (177) 10,200 5,209 7,614
Capex (3,595) (4,797) (200) (200) (200)
Disposals Of FAs/subsidiaries 9 9 9 9 9
Acq. Of Subsidiaries/investments 2,612 4,009 (442) (442) (2,156)
Other Investing Cashflow (859) 568 (862) (862) (862)
Cash Flow From Investing (1,834) (211) (1,496) (1,496) (3,210)
Debt Raised/(repaid) 3,663 775 (3,663) (3,663) (3,663)
Proceeds From Issue Of Shares
Shares Repurchased
Dividends Paid (121) (1,538) (1,199) (1,199) (1,199)
Preferred Dividends
Other Financing Cashflow (106) (236) (106) (106) (106)
Cash Flow From Financing 3,436 (1,000) (4,969) (4,969) (4,969)
Total Cash Generated 1,596 (1,387) 3,736 (1,255) (565)
Free Cashflow To Equity 1,823 387 5,041 50 741
Free Cashflow To Firm (1,765) (128) 8,780 3,788 4,479

BY THE NUMBERS…cont’d

Balance Sheet
(Rs mn) Mar-22A Mar-23A Mar-24F Mar-25F Mar-26F
Total Cash And Equivalents 6,017 6,904 5,622 11,684 20,139
Total Debtors 5,899 4,897 4,551 6,366 7,548
Inventories 9,778 14,401 9,778 9,778 9,778
Total Other Current Assets 8,376 2,323 7,879 8,376 8,376
Total Current Assets 30,070 28,525 27,830 36,205 45,841
Fixed Assets 7,484 13,482 18,202 25,163 27,308
Total Investments 3,727 7,428 7,431 7,431 7,431
Intangible Assets 1 3 1 1 1
Total Other Non-Current Assets 10,428 7,482 10,428 5,613 5,613
Total Non-current Assets 21,640 28,394 36,063 38,208 40,353
Short-term Debt 6,634 7,409 7,409 7,409 7,409
Current Portion of Long-Term Debt
Total Creditors 4,479 4,120 4,034 5,162 6,122
Other Current Liabilities 1,706 1,582 1,706 1,706 1,706
Total Current Liabilities 12,819 13,110 13,150 14,278 15,237
Total Long-term Debt
Hybrid Debt - Debt Component
Total Other Non-Current Liabilities 71 51 45 45 45
Total Non-current Liabilities 71 51 45 45 45
Total Provisions 1,053 949 949 949 949
Total Liabilities 13,943 14,110 14,144 15,272 16,231
Shareholders Equity 37,767 42,809 49,749 59,140 69,962
Minority Interests
Total Equity 37,767 42,809 49,749 59,140 69,962
Key Ratios
Mar-22A Mar-23A Mar-24F Mar-25F Mar-26F
Revenue Growth 75.3% 12.1% (14.7%) 40.0% 18.6%
Operating EBITDA Growth 737.0% (17.5%) 18.8% 52.0% 18.6%
Operating EBITDA Margin 34.1% 25.1% 35.0% 38.0% 38.0%
Net Cash Per Share (Rs) (17.84) (14.41) (47.45) 109.59 328.63
BVPS (Rs) 978.68 1,109.04 1,288.83 1,532.13 1,812.50
Gross Interest Cover 89.78 19.90 78.75 122.33 147.77
Effective Tax Rate 19.5% 29.5% 28.4% 27.2% 26.8%
Net Dividend Payout Ratio 2.3% 44.4% 28.7% 18.1% 14.9%
Accounts Receivables Days 72.83 79.76 81.85 67.58 72.65
Inventory Days 343.07 482.21 599.33 378.81 319.44
Accounts Payables Days 155.24 171.48 202.11 178.15 184.33
ROIC (%) 14.1% 10.5% 9.8% 14.2% 16.3%
ROCE (%) 16.1% 10.7% 10.8% 14.6% 15.2%
Return On Average Assets 11.6% 6.7% 7.0% 9.7% 10.1%
Key Drivers
Mar-22A Mar-23A Mar-24F Mar-25F Mar-26F
Outstanding Orderbook N/A N/A N/A N/A N/A
Order Book Depletion N/A N/A N/A N/A N/A
Orderbook Replenishment N/A N/A N/A N/A N/A
ASP (% chg, main prod./serv.) N/A N/A N/A N/A N/A
Unit sales grth (%, main prod./serv.) N/A N/A N/A N/A N/A
Util. rate (%, main prod./serv.) N/A N/A N/A N/A N/A
ASP (% chg, 2ndary prod./serv.) N/A N/A N/A N/A N/A
Unit sales grth (%,2ndary prod/serv) N/A N/A N/A N/A N/A
Util. rate (%, 2ndary prod/serv) N/A N/A N/A N/A N/A
SOURCES: EIP RESEARCH, COMPANY REPORTS

DISCLAIMER

This report (including the views and opinions expressed therein, and the information comprised therein) has been prepared by Incred Research Services Private Ltd.(formerly known as Earnest Innovation Partners Private Limited) (hereinafter referred to as “ IRSPL”). IRSPL is registered with SEBI as a Research Analyst vide Registration No. INH000007793. Pursuant to a trademark agreement, IRSPL has adopted “Incred Equities ” as its trademark for use in this report.

The term “IRSPL” shall, unless the context otherwise requires, mean IRSPL and its affiliates, subsidiaries and related companies. This report is not directed or intended for distribution to or use by any person or entity resident in a state, country or any jurisdiction, where such distribution, publication, availability or use would be contrary to law, regulation or which would subject IRSPL and its affiliates/group companies to registration or licensing requirements within such jurisdictions.

This report is being supplied to you strictly on the basis that it will remain confidential. No part of this report may be (i) copied, photocopied, duplicated, stored or reproduced in any form by any means; or (ii) redistributed or passed on, directly or indirectly, to any other person in whole or in part, for any purpose without the prior written consent of IRSPL.

The information contained in this report is prepared from data believed to be correct and reliable at the time of issue of this report.

IRSPL is not required to issue regular reports on the subject matter of this report at any frequency and it may cease to do so or change the periodicity of reports at any time. IRSPL is not under any obligation to update this report in the event of a material change to the information contained in this report. IRSPL has not any and will not accept any, obligation to (i) check or ensure that the contents of this report remain current, reliable or relevant; (ii) ensure that the content of this report constitutes all the information a prospective investor may require; (iii) ensure the adequacy, accuracy, completeness, reliability or fairness of any views, opinions and information, and accordingly, IRSPL and its affiliates/group companies (and their respective directors, associates, connected persons and/or employees) shall not be liable in any manner whatsoever for any consequences (including but not limited to any direct, indirect or consequential losses, loss of profits and damages) of any reliance thereon or usage thereof.

Unless otherwise specified, this report is based upon reasonable sources. Such sources will, unless otherwise specified, for market data, be market data and prices available from the main stock exchange or market where the relevant security is listed, or, where appropriate, any other market. Information on the accounts and business of company(ies) will generally be based on published statements of the company(ies), information disseminated by regulatory information services, other publicly available information and information resulting from our research. Whilst every effort is made to ensure that statements of facts made in this report are accurate, all estimates, projections, forecasts, expressions of opinion and other subjective judgments contained in this report are based on assumptions considered to be reasonable as of the date of the document in which they are contained and must not be construed as a representation that the matters referred to therein will occur. Past performance is not a reliable indicator of future performance. The value of investments may go down as well as up and those investing may, depending on the investments in question, lose more than the initial investment. No report shall constitute an offer or an invitation by or on behalf of IRSPL and its affiliates/group companies to any person to buy or sell any investments.

The opinions expressed are based on information which are believed to be accurate and complete and obtained through reliable public or other non-confidential sources at the time made. (Information barriers and other arrangements may be established where necessary to prevent conflicts of interests arising. However, the analyst(s) may receive compensation that is based on his/their coverage of company(ies) in the performance of his/their duties or the performance of his/their recommendations. In reviewing this report, an investor should be aware that any or all of the foregoing, among other things, may give rise to real or potential conflicts of interest. Additional information is, subject to the duties of confidentiality, available on request.

The report is not a “prospectus” as defined under Indian Law, including the Companies Act, 2013, and is not, and shall not be, approved by, or filed or registered with, any Indian regulator, including any Registrar of Companies in India, SEBI, any Indian stock exchange, or the Reserve Bank of India. No offer, or invitation to offer, or solicitation of subscription with respect to any such securities listed or proposed to be listed in India is being made, or intended to be made, to the public, or to any member or section of the public in India, through or pursuant to this report.

The research analysts, strategists or economists principally responsible for the preparation of this research report are segregated from the other activities of IRSPL. Information barriers and other arrangements have been established, as required, to prevent any conflicts of interests.

The research analysts, strategists or economists principally responsible for the preparation of this research report are segregated from the other activities of IRSPL. Information barriers and other arrangements have been established, as required, to prevent any conflicts of interests.

IRSPL may have issued other reports (based on technical analysis, event specific, short term views etc.) that are inconsistent with and reach different conclusion from the information presented in this report.

Holding of Analysts/Relatives of Analysts, IRSPL and Associates of IRSPL in the covered securities, as on the date of publishing of this report

Analyst/ Relative Entity/ Associates
any financial interests in the company covered in this report (subject company) and nature of such financial interest NO NO
actual/beneficial ownership of 1% or more in securities of the subject company at the end of the month immediately preceding the date of publication of the research report or date of the public appearance; NO NO
any other material conflict of interest at the time of publication of the research report or at the time of public appearance NO NO
received any compensation from the subject company in the past twelve months for investment banking or merchant banking or brokerage services or investment advisory or depository or distribution from the subject company in the last twelve months for products/services other than investment banking or merchant banking or broker- age services or investment advisory or depository or distribution from the subject company in the last twelve months NO NO
managed or co-managed public offering of securities for the subject company in the last twelve months NO NO
received any compensation or other benefits from the subject company or third party in connection with the research report NO NO
served as an officer, director or employee of the subject company NO NO
been engaged in market making activity for the subject company NO NO
Analyst declaration
  • The analyst responsible for the production of this report hereby certifies that the views expressed herein accurately and exclusively reflect his or her personal views and opinions about any and all of the issuers or securities analysed in this report and were prepared independently and autonomously in an unbiased manner.
  • No part of the compensation of the analyst(s) was, is, or will be directly or indirectly related to the inclusion of specific recommendations(s) or view(s) in this report or based any specific investment banking transaction.
  • The analyst(s) has(have) not had any serious disciplinary action taken against him/her(them). • The analyst, strategist, or economist does not have any material conflict of interest at the time of
  • publication of this report.
  • The analyst(s) has(have) received compensation based upon various factors, including quality, accuracy and value of research, overall firm performance, client feedback and competitive factors.

IRSPL and/or its affiliates and/or its Directors/employees may own or have positions in securities of the company(ies) covered in this report or any securities related thereto and may from time to time add to or dispose of, or may be materially interested in, any such securities.

IRSPL and/or its affiliates and/or its Directors/employees may do and seek to do business with the company(ies) covered in this research report and may from time to time (a) buy/sell the securities covered in this report, from time to time and/or (b) act as market maker or have assumed an underwriting commitment in securities of such company(ies), and/or (c) may sell them to or buy them from customers on a principal basis and/or (d) may also perform or seek to perform significant investment banking, advisory, underwriting or placement services for or relating to such company(ies) and/or (e) solicit such investment, advisory or other services from any entity mentioned in thisreport and/or (f) act as a lender/borrower to such company and may earn brokerage or other compensation. However, Analysts are forbidden to acquire, on their own account or hold securities (physical or uncertificated, including derivatives) of companies in respect of which they are compiling and producing financial recommendations or in the result of which they play a key part.