India

Neutral (no change)

Highlighted Companies

Gujarat Gas
ADD, TP Rs679, Rs465 close

The government’s new gas blending policy will reduce the margins of CGD companies.


Indraprastha Gas
ADD, TP Rs539, Rs473 close

The government’s new gas blending policy will reduce the margins of CGD companies.


Mahanagar Gas
ADD, TP Rs1252, Rs1049 close

The government’s new gas blending policy will reduce the margins of CGD companies.


Summary Valuation Metrics

P/E (x) Mar22-A Mar23-A Mar24-F
Gujarat Gas 24.87 20.95 18.13
Indraprastha Gas 22.06 20.57 15.46
Mahanagar Gas 17.35 13.11 10.47
P/BV (x) Mar22-F Mar23-F Mar24-F
Gujarat Gas 5.69 4.56 3.7
Indraprastha Gas 4.37 4.18 3.37
Mahanagar Gas 2.88 2.51 2.02
Dividend Yield Mar22-F Mar23-F Mar24-F
Gujarat Gas 0.43% 0.43% 0.43%
Indraprastha Gas 0.76% 0.76% 0.76%
Mahanagar Gas 3.15% 0.95% 0.95%
Analyst(s)

Jignyasu CHASMAWALA

T (022) 22 4161 0000
E jignyasu.chasmawala@incredcapital.com

Abbas PUNJANI

T (91) 22 4161 1598
E abbas.punjani@incredcapital.com

Biofuel Expo & Conference 2023 highlights

Ethanol plants, especially standalone ones, face considerable difficulty in eking out a profit.

Biogas has the potential to substitute imported liquefied natural gas or LNG.

Biodiesel is an unloved industry which will gain more importance once green audits begin.

Biofuel expo and conference details

The conference was a part of the Biofuel Expo 2023 held at Pragati Maidan in New Delhi from 5-7 Jun 2023. The speakers at the conference included several biofuel plant manufacturers and consultants including Universal Forces Industries, Solution Buggy and independent consultants. The Biodiesel Manufacturers Association of India was also among the panelists. The list of participants included representatives of companies like Mitsubishi, Samsung Construction, Shell Overseas Investment, Megha Gas (part of the MEIL Group) as well as owners of several independent MSMEs who would like to enter the biofuel industry. Many participants were keen on discussing biofuels and their learnings after the conference as well.

Sugarcane-based ethanol plants don’t have much scope

The industry believes that new sugarcane-based ethanol plants don’t have much scope and the focus is instead on grain-based ethanol plants which meet Zero Liquid Discharge norms. Many ethanol plants aren’t adequately profitable as ethanol sales are only enough to cover their costs. The market for Dried Distillers Grain Solids (DDGS) is not well established.

Biogas generation potential is significant

As stated in our earlier report, Biogas: Energy freedom, social development, India’s biogas generation potential is very significant. With the government pushing for biogas production under the Sustainable Alternative Towards Affordable Transportation (SATAT) scheme, many Letters of Intent (LoIs) have been signed with city gas distribution or CGD companies. While it may look like biogas will replace the administered price mechanism or APM gas, it's unlikely as APM gas is much cheaper than biogas currently. Instead, imported liquefied natural gas or LNG is most likely to be replaced by biogas.

Biodiesel plant seen more profitable compared to biogas plant

A biodiesel plant can be much more profitable than a biogas plant. But due to lack of attention from the government, this industry faces quite a few challenges. However, exhibitors believe that as green audits begin, several hard-to-abate industries like mining, trucking, etc. will be forced to decarbonize by shifting to biodiesel as other alternatives would be far more costly and require considerable capital expenditure. 

Biomass briquettes gain prominence

This is a highly regionalized and seasonal industry that is gaining prominence due to favorable government policies and the fact that it can keep burner fuel costs steady.

Biofuel-wise views expressed at the conference

Ethanol

As many as 600 ethanol plants have been approved, but these wouldn’t be enough to meet demand. Besides, around 400 of the 600 approved plants haven’t started operations so far.

People are no longer bullish on ethanol manufactured from sugarcane. While there is some interest in grain-to-ethanol plants due to a large quantity of the grain being sold from government warehouses, many people remain concerned about the quality of grain from these warehouses.

Other opportunities in ethanol

Biorefineries are interested in making value-added products like chemicals from ethanol. These products include glycols, 2-(4-chlorophenylthio)triethylamine hydrochloride (CPTA), etc.

Possible shift in supply of ethanol

As the chemical industry provides a premium for ethanol, several participants at the conference showed an interest in setting up plants to make ethanol for supply to the chemical sector instead of oil marketing companies or OMCs.

Their main concern was the fact that the chemical industry is unlikely to give a fixed price for their ethanol and would instead give them the market rate. However, it’s possible that they could simply supply to the chemical industry when international prices are higher and sell to OMCs when this is not the case.

Key challenges for the industry

As the revenue from ethanol sales for meeting fuel requirements are only adequate to cover the cost of running the plant, there is considerable talk about using the by-products like DDGS and waste products like press mud to generate further revenue, which would be able to generate a profit margin.

Old challenges have been rectified

Previously, grains stored in government warehouses were quite dirty and had pebbles, etc. in them. As a result, they couldn’t be used directly in an ethanol plant and instead had to be cleaned and pre-processed, which considerably raised costs. This problem has now been fixed.

Zero Liquid Discharge norms push ethanol plants towards biogas

The Zero Liquid Discharge pollution norms also push the plant-owners to utilize waste products and effluents better. Biogas plants can utilize press mud and spent wash as feedstock. Hence, an integrated plant is a natural fit.

Napier grass as boiler fuel

This is an interesting innovation mentioned by a consultant who’s building ethanol plants for Nayara Energy. Napier grass can be grown nearby and used as boiler fuel.

Figure 1: Napier grass vs. coal as boiler fuel

Calorific value (MJ/kg)

Rs/kg

Rs/MJ

Napier

18.32

1

0.05

Coal

25

10

0.40


SOURCE: HTTPS://WWW.RESEARCHGATE.NET/FIGURE/HEATING-VALUE-PROXIMATE-ANALYSIS-AND-ULTIMATE-ANALYSIS-OF-NAPIER-GRASS-IN-COMPARISON_TBL1_353846620, GOOGLE, INCRED RESEARCH, COMPANY REPORTS

While there may be some cost involved in switching from a coal burner to a grass burner, the boiler fuel cost could be reduced by 87.5%. This would certainly make it a very viable option.

Minimum capacity of spent wash biogas plants and extra revenue generation

As compressed biogas plants (CBGs) receive significant subsidy from the government under the SATAT scheme, there is considerable interest in setting up these plants. The minimum viable capacity for a CBG plant in such a setup is around 5t per day (tpd) of refined biogas output. This correlates to a 100klpd ethanol plant.

A 5tpd compressed biogas plant can generate a revenue of Rs81m from compressed biogas sales and another Rs7.5m from organic fertilizer sales. Assuming an ethanol price of around Rs50/L, this can represent another 6% gain on a base of Rs1.50bn from ethanol sales.

Green hydrogen

Views on green hydrogen at the conference

Green hydrogen production is seen as out of reach for most micro, small and medium enterprises or MSMEs. It will primarily be driven by steel companies so as to meet Europe’s green steel requirement.

Biogas

Subsidies for CBG are driving considerable interest

Here, the focus has largely been on compressed biogas plants (CBGs) primarily due to an array of incentives and subsidies that the government has announced for these plants. For context, CBG can replace compressed natural gas (CNG) usage. This is why the main buyers of CBG are OMCs like Bharat Petroleum Corporation or BPCL, Hindustan Petroleum Corporation or HPCL, etc.

CBG can decentralize the gas grid

OMCs, especially HPCL, also inform the biogas plant developer about the offtake of CNG in that location. They suggest that the developer shouldn’t overbuild the CBG plant capacity. Through this, they hope to minimize the amount of gas that must be transported, thus creating a more decentralized gas grid.

Figure 2: CNG prices across Indian cities (Rs/kg)

City

Price (Rs)

Hyderabad

96.0

Vijayawada

94.0

Delhi

73.6

Gurgaon

82.6

Ahmedabad

73.3

Gandhinagar

72.3

Vadodara

73.0

Faridabad

79.3

Mangalore

84.0

Gwalior

93.5

Indore

92.5

Ujjain

92.5

Dhule

67.9

Mumbai

79.0

nagpur

115.0

Nashik

67.9

Navi Mumbai

79.0

Pimpri

88.0

Pune

88.0

Thane

79.0

Amritsar

87.6

Ajmer

84.4

Kota

89.4

Agra

94.0

Firozabad

50.0

Ghaziabad

77.2

Greater Noida

77.2

Kanpur

84.4

Lucknow

94.0

Meerut

81.6

Noida

77.2

Unnao

94.0


SOURCE: GOOGLE, INCRED RESEARCH, COMPANY REPORTS

As the above table indicates, CNG prices vary considerably even across cities in the same state. This may primarily be due to the cost of transporting the gas.

Napier grass for biogas

Napier grass/elephant grass is considered as high-energy grass and is conventionally used as a cattle feed. It has several positive characteristics which make it very suitable as a feedstock for biogas.

Very hardy crop. It grows to be 10 feet tall and can tolerate floods easily. Its ideal temperature range is 25-40oC. However, it stops growing below a temperature of 15oC.

It can be cut multiple times a year. For biogas production, it should ideally be cut every two months.

It has an excellent yield of 150-300t/acre/year, depending on how fertile and water-rich the soil is.

Cost of production of napier-based biogas

Figure 3: Cost of CBG production from napier grass

Units

Capacity

5

t/day

Capital cost

120

Rs m

Equity share

30

Rs m

Days of operation

330

Subsidy

52

Rs m

Interest rate

0

Loan tenure

10

yrs

Annual capital cost

13

Rs m

Daily raw material consumption

75

Daily costs

Raw material @Rs 800/kg

60,000

Manpower

9,333

Electricity

40,105

Maintenance

6,575

Transportation

10,000

Consumables & monitoring

27,500

Total daily cost

0.2

Rs m

Production cost

30.7

OMC's present buying price

64.0

Annual revenue

105.6

Rs m

Opex

50.7

Rs m

Capex

13.1

Rs m

PBT

41.8

Rs m

PAT @25.2% tax

31.3

Rs m


SOURCE: GOOGLE, INCRED RESEARCH, COMPANY REPORTS

A 5tpd plant is the smallest capacity plant that needs to be set up to obtain subsidy under SATAT. This subsidy is available only after the plant starts operations.

In this cost model, we assume that napier grass is bought commercially at a price of Rs800/kg and the priority sector loan is also utilized to the maximum extent. As we can see, the production cost of biogas is quite low, at about Rs30.7/kg. This could be further reduced if napier grass is grown for captive consumption.

Financials

Figure 4: Return metrics and cash flow schedule of CBG plant

Return metrics

ROE

104%

ROCE

46%

Financials in Rs m

Year 1

Year 2

Year 3

Year 4

Year 5

-120.0

83.4

31.3

31.3

31.3

 %age paid back

69%

96%

IRR (with subsidy)

22%

Payback period in months (with subsidy)

26


SOURCE: GOOGLE, INCRED RESEARCH, COMPANY REPORTS

The above table shows the return metrics and cashflow schedule of a 5tpd napier-to-CBG plant.

CBGs’ impact on CGD companies’ margins

Currently, most gas for CGD companies comes from domestic production of natural gas.

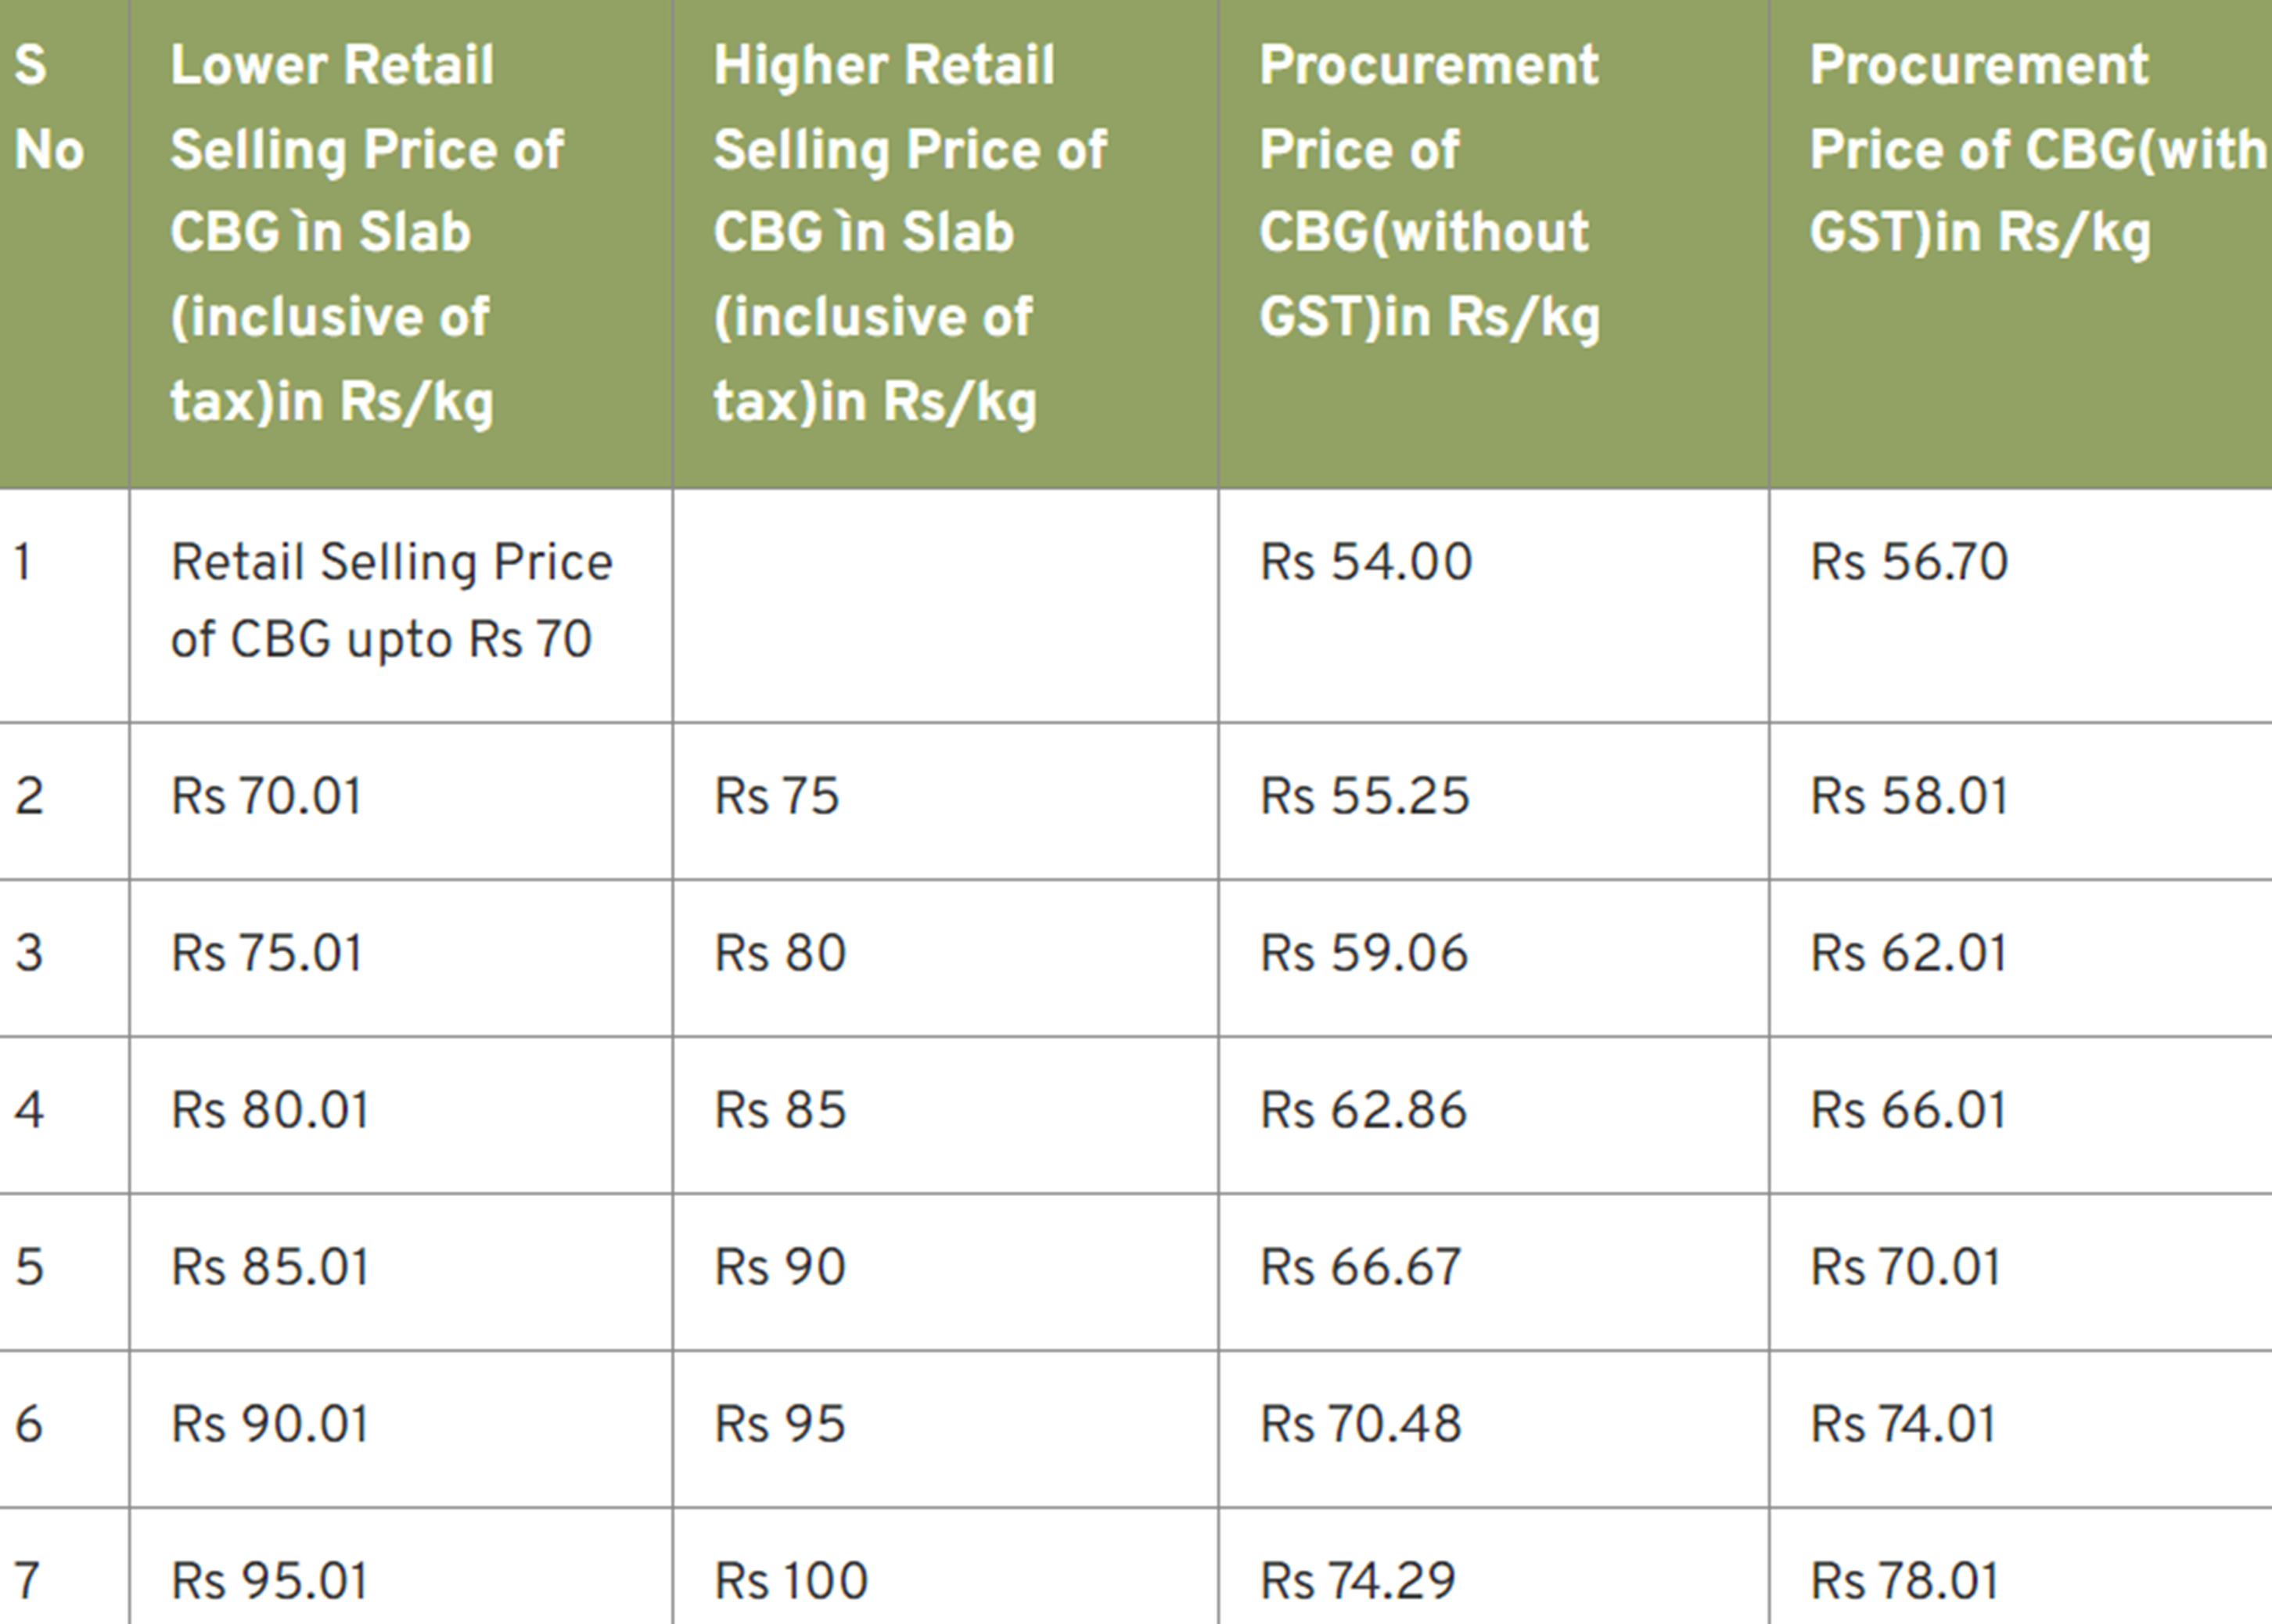
The procurement prices of CBG for an OMC is set at 80% of the local retail price for CNG. The floor price is Rs54/kg. There also appears to be a cap at Rs74.29/kg for CBG. This corresponds to a CNG price of Rs92.86/kg.

Figure 5: CBG procurement and retail prices

SOURCE: SATAT.CO.IN, INCRED RESEARCH, COMPANY REPORTS

The above table shows the slab-wise procurement and retail prices of CBG.

Figure 6: Gross margin from CBG for OMCs

Lower retail selling price of CBG ìn slab (inclusive of tax) in Rs/kg

Higher retail selling price of CBG ìn slab (inclusive of tax) in Rs/kg

Procurement price of CBG (w/o GST) in Rs/kg

Procurement price of CBG (with GST) in Rs/kg

Gross profit/kg after GST

Gross margin in %age terms

70.0

54.0

56.7

9.8

14.0%

70.0

75.0

55.3

58.0

11.0

15.2%

75.0

80.0

59.1

62.0

11.7

15.2%

80.0

85.0

62.9

66.0

12.5

15.1%

85.0

90.0

66.7

70.0

13.2

15.1%

90.0

95.0

70.5

74.0

14.0

15.1%

95.0

100.0

74.3

78.0

14.7

15.1%


SOURCE: SATAT.CO.IN, INCRED RESEARCH, COMPANY REPORTS

As we can see from the above table, OMCs make a gross margin of only around 14-15% from CBG.

Figure 7: Gross margin from CBG for OMCs

CBG procurement prices

USD-INR

APM price (USD)

APM price (Rs)

Regas cost

Net cost/mmBtu

Net cost/kg

5% Excise duty

14% Central VAT

14% State VAT

Total cost for natural gas

Retail price

GST on Natural gas @28%

Gross Profit/kg after GST

Gross margin %age

54.0

82.5

6.5

536.3

55.0

591.3

26.0

1.3

3.6

3.6

34.6

50.0

14.0

1.4

2.8%

54.0

82.5

6.5

536.3

56.0

592.3

26.1

1.3

3.7

3.7

34.7

55.0

15.4

5.0

9.0%

54.0

82.5

6.5

536.3

57.0

593.3

26.1

1.3

3.7

3.7

34.7

60.0

16.8

8.5

14.2%

54.0

82.5

6.5

536.3

58.0

594.3

26.1

1.3

3.7

3.7

34.8

67.5

18.9

13.8

20.5%

55.3

82.5

6.5

536.3

59.0

595.3

26.2

1.3

3.7

3.7

34.8

69.1

19.3

14.9

21.6%

59.1

82.5

6.5

536.3

60.0

596.3

26.2

1.3

3.7

3.7

34.9

73.8

20.7

18.3

24.8%

62.9

82.5

6.5

536.3

61.0

597.3

26.3

1.3

3.7

3.7

34.9

78.6

22.0

21.6

27.5%

66.7

82.5

6.5

536.3

62.0

598.3

26.3

1.3

3.7

3.7

35.0

83.3

23.3

25.0

30.0%

70.5

82.5

6.5

536.3

63.0

599.3

26.4

1.3

3.7

3.7

35.1

88.1

24.7

28.4

32.2%

74.3

82.5

6.5

536.3

64.0

600.3

26.4

1.3

3.7

3.7

35.1

92.9

26.0

31.7

34.2%


SOURCE: SATAT.CO.IN, INCRED RESEARCH, COMPANY REPORTS

As CBG procurement prices are a function of retail CNG price, it makes sense to compare gross profit from CBG and natural gas for a given retail price. Based on the table above, we can see that at a retail CNG price of Rs60/kg and below, it can become more profitable for a CGD company to sell biogas instead of natural gas. Also, as CBG boosts rural incomes, the government is more likely to keep CBG procurement prices high at the expense of OMCs’ profit margins.

This can lead to profit erosion for CGD companies who primarily use APM gas.

Government sets targets for CBG production

Under the SATAT initiative, from Sep 2019 to May 2023, only 16,271t of CBG have been sold to CGD companies. However, the government has set a target of 15mmt of annual CBG production by FY24F under the SATAT initiative. LoIs for 29,875tpd of CBG capacity have been signed as of May 2023-end.

Figure 8: CGD natural gas blending targets, consumption and CBG production needed for blending


FY23A

FY24F

FY25F

FY26F

FY27F

%age biogas for CGD

1%

3%

4%

4%

5%

CGD gas consumption (m mt)

9.3

10.2

11.3

12.5

13.7

Expected biogas consumption

0.1

0.3

0.4

0.5

0.7

Corresponding capacity of CBG needed

254.4

841.6

1,135.3

1,477.0

1,880.7


SOURCE: PPAC, INCRED RESEARCH, COMPANY REPORTS

The above table shows us the CBG blending targets and the CBG production capacity required to meet them.

Figure 9: Estimated CBG sales through LoIs

Units

Expected CBG production capacity against LOIs issued

29,875

t/day

%age of successful LOIs

50%

Number of working days for CBG plant

300

Annual production

4.48

t

expected production as proportion of 2025 blending target

1,459%

expected production as proportion of 2025 CGD consumption

43.77%

total CBG sale since sep '19 to May '23

16,271

t


SOURCE: PPAC, INCRED RESEARCH, COMPANY REPORTS

The table above shows how many LoIs have been issued by CGD companies and how much biogas production may be expected from these LoIs as a function of biogas consumption for CGD usage.

Figure 10: Govt targets for CBG production

Govt target for FY24 CBG production in tons

15

Govt target as proportion of CGD consumption in FY24

146%

Amount of extra gas in tons

4.8


SOURCE: PPAC, INCRED RESEARCH, COMPANY REPORTS

We can clearly see that as more and more CBG plants are set up, it would be very easy to obtain the entire gas for CGD consumption from CBG plants. In fact, there would be around 3.8mmt of CBG production leftover even after the CGD consumption requirement is met. This could then be sold for industrial purposes.

Other uses, broader impact of CBG

Given the current structure of retail and procurement prices of CBG, it is more expensive than APM gas (domestic CNG production). However, it can often be cheaper than imported LNG.

Figure 11: Likely usage of CBG

FY23A

FY24F

FY5F

FY26F

FY27F

%age LOI success rate

20%

40%

60%

80%

100%

Probable CBG production in million metric tons

1.8

3.6

5.4

7.2

9.0

%age biogas CGD blending minimum

1%

3%

4%

4%

5%

Expected biogas consumption for CGD

9.3

10.2

11.3

12.5

13.7

CGD as proportion of biogas production

518%

286%

210%

174%

153%

Imported LNG for fertilizer in Million metric tons

11.6

13.0

14.6

16.4

18.3

fertilizer as proportion of biogas production

649%

363%

272%

228%

205%

Imported LNG for petrochemical/refinery in MMT

2.6

2.2

1.8

1.5

1.2

refinery as proportion of biogas production

147%

60%

33%

20%

13%

Imported LNG for power

0.9

0.8

0.8

0.7

0.6

power as proportion of biogas production

52%

23%

14%

9%

7%


SOURCE: INCRED RESEARCH, COMPANY REPORTS

Thus, while CGDs may be required to buy and retail a certain amount of biogas, the primary usage of biogas will be in replacing imported LNG for industrial usage. The primary industrial usage of CNG is in ammonia production for nitrogenous fertilizers. Here, the cost of gas can be reduced by 30%. More importantly, natural gas prices are fluctuating and often quite seasonal owing to heating requirements in the northern hemisphere during winters. Thus, biogas can provide security of supply and ready availability too.

Currently, some innovative companies like Kajaria Ceramics are also using biogas to replace their imported LNG usage. On a blended basis, this helps to reduce their gas cost by approximately 10%. If they shift entirely to biogas, the gas cost can be reduced by 30%. This can improve margins by 2-7%, depending on natural gas prices, and also provide them with steady fuel cost.

Revy Environmental Solutions - unique product manufacturer to help boost biogas quality

As, traditionally, biogas plants in India were primarily at the farm scale, they utilized livestock and especially cattle manure. These biogas plants aren’t highly commercialized operations. In fact, due to inadequate optimization and improvement in technology, several biogas plants faced closure.

Several biochemical solutions are present to improve the quantity and quality of biogas generated. One of these is a nutrient formula pack by Revy Environmental Solutions which improves the methane content of biogas from 60% to 72% (claimed). In lab tests, Revy Environmental Solutions has found that the methane content can be boosted to 85%, and thus the 72% claimed methane content is a realistic number.

Boosting the methane content has some key benefits such as:

Higher CBG production.

Lower filtration and purification costs.

This increases the revenue while also reducing the opex and capex for a biogas plant as a smaller and hence, cheaper filtration and purification system is required.

Biodiesel

How is biodiesel made?

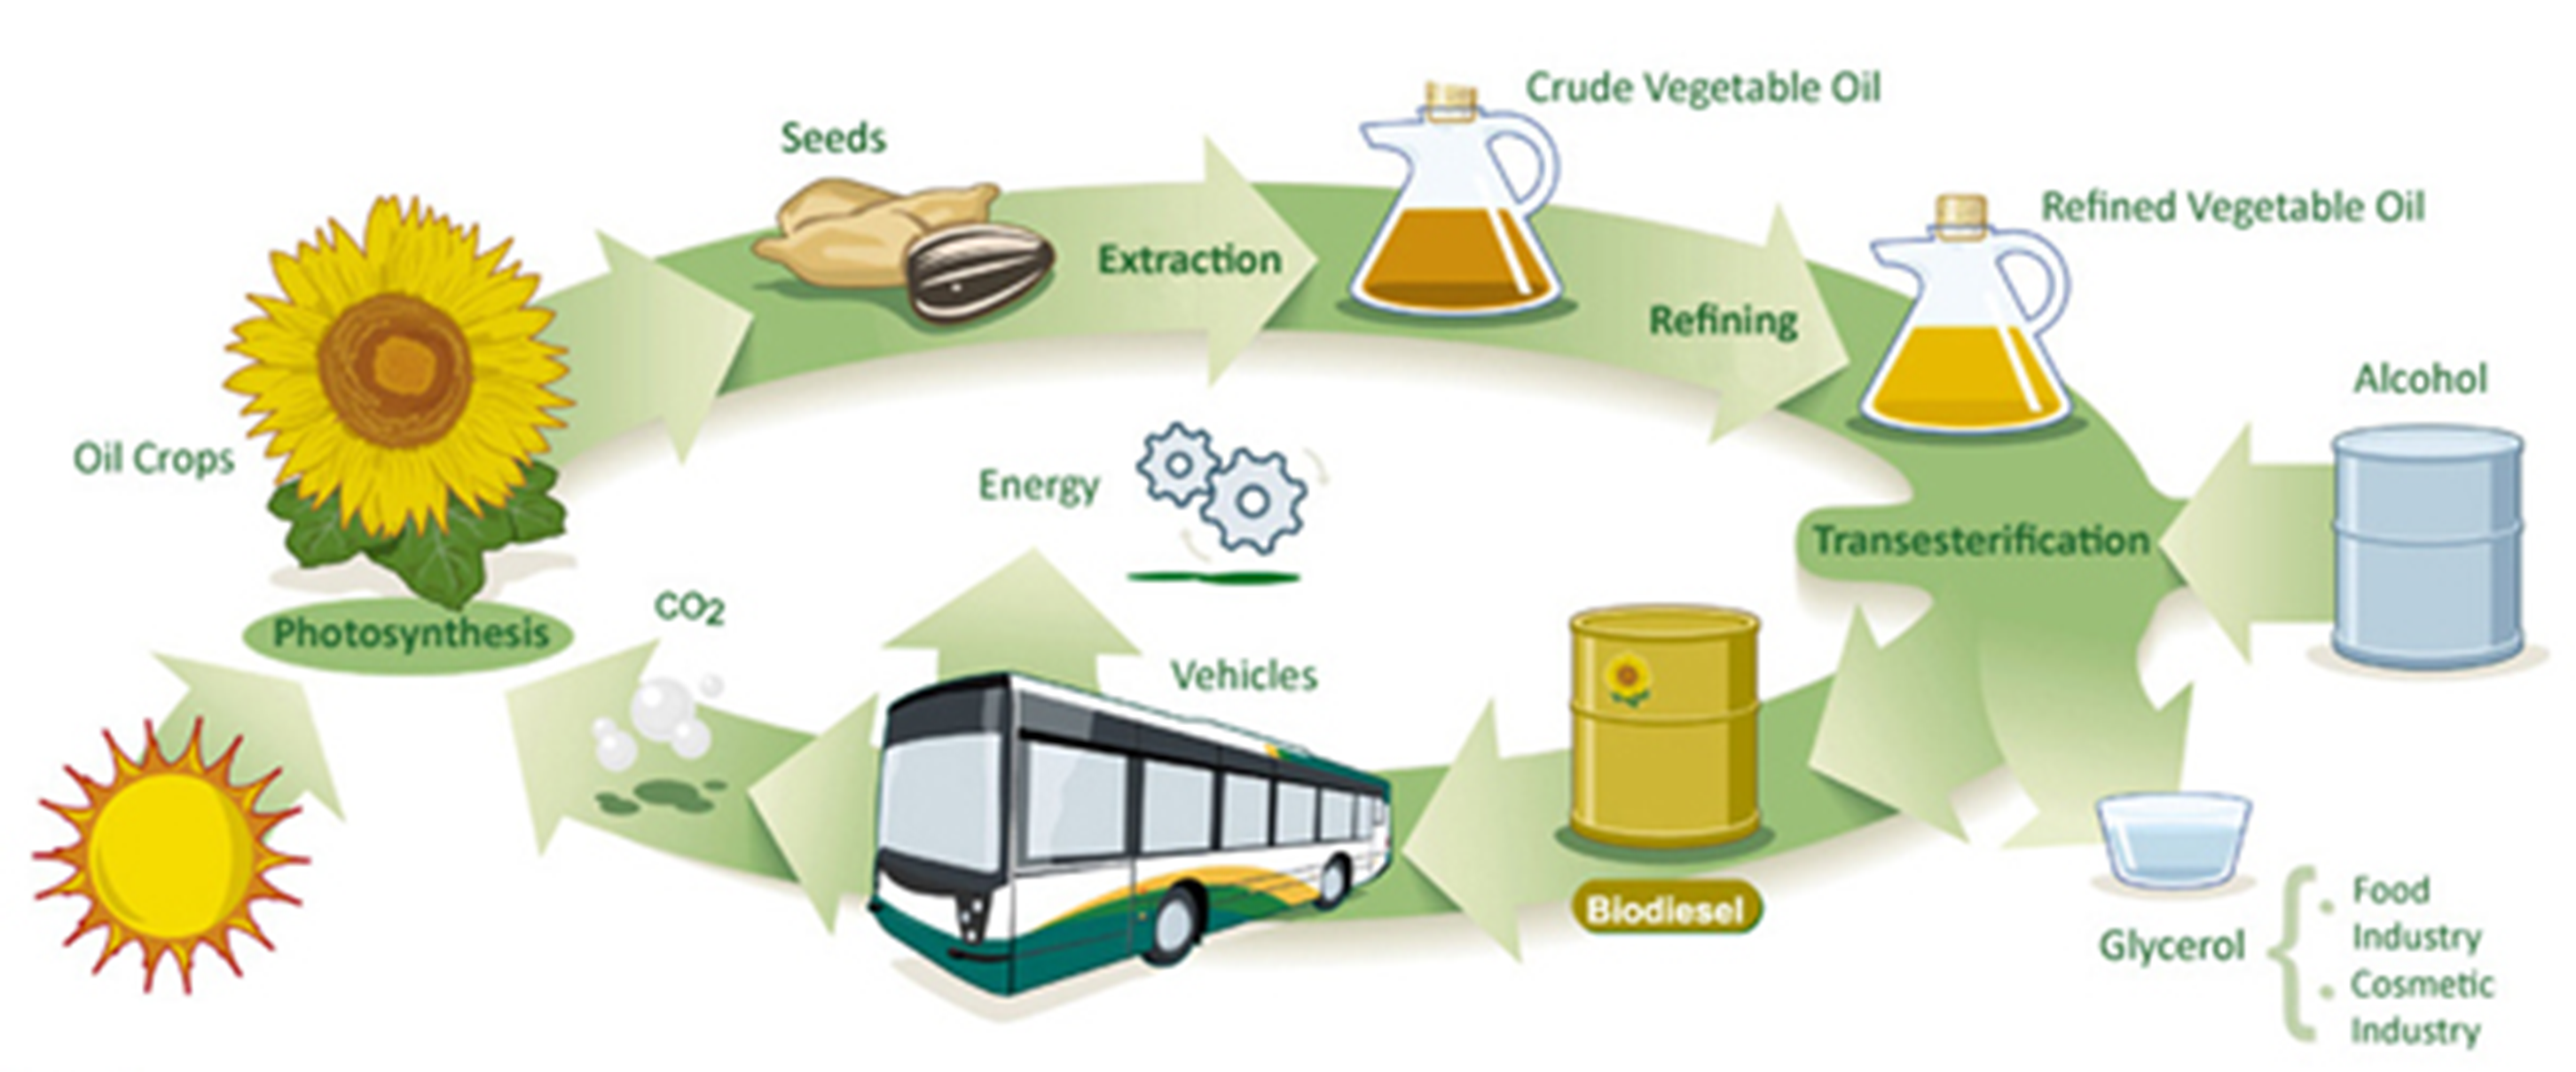
Biodiesel is made from vegetable oils, animal tallow, used cooking oil, acid oils, jatropha oil, palm stearin, etc. All these sources are organic in nature and are most often waste products from vegetable oil and food processing industries.

Figure 12: Chemical process of biodiesel production

SOURCE: INCRED RESEARCH, COMPANY REPORTS

The chemical process of biodiesel production is explained in the above chart. Methanol is used for transesterification and the glycerol obtained is refined into glycerine for sale to the soap industry.

Plant economics

The minimum viable plant size is around 20tpd. This plant can produce approximately 20mt of biodiesel per day and would have a minimum of 300 operating days in a year. These plants are multi-feed and can take any of the raw materials mentioned above.


Figure 13: Plant economics

Capacity

20.00

t/day

Capital cost

40.00

Rs m

Interest rate

10%

Loan tenure

10.00

Years

Debt: Asset ratio

70%

Annual capital cost

4.56

Rs m

Days of operation

330.00

Equity capital

12.00

Rs m

Feedstock

Name

Cost/kg

Yield

Non-edible vegetable oil

60.00

94%

Used cooking oil

65.00

92%

Acid oils

62.00

84%

Spent oil

63.00

84%

Palm stearine

82.00

97%

Animal tallow

78.00

95%

Conversion cost (chemicals, processing)

8.00

Rs/kg

Labour cost

2.00

Rs m

Sale price

Biodiesel

102.30

Rs/kg

Glycerine

1.00

Rs/kg

Carbon credits @$10

810.00

Rs/credit

Production

Feedstock type

Biodiesel (kt)

Glycerin (kt)

Carbon credits


Non-edible vegetable oil

6.2

0.4

15,634

Used cooking oil

6.1

0.5

15,301

Acid oils

5.5

1.1

13,971

Spent oil

5.5

1.1

13,971

Palm stearine

6.4

0.2

16,133

Animal tallow

6.3

0.3

15,800

Revenues in (Rs m)


Feedstock type

Biodiesel

Glycerin

Carbon credits

Total

Non-edible vegetable oil

634.7

0.4

12.7

647.7

Used cooking oil

621.2

0.5

12.4

634.1

Acid oils

567.2

1.1

11.3

579.5

Spent oil

567.2

1.1

11.3

579.5

Palm stearine

654.9

0.2

13.1

668.2

Animal tallow

641.4

0.3

12.8

654.6

Operating margin (Rs m)


Feedstock type

Revenue

Cost of raw material, processing

EBIT

Non-edible vegetable oil

647.7

396.0

249.7

Used cooking oil

634.1

429.0

203.1

Acid oils

579.5

409.2

168.3

Spent oil

579.5

415.8

161.7

Palm stearine

668.2

541.2

125.0

Animal tallow

654.6

514.8

137.8

Net Profit (in Rs million)

Feedstock type

EBIT

Capital cost

PBT

PAT @25.2%
tax rate

Non-edible vegetable oil

249.7

4.6

245.2

183.4

Used cooking oil

203.1

4.6

198.5

148.5

Acid oils

168.3

4.6

163.8

122.5

Spent oil

161.7

4.6

157.2

117.6

Palm stearine

125.0

4.6

120.4

90.1

Animal tallow

137.8

4.6

133.2

99.6


SOURCE: INCRED RESEARCH, COMPANY REPORTS

As the plant is multi-feed, it can take any vegetable oil or animal fat as feedstock. However, different feedstocks have different biodiesel yields, as can be seen in the table above. When 1kg of feedstock with 95% biodiesel yield is fed into a biodiesel plant, it will generate approximately 950gm of biodiesel and 50gm of glycerine.

Carbon credit production is based on the amount of biodiesel produced. The lifecycle emission of biodiesel is around 80% lower than conventional diesel. As each metric tonne (mt) of conventional diesel generates an equivalent of 3.15mt of carbon dioxide emissions, we can say that each kg of biodiesel produced will account for 2.52 carbon credits (80% of 3.15mt).

Financial returns of a biodiesel plant

Figure 14: Biodiesel plant’s financial returns

Capacity

20

t/day


Capital cost

40

Rs m


Interest rate

10%


Loan tenure

10

Years


Debt: Asset ratio

70%


Annual capital cost

4.6

Rs m


Days of operation

330


Equity capital

12

Rs m


Return on Equity


Feedstock type


Non-edible vegetable oil

1528%


Used cooking oil

1238%


Acid oils

1021%


Spent oil

980%


Palm stearine

751%


Animal tallow

830%


ROCE


Feedstock type


Non-edible vegetable oil

624%


Used cooking oil

508%


Acid oils

421%


Spent oil

404%


Palm stearine

312%


Animal tallow

344%


Working capital needed (in Rs million)


Feedstock type

Monthly stocking

Quarterly stocking

Annual stocking

Non-edible vegetable oil

33.0

99.0

396.0

Used cooking oil

35.8

107.3

429.0

Acid oils

34.1

102.3

409.2

Spent oil

34.7

104.0

415.8

Palm stearine

45.1

135.3

541.2

Animal tallow

42.9

128.7

514.8


SOURCE: INCRED RESEARCH, COMPANY REPORTS

The above table shows the astounding financial returns that can be generated by a 20tpd biodiesel plant. However, it should be noted that raw materials for such a plant aren’t readily available and as their production is largely seasonal, a biodiesel plant operator needs to store the feedstock. Thus, we see that while the equity capital required may not be a problem, working capital could become a serious constraint for a biodiesel plant.

Views of exhibitors, speakers at the conference

At the conference, biodiesel received very little attention. However, as the cost model above indicates, biodiesel has the potential to be even more profitable than CBG and ethanol.

Exhibitors believe that biodiesel will have its moment of reckoning as diesel can’t easily be substituted by another fuel in industries like trucking, mining, etc. As green audits start happening in India as well, these industries will have to find ways to abate their greenhouse gas emissions cheaply. Here, biodiesel will play a key role as there’s no change in the machinery required.

Feedstock availability

As much of the feedstock is seasonal, there is a requirement to carry inventory.

Figure 15: Biodiesel plant’s feedstock inventory

Working capital needed (Rs m)


Feedstock type

Monthly stocking

Quarterly stocking

Annual stocking

Non-edible vegetable oil

33.0

99.0

396.0

Used cooking oil

35.8

107.3

429.0

Acid oils

34.1

102.3

409.2

Spent oil

34.7

104.0

415.8

Palm stearine

45.1

135.3

541.2

Animal tallow

42.9

128.7

514.8


SOURCE: INCRED RESEARCH, COMPANY REPORTS

As the table above indicates, inventory can become very costly. The inventory cost of annual stocking is equivalent to around 10 times the capex cost. Thus, it can become very difficult to operate this business.

The government, through recent regulations, has made it harder to operate this business as it has allowed the export of biodiesel feedstock while increasing the regulatory burden when it comes to exporting biodiesel.

Further research requirement  

Previously, jatropha oil was thought to be a great source of biodiesel. However, the jatropha plant is still wild and undomesticated. It isn’t a complete crop like napier. So, further research is needed in farming jatropha effectively as well as finding more suitable crops which can serve as feedstock for biodiesel production.

Using farm products as feedstock would help solve the operational requirements of having a large inventory of feedstock on hand. Especially, if the crop is a fast grower.

Biomass briquettes

How are they made?  

Solid farm waste like cotton husk, etc. is compacted into briquettes. These briquettes can be used as fuel.

Challenges in this business

As the raw material is produced on a seasonal basis, the raw material often must be bought once or twice a year and then stored for the rest of the year. This greatly increases the working capital requirement.

The raw material as well as the finished product are bulky. Thus, transporting them is a problem. This leads to differential pricing across the country.

Technology change is needed

A special biomass burner must be installed in order to utilize the fuel. This reduces operational flexibility for fuel consumers and hence, acts as a constraint.

Biofuel, biomass trading

Benefits

Help reduce supply chain uncertainty for many biofuel industries and consumers.

Demerits

As many biomass gas buyers are quite price-sensitive, the transportation cost and platform charges can end up making many of these businesses unviable. However, with better economies of scale and a more active trading network, these problems can be avoided. Else, biomass trading platforms can become an unviable business.

Overall views from the conference and expo

By and large, the exhibitors comprised EPC firms, biofuel plants and specialized equipment manufacturers, and some new technology providers. The visitors at the expo were primarily MSME businessmen who were looking to get into the biofuels space and manufacture these fuels. Most didn’t have a background in the industry.

Investment ideas

Gas consumers

As CBG accounts for a greater proportion of India’s gas mix, domestic gas produced can be used by industrial gas users. As domestic gas is much cheaper than international gas, industrial gas users can benefit greatly from cheaper prices.

Kajaria Ceramics: The company has already invested in and set up a captive biogas generation plant which is able to meet around 18% of its gas requirement, but it is facing some technical hurdles in further usage of biogas.

Deepak Fertilizers and Petrochemicals: Engaged in nitrogenous fertilizer production.

Chambal Fertilizers: Engaged in nitrogenous fertilizer production.

Gujarat State Fertilizer Company: Engaged in nitrogenous fertilizer production.

CGD companies

The government has come out with a blending policy for gas, which is similar to its ethanol blending policy. According to this policy, CGD companies have to sell atleast 1% of biogas as a proportion of their total sales volume by 2023F, 3% by 2024F and 5% by 2027F. Given the high biogas production targets, we expect the government to set a target for 10% biogas blending soon after that.

Figure 16: Gas blending policy’s impact on CGD companies


MGL

Gujarat Gas

IGL

Average CGD impact

Mix

99%:1%

97%:3%

95%:5%

90%:10%

99%:1%

97%:3%

95%:5%

90%:10%

99%:1%

97%:3%

95%:5%

90%:10%

99%:1%

97%:3%

95%:5%

90%:10%

NG

40

39

38

36

45

44

43

41

40

39

38

36

42

41

40

38

CBG

1

2

3

6

1

2

3

6

1

2

3

6

1

2

3

6

Cost (Rs/kg)

41

41

41

42

45

46

46

47

40

41

41

42

42

43

43

44

Normal EPS

80

80

80

80

22

22

22

22

23

23

23

23

42

42

42

42

CBG Adjusted EPS

78

73

68

55

22

20

19

16

23

21

19

15

41

38

35

29

+/-

-3%

-9%

-15%

-31%

-3%

-9%

-15%

-30%

-4%

-11%

-18%

-35%

-3%

-9%

-16%

-32%


SOURCE: GOOGLE, INCRED RESEARCH, COMPANY REPORTS

In the table above, we can see the gas blending policy’s impact on EPS of Mahanagar Gas or  MGL, Gujarat Gas and Indraprastha Gas.

Gas cylinder manufacturers

There is only one listed entity in the compressed gas cylinder space, which is Everest Kanto Cylinder.

Automobile sector

In this industry, companies who manufacture CNG-fuel vehicles and those who have exposure to rural sales can benefit. This is because CNG vehicles can easily use automobile grade CBG as fuel. So far as rural sales are concerned, as biogas production will be mainly in rural areas, we expect wealth generation and investment to occur in the agri sector.

Bajaj Auto: Has sizeable exposure to CNG automobiles.

Escorts Kubota: Manufactures tractors and other related machinery.

Carbon credits

Like other renewable energy plants, biogas and biodiesel plants can generate a large amount of carbon credits.

EKI Energy Services: It is the only listed carbon credits company in India.

DISCLAIMER

This report (including the views and opinions expressed therein, and the information comprised therein) has been prepared by Incred Research Services Private Ltd.(formerly known as Earnest Innovation Partners Private Limited) (hereinafter referred to as “ IRSPL”). IRSPL is registered with SEBI as a Research Analyst vide Registration No. INH000007793. Pursuant to a trademark agreement, IRSPL has adopted “Incred Equities ” as its trademark for use in this report.

The term “IRSPL” shall, unless the context otherwise requires, mean IRSPL and its affiliates, subsidiaries and related companies. This report is not directed or intended for distribution to or use by any person or entity resident in a state, country or any jurisdiction, where such distribution, publication, availability or use would be contrary to law, regulation or which would subject IRSPL and its affiliates/group companies to registration or licensing requirements within such jurisdictions.

This report is being supplied to you strictly on the basis that it will remain confidential. No part of this report may be (i) copied, photocopied, duplicated, stored or reproduced in any form by any means; or (ii) redistributed or passed on, directly or indirectly, to any other person in whole or in part, for any purpose without the prior written consent of IRSPL.

The information contained in this report is prepared from data believed to be correct and reliable at the time of issue of this report.

IRSPL is not required to issue regular reports on the subject matter of this report at any frequency and it may cease to do so or change the periodicity of reports at any time. IRSPL is not under any obligation to update this report in the event of a material change to the information contained in this report. IRSPL has not any and will not accept any, obligation to (i) check or ensure that the contents of this report remain current, reliable or relevant; (ii) ensure that the content of this report constitutes all the information a prospective investor may require; (iii) ensure the adequacy, accuracy, completeness, reliability or fairness of any views, opinions and information, and accordingly, IRSPL and its affiliates/group companies (and their respective directors, associates, connected persons and/or employees) shall not be liable in any manner whatsoever for any consequences (including but not limited to any direct, indirect or consequential losses, loss of profits and damages) of any reliance thereon or usage thereof.

Unless otherwise specified, this report is based upon reasonable sources. Such sources will, unless otherwise specified, for market data, be market data and prices available from the main stock exchange or market where the relevant security is listed, or, where appropriate, any other market. Information on the accounts and business of company(ies) will generally be based on published statements of the company(ies), information disseminated by regulatory information services, other publicly available information and information resulting from our research. Whilst every effort is made to ensure that statements of facts made in this report are accurate, all estimates, projections, forecasts, expressions of opinion and other subjective judgments contained in this report are based on assumptions considered to be reasonable as of the date of the document in which they are contained and must not be construed as a representation that the matters referred to therein will occur. Past performance is not a reliable indicator of future performance. The value of investments may go down as well as up and those investing may, depending on the investments in question, lose more than the initial investment. No report shall constitute an offer or an invitation by or on behalf of IRSPL and its affiliates/group companies to any person to buy or sell any investments.

The opinions expressed are based on information which are believed to be accurate and complete and obtained through reliable public or other non-confidential sources at the time made. (Information barriers and other arrangements may be established where necessary to prevent conflicts of interests arising. However, the analyst(s) may receive compensation that is based on his/their coverage of company(ies) in the performance of his/their duties or the performance of his/their recommendations. In reviewing this report, an investor should be aware that any or all of the foregoing, among other things, may give rise to real or potential conflicts of interest. Additional information is, subject to the duties of confidentiality, available on request.

The report is not a “prospectus” as defined under Indian Law, including the Companies Act, 2013, and is not, and shall not be, approved by, or filed or registered with, any Indian regulator, including any Registrar of Companies in India, SEBI, any Indian stock exchange, or the Reserve Bank of India. No offer, or invitation to offer, or solicitation of subscription with respect to any such securities listed or proposed to be listed in India is being made, or intended to be made, to the public, or to any member or section of the public in India, through or pursuant to this report.

The research analysts, strategists or economists principally responsible for the preparation of this research report are segregated from the other activities of IRSPL. Information barriers and other arrangements have been established, as required, to prevent any conflicts of interests.

The research analysts, strategists or economists principally responsible for the preparation of this research report are segregated from the other activities of IRSPL. Information barriers and other arrangements have been established, as required, to prevent any conflicts of interests.

IRSPL may have issued other reports (based on technical analysis, event specific, short term views etc.) that are inconsistent with and reach different conclusion from the information presented in this report.

Holding of Analysts/Relatives of Analysts, IRSPL and Associates of IRSPL in the covered securities, as on the date of publishing of this report

Analyst/ Relative Entity/ Associates
any financial interests in the company covered in this report (subject company) and nature of such financial interest NO NO
actual/beneficial ownership of 1% or more in securities of the subject company at the end of the month immediately preceding the date of publication of the research report or date of the public appearance; NO NO
any other material conflict of interest at the time of publication of the research report or at the time of public appearance NO NO
received any compensation from the subject company in the past twelve months for investment banking or merchant banking or brokerage services or investment advisory or depository or distribution from the subject company in the last twelve months for products/services other than investment banking or merchant banking or broker- age services or investment advisory or depository or distribution from the subject company in the last twelve months NO NO
managed or co-managed public offering of securities for the subject company in the last twelve months NO NO
received any compensation or other benefits from the subject company or third party in connection with the research report NO NO
served as an officer, director or employee of the subject company NO NO
been engaged in market making activity for the subject company NO NO
Analyst declaration
  • The analyst responsible for the production of this report hereby certifies that the views expressed herein accurately and exclusively reflect his or her personal views and opinions about any and all of the issuers or securities analysed in this report and were prepared independently and autonomously in an unbiased manner.
  • No part of the compensation of the analyst(s) was, is, or will be directly or indirectly related to the inclusion of specific recommendations(s) or view(s) in this report or based any specific investment banking transaction.
  • The analyst(s) has(have) not had any serious disciplinary action taken against him/her(them). • The analyst, strategist, or economist does not have any material conflict of interest at the time of
  • publication of this report.
  • The analyst(s) has(have) received compensation based upon various factors, including quality, accuracy and value of research, overall firm performance, client feedback and competitive factors.

IRSPL and/or its affiliates and/or its Directors/employees may own or have positions in securities of the company(ies) covered in this report or any securities related thereto and may from time to time add to or dispose of, or may be materially interested in, any such securities.

IRSPL and/or its affiliates and/or its Directors/employees may do and seek to do business with the company(ies) covered in this research report and may from time to time (a) buy/sell the securities covered in this report, from time to time and/or (b) act as market maker or have assumed an underwriting commitment in securities of such company(ies), and/or (c) may sell them to or buy them from customers on a principal basis and/or (d) may also perform or seek to perform significant investment banking, advisory, underwriting or placement services for or relating to such company(ies) and/or (e) solicit such investment, advisory or other services from any entity mentioned in thisreport and/or (f) act as a lender/borrower to such company and may earn brokerage or other compensation. However, Analysts are forbidden to acquire, on their own account or hold securities (physical or uncertificated, including derivatives) of companies in respect of which they are compiling and producing financial recommendations or in the result of which they play a key part.