India

Overweight (no change)

Highlighted Companies

Gujarat Gas
ADD, TP Rs679, Rs465 close

We recently upgraded our rating on the stock to ADD with a target price of Rs679 (at 23x FY25F EPS). However, the downside risk could arise from a weak ceramic sector outlook, or a sustained discount in propane/LPG prices vs. natural gas prices leading to increased pricing competition from alternative fuels in the industrial and commercial segments.


Indraprastha Gas
ADD, TP Rs539, Rs473 close

We recently upgraded our rating on the stock to ADD with a target price of Rs539 (at 18x FY25F EPS). However, the downside risk could arise from any changes in the government’s policy for the sector.


Mahanagar Gas
ADD, TP Rs1252, Rs1049 close

We recently upgraded our rating on the stock to ADD with a target price of Rs1,252 (at 18x FY25F EPS). We expect a moderate volume growth of only around 6% CAGR over FY24F-26F.


Summary Valuation Metrics

P/E (x) Mar22-A Mar23-A Mar24-F
Gujarat Gas 24.87 20.95 18.13
Indraprastha Gas 22.06 20.57 15.46
Mahanagar Gas 17.35 13.11 10.47
P/BV (x) Mar23-F Mar24-F Mar22-F
Gujarat Gas 5.69 4.56 3.7
Indraprastha Gas 4.37 4.18 3.37
Mahanagar Gas 2.88 2.51 2.02
Dividend Yield Mar22-F Mar23-F Mar24-F
Gujarat Gas 0.43% 0.43% 0.43%
Indraprastha Gas 0.76% 0.76% 0.76%
Mahanagar Gas 3.15% 0.95% 0.95%
Analyst(s)

Satish KUMAR

T (91) 22 4161 1562
E satish.kumar@incredcapital.com

Abbas PUNJANI

T (91) 22 4161 1598
E abbas.punjani@incredcapital.com

1QFY24 preview - Volume growth likely

The Indian government’s focus on allocating higher APM gas to domestic CGD companies indicates a potential shift in the country’s preference to purchase urea instead of using natural gas for urea production. This strategic emphasis presents an opportunity for CGD companies.

We believe that CGD players are poised to benefit from favourable margins. The decline in LNG prices suggests potential volume growth and a likely upward gross profit/scm trend.

We expect a positive volume trend and improved margins for CGD companies in 1QFY24F. Indraprastha Gas remains our top pick in the CGD space.

APM gas allocation and LNG price fall are signs of tailwinds ahead

The correction in spot prices of liquefied natural gas or LNG in Europe, driven by declining demand, brings some relief in the medium term while the long-term prices are expected to remain stable. As the RasGas contract for Petronet LNG nears its expiry in 2028, a cautious approach is likely for its renewal. The US capacity expansion plans present an opportunity for Petronet LNG to secure a new long-term contract at more favourable rates. Also, the Indian government's emphasis on allocating higher APM gas to CGD companies indicates a potential shift towards purchasing urea instead of using natural gas for urea production. This creates a win-win situation for CGD players, with favourable prospects for increased margins and volume.

Lower European gas demand is a blessing in disguise

The decline in LNG prices can be attributed to multiple factors, including stagnant LNG import demand in China, a notable reduction in Europe's imported gas consumption, shift in consumer behaviour driven by higher gas prices in Europe, decreased LNG imports by Pakistan, and the global expansion of liquefaction capacity. These combined forces have created a complex market landscape characterized by an abundance of supply and weakened demand, leading to a correction in LNG prices and the establishment of a state of equilibrium in the market. Please click our recent report: IN: Gas Transmission & Dist - Volume growth concerns are behind us

Maintain overweight rating on the sector

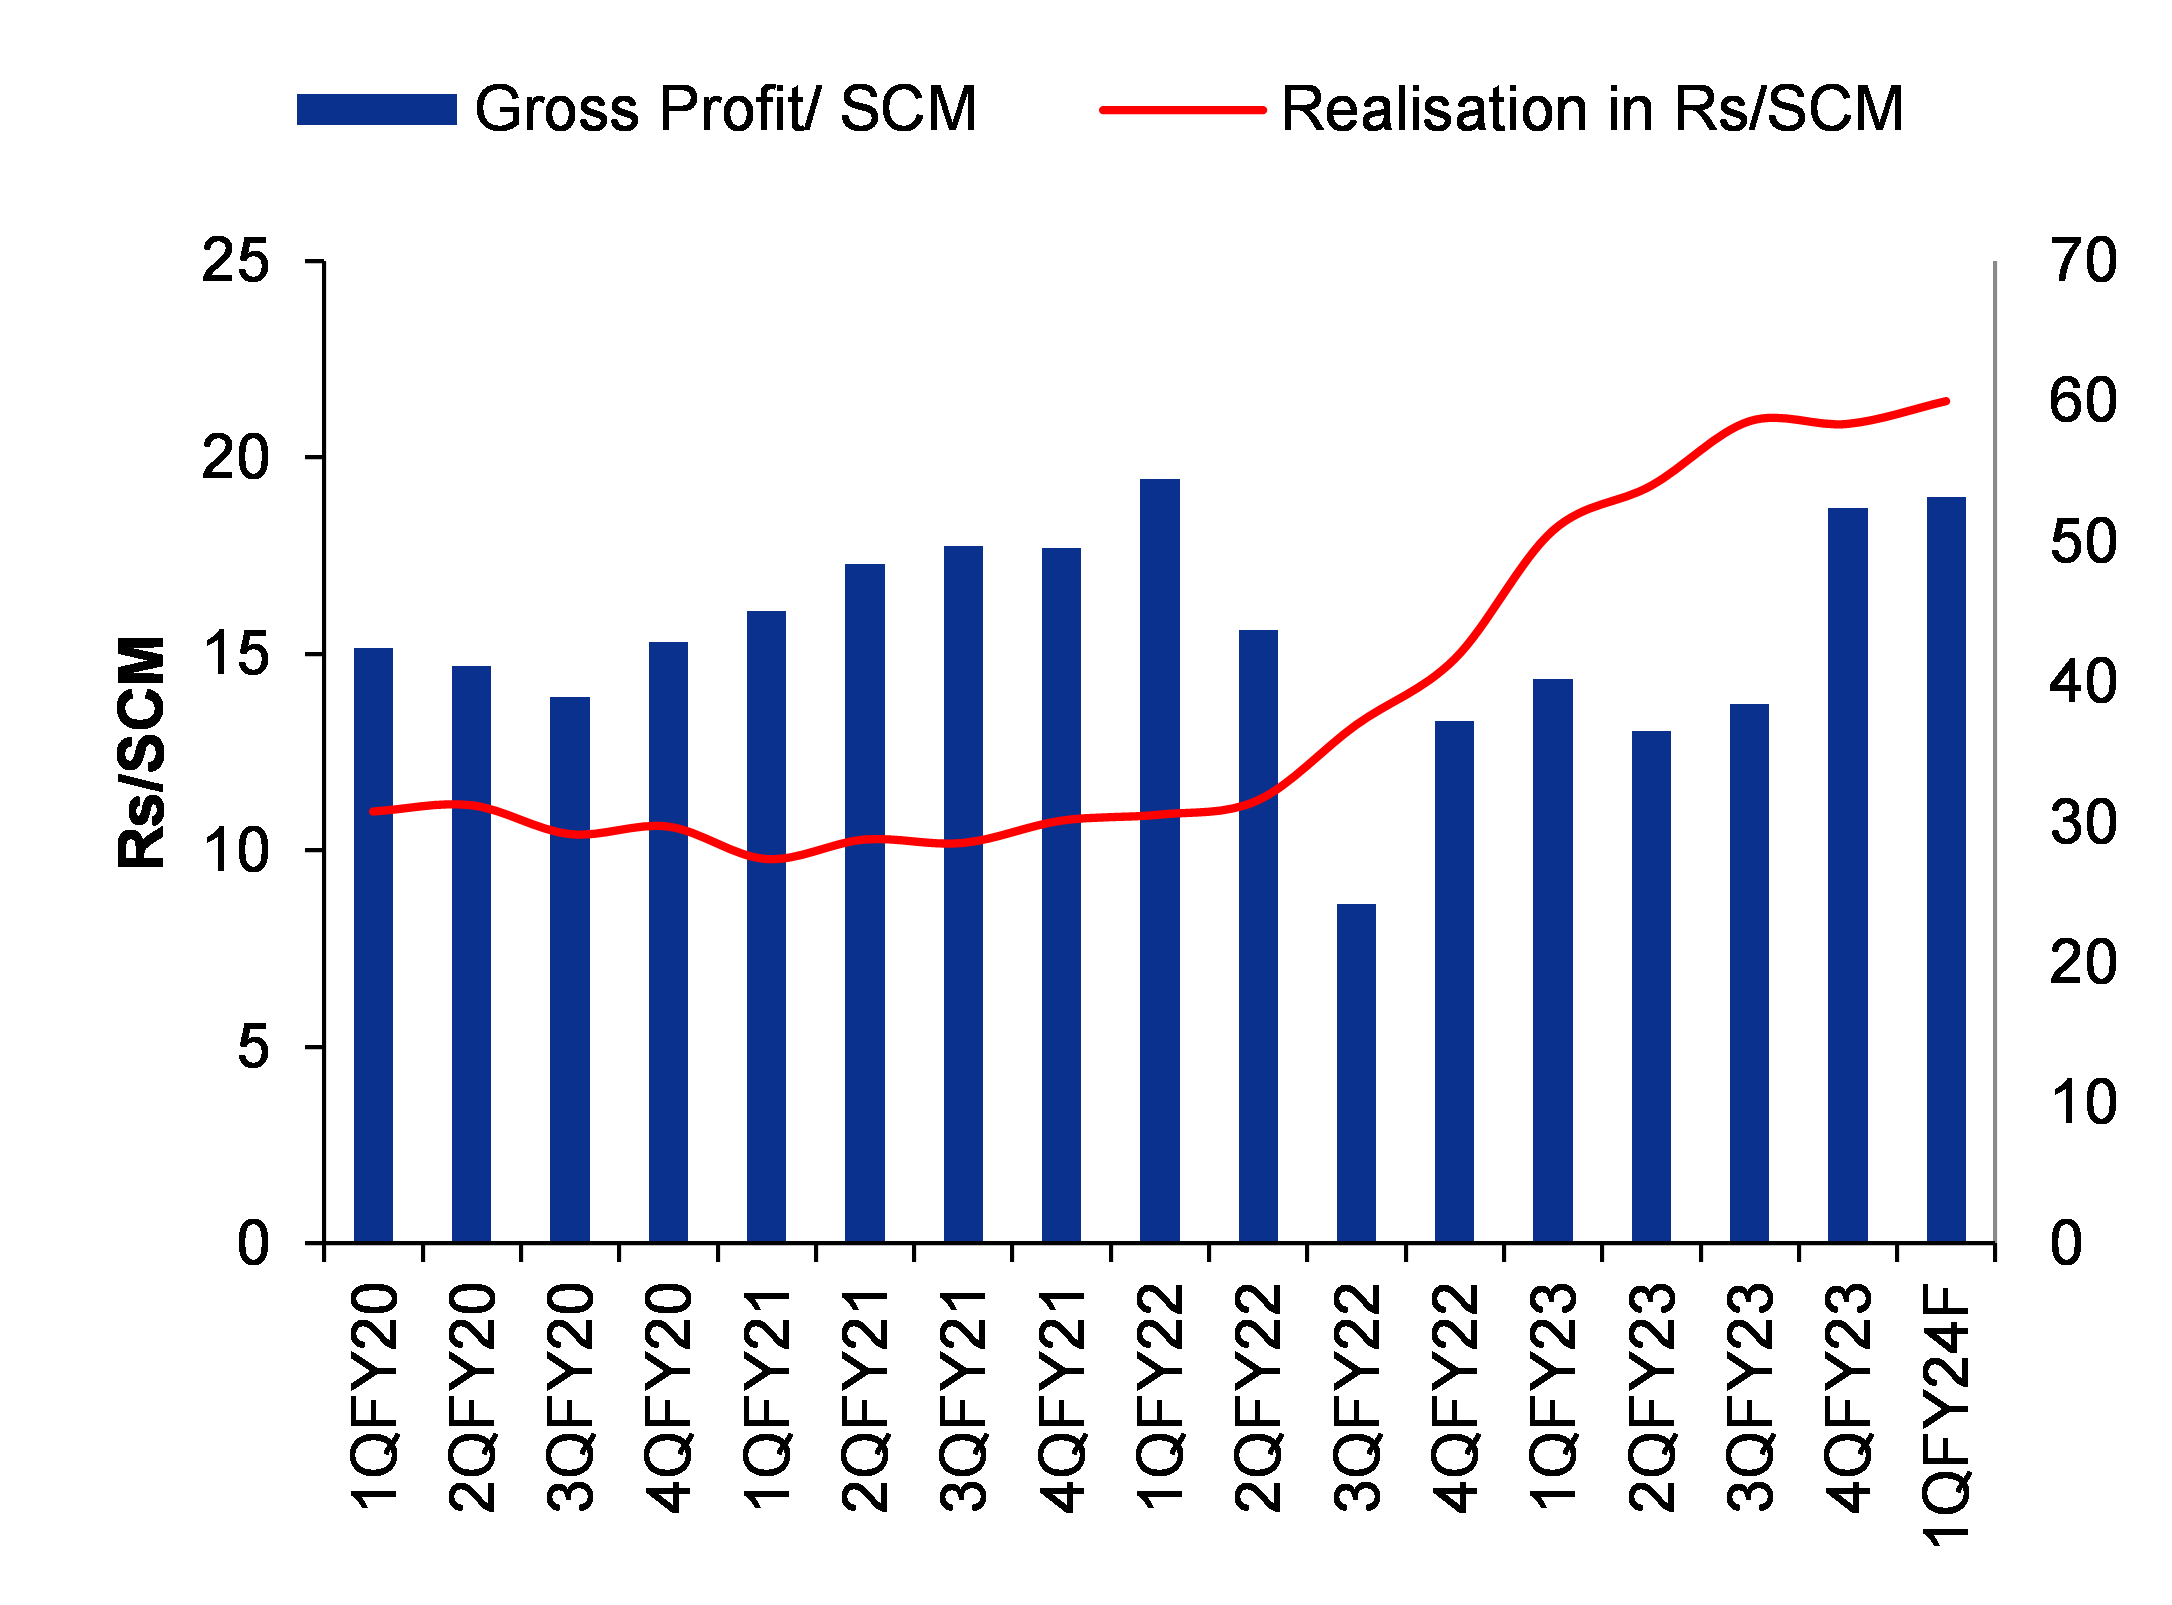
Indraprastha Gas or IGL is expected to achieve gross profit/scm of approximately Rs14, Gujarat Gas is likely to achieve around Rs12/scm, and Mahanagar Gas is projected to achieve Rs19/scm in 1QFY24F. Additionally, we expect a cumulative volume growth of 10% in 1QFY24F, compared to the previous quarter. We expect moderate volume growth for all CGD companies of only around 6% CAGR over FY24F-26F. It is important to note the potential risks associated with a substantial increase in LNG prices or alterations in government policies impacting the sector. Despite these risks, our top pick in the CGD space continues to be Indraprastha Gas.

Figure 1: Ratings of stocks in our CGD coverage universe

Ticker

Company Name

Rating

Target Price

EPS CAGR 3-YEAR

GUJGA IN

Gujarat Gas

ADD

679

14.7%

IGL IN

Indraprastha Gas

ADD

539

17.2%

MAHGL IN

Mahanagar Gas

ADD

1,252

10.9%


SOURCE: INCRED RESEARCH, COMPANY REPORTS

We expect favourable gross marginWe expect favourable gross margin

Higher APM gas allocation to CGD companies boosts the sector’s prospects

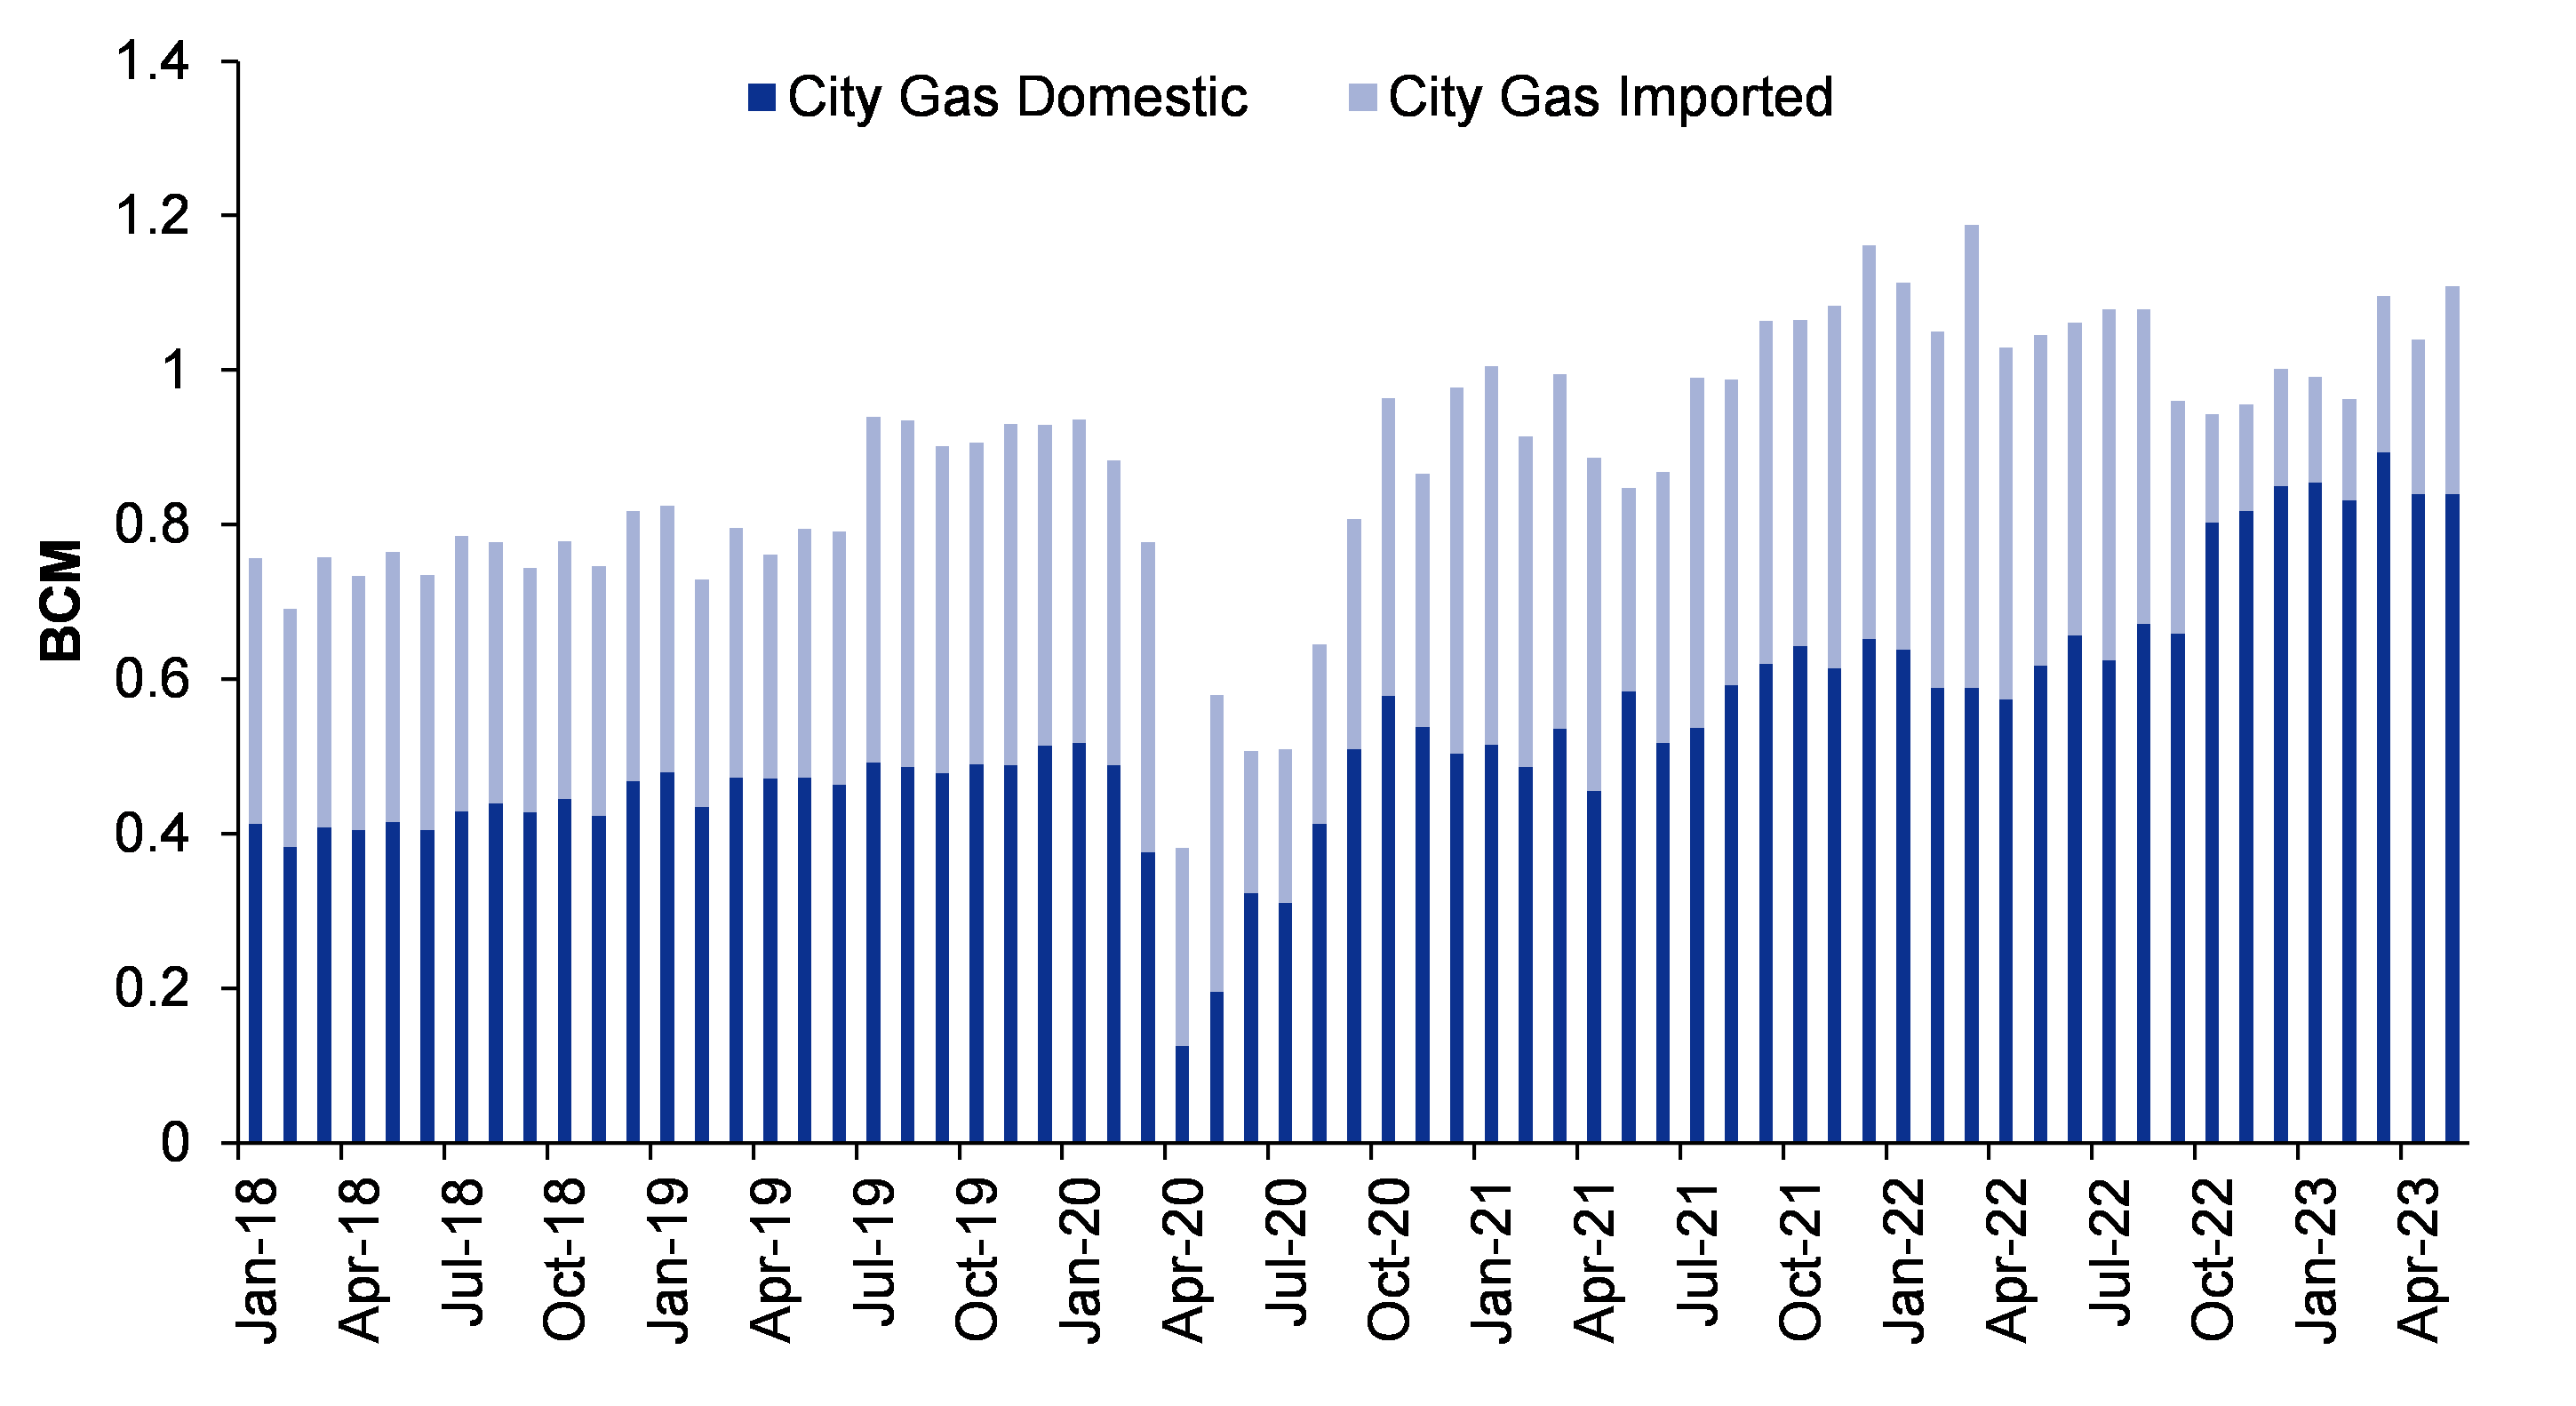
Figure 2: Impressive surge in city gas consumption - almost 40% growth compared to 1QFY23; higher APM gas offers a strong advantage for CGD companies

SOURCE: INCRED RESEARCH, COMPANY REPORTS

The domestic consumption of city gas witnessed a significant surge of nearly 40% in comparison to 1QFY23. The allocation of higher APM gas to city gas distribution (CGD) companies presents a favourable scenario and brings in potential benefits to the CGD sector. The increased access to APM gas enhances CGD companies' prospects and growth potential in the market.

Indraprastha Gas

We expect positive volume growth  

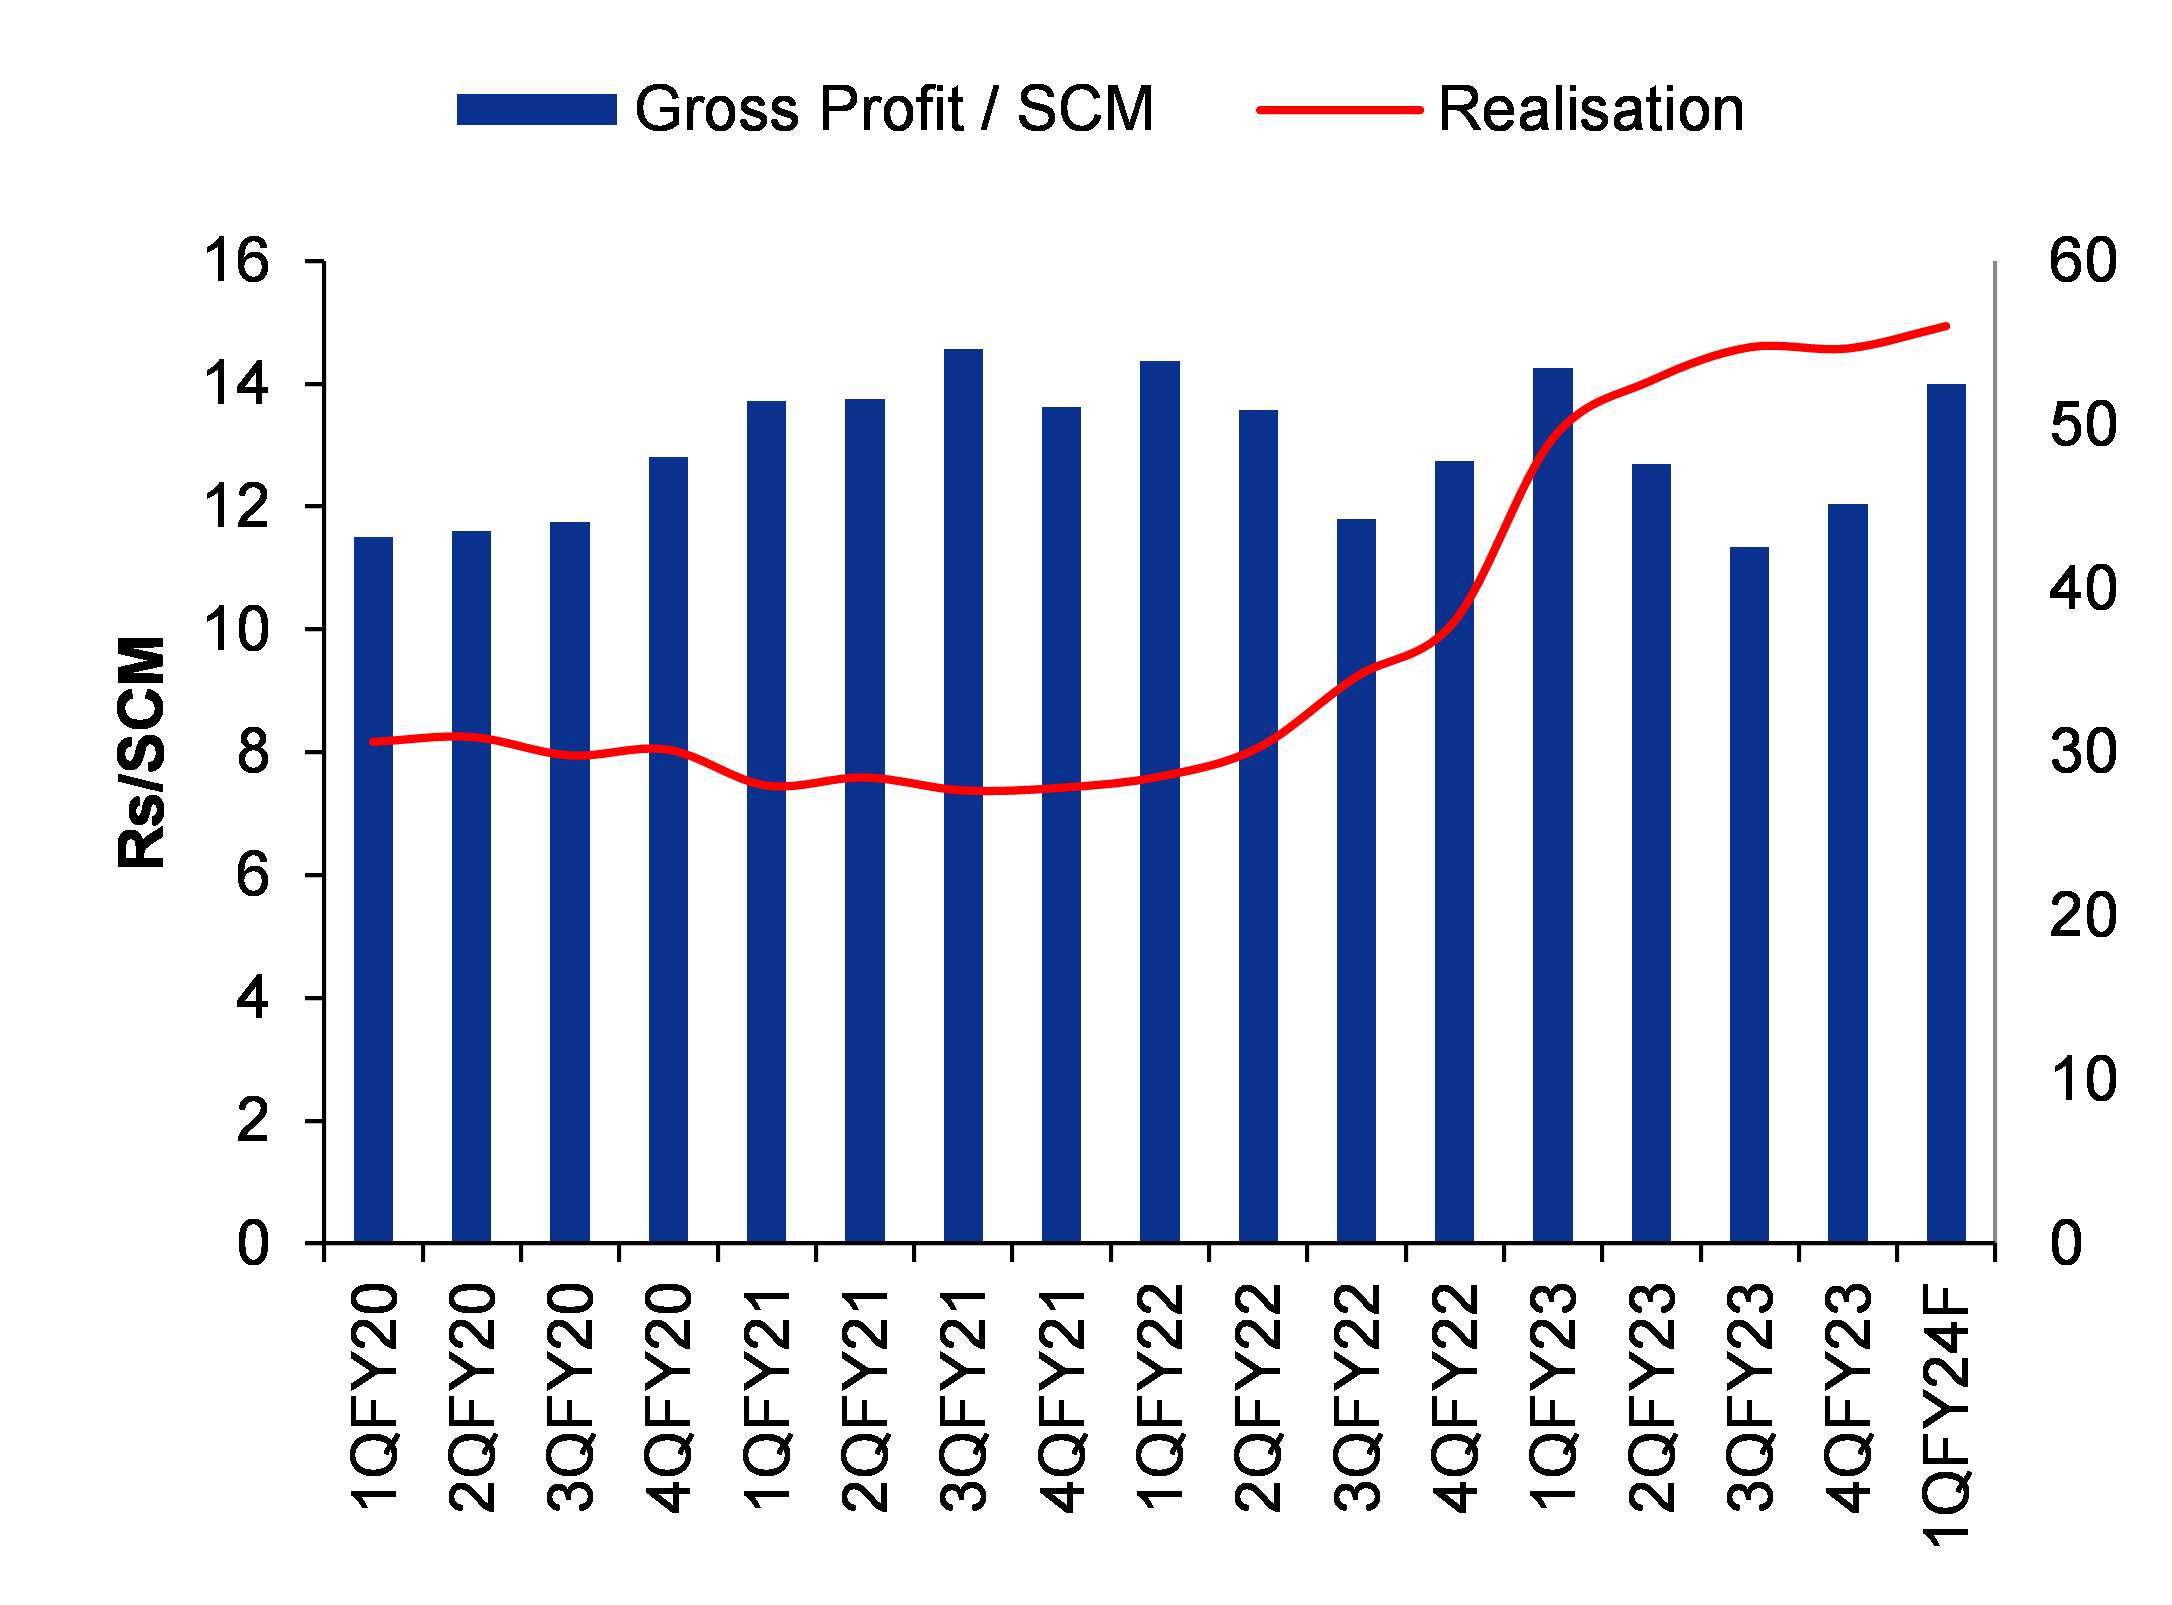
IGL reported gross profit per unit of Rs12.6/scm, indicating a YoY decrease of -3.4%. However, there was significant improvement in realization, with a YoY increase of 58.9% to Rs52.9/scm. With the current rise in margins due to reduced global LNG demand, we expect its gross profit to reach around Rs14/scm. Going ahead, IGL plans to strengthen its CNG infrastructure by adding 100 new stations in FY24F, with a focus on expanding into new regions. We have recently upgraded our rating on the stock to ADD (from REDUCE) with a revised target price of Rs539, based on 18x FY25F EPS.

In FY23, IGL expanded its CNG station network by adding 81 new stations, reaching a total of 791 stations, with approximately half of them situated in new geographical areas.

In FY24F, IGL plans to continue this growth by establishing 100 additional CNG stations, with 50% targeting new regions. The company experienced significant progress in piped natural gas or PNG connections, adding 310,000 new connections, and expanding its customer base with over 700 new industrial and 900 commercial customers.

Infrastructure development included the installation of 298km of steel pipelines and 3,400km of MDPE pipelines. Going ahead, IGL aims to achieve a sales volume of 9mmscmd in FY24F and further increase it to 10mmscmd in FY25F, while maintaining a targeted EBITDA/scm range of 7.5-8 in FY24F.

By FY25F, IGL expects 60% of its volume to come from Delhi and neighbouring areas, with the remaining 40% from other regions. In FY23, IGL sourced 89% of its gas requirement from APM/non-APM/CBG, 2% from HPHT, and the remaining from R-LNG. The estimated capital expenditure in FY24F is Rs16 bn, with 50% allocated for new geographical areas.

Figure 3: IGL is expected to achieve gross profit/scm of approximately Rs14, an increase of around 16% on QoQ basis

1QFY22

2QFY22

3QFY22

4QFY22

1QFY23

2QFY23

3QFY23

4QFY23

1QFY24F

YoY

QoQ

Revenue from operations

13,805

20,160

24,385

26,498

35,303

39,220

40,890

40,616

44,656

26%

10%

Total cost of goods sold

6,851

11,131

16,072

17,617

25,071

29,774

32,418

31,670

33,497

34%

6%

Gross profit

6,954

9,029

8,313

8,881

10,233

9,447

8,472

8,947

11,159

9%

25%

Total expenses

9,996

14,858

19,689

21,493

29,128

33,945

36,606

35,954

37,781

30%

5%

EBITDA

3,809

5,302

4,696

5,005

6,175

5,275

4,285

4,663

6,875

11%

47%

Depreciation & amortization

778

805

835

753

857

914

925

938

938

9%

0%

EBIT

3,031

4,497

3,861

4,252

5,318

4,361

3,360

3,725

5,937

12%

59%

Other income

298

421

304

744

307

510

557

654

654

113%

0%

Finance costs

29

26

28

49

24

31

26

26

24

0%

-8%

PBT

3,299

4,892

4,137

4,947

5,602

4,840

3,891

4,354

6,568

17%

51%

Total tax

857

1,241

1,051

1,361

1,394

1,269

1,109

1,057

1,655

19%

57%

PAT

2,443

3,651

3,085

3,586

4,209

3,572

2,783

3,298

4,913

17%

49%


Volume in mmscm

1QFY22

2QFY22

3QFY22

4QFY22

1QFY23

2QFY23

3QFY23

4QFY23

1QFY24F

YoY

QoQ

CNG

332

488

518

509

540

560

559

550

596

10%

8%

PNG - domestic

44

42

45

51

44

46

51

56

53

22%

-5%

PNG - industrial / commercial

74

91

95

92

89

92

91

92

98

11%

7%

Natural gas

34

46

46

45

46

46

46

45

49

8%

9%

Total sales volume

484

666

704

697

718

744

747

743

797

11%

7%

Realization

29

30

35

38

49

53

55

55

56

14%

2%

Gross profit/scm

14

14

12

13

14

13

11

12

14

-2%

16%

EBITDA/scm

8

8

7

7

9

7

6

6

9

0%

37%


SOURCE: INCRED RESEATHE RCH, COMPANY REPORTS


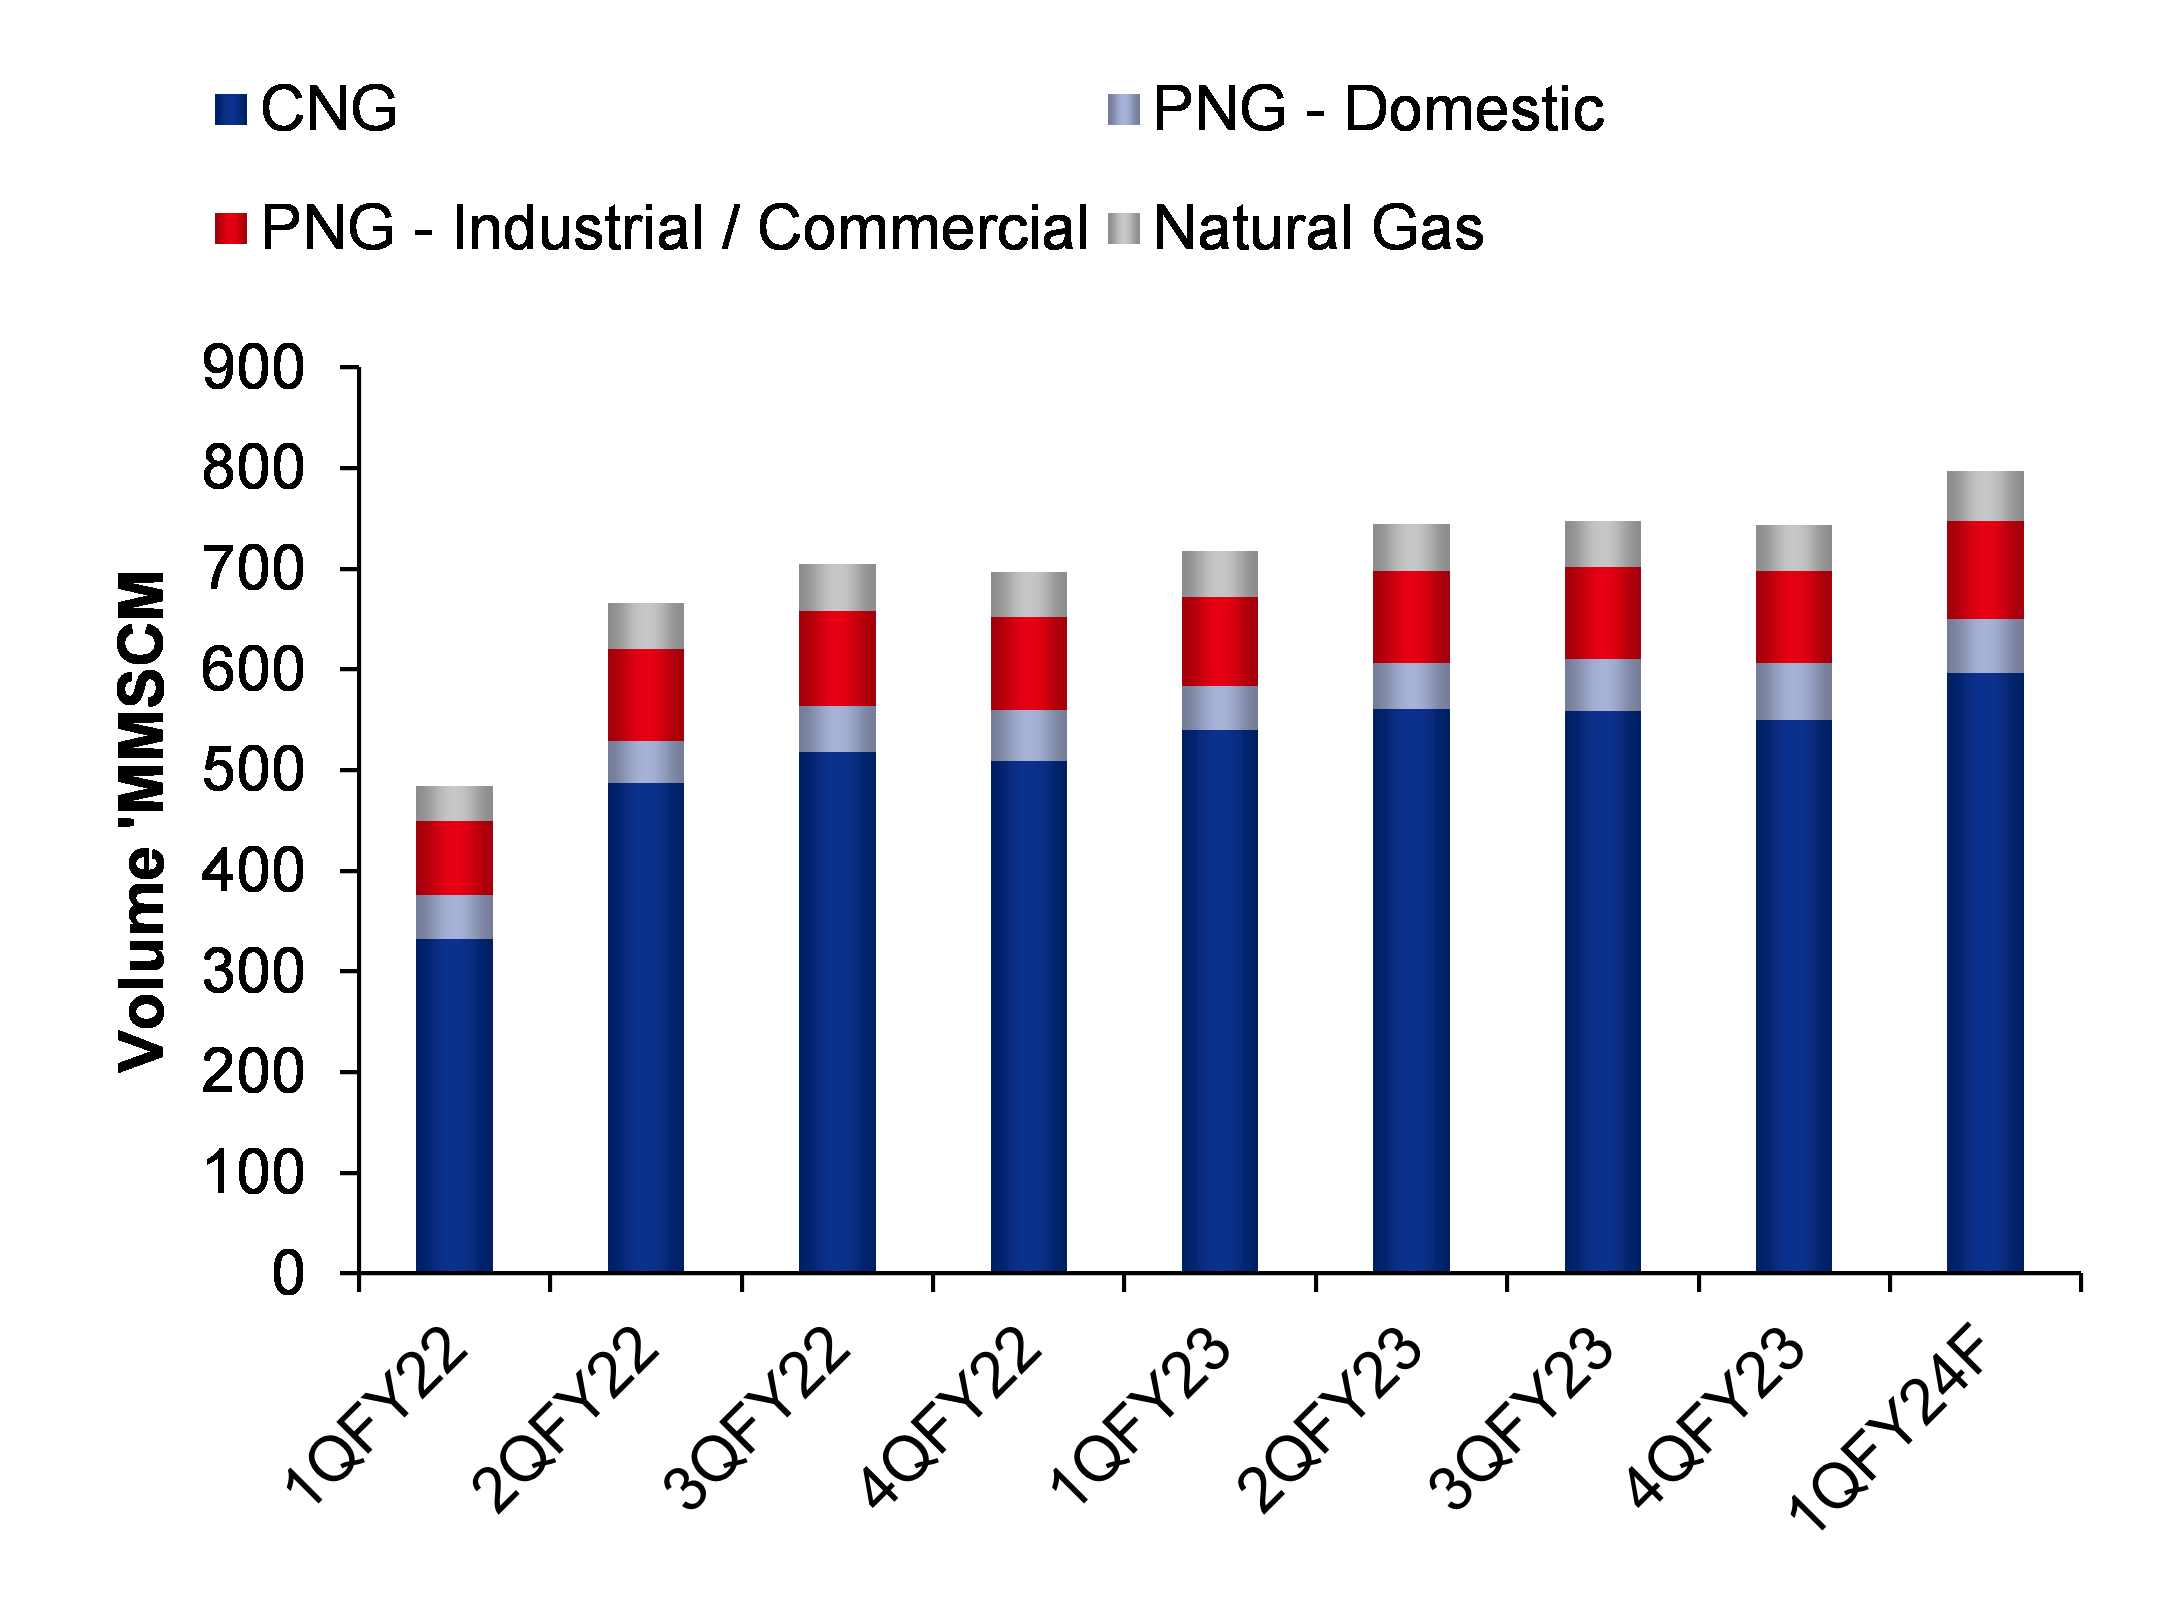
Figure 4: We expect its overall volume to be around 797mmscm, with a growth of 11% & 7% on YoY & QoQ basis, respectively

SOURCE: INCRED RESEARCH, COMPANY REPORTS

Figure 5: We expect average realization of Rs56, a growth of 16% QoQ, but remains in line YoY

SOURCE: INCRED RESEARCH, COMPANY REPORTS


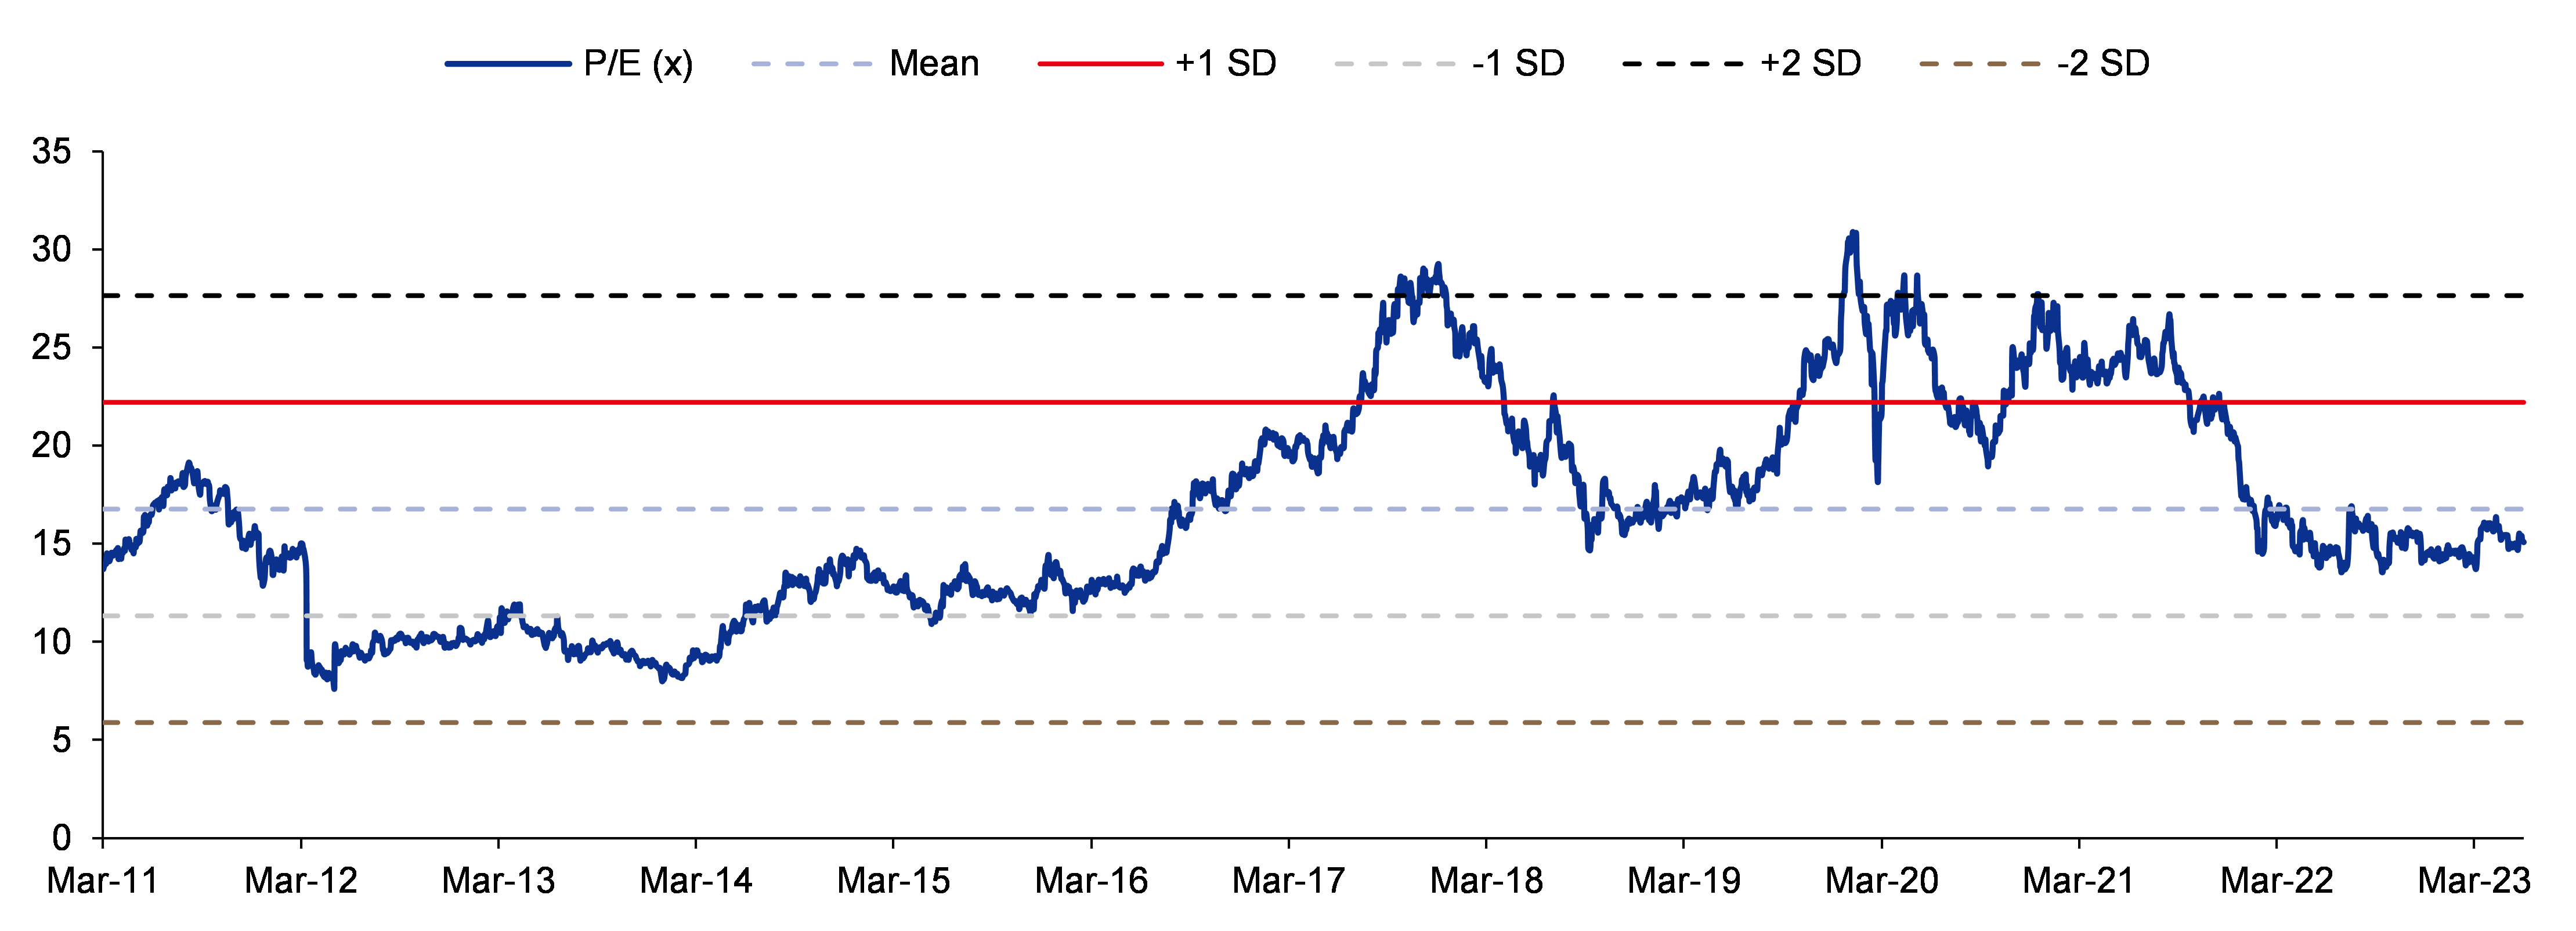
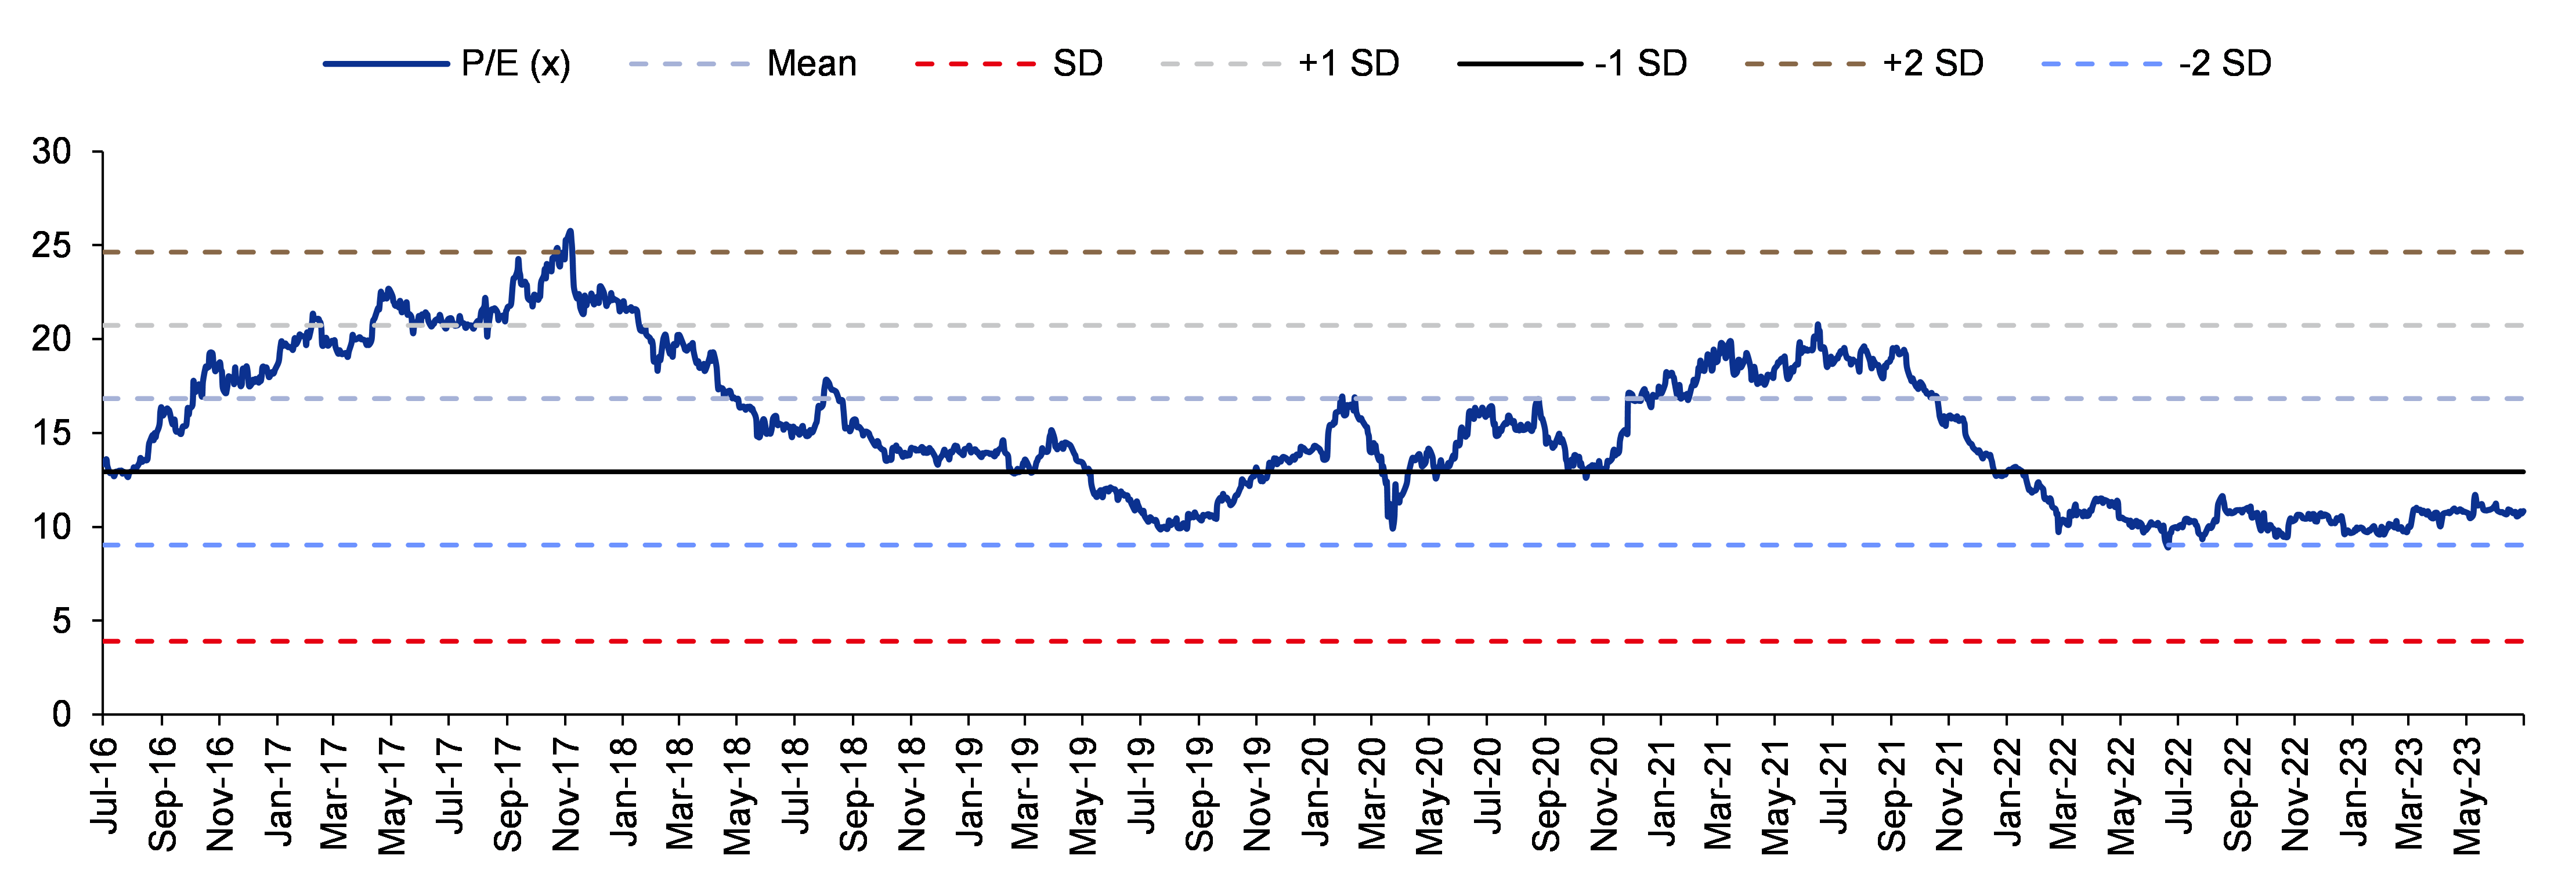
Figure 6: We have valued IGL at 18x FY25F EPS to arrive at our target price of Rs539 (18x one-year forward P/E is only at a 5% premium to the historical average)

SOURCE: INCRED RESEARCH, COMPANY REPORTS


Gujarat Gas

Stable volume may lead to positive outcome  

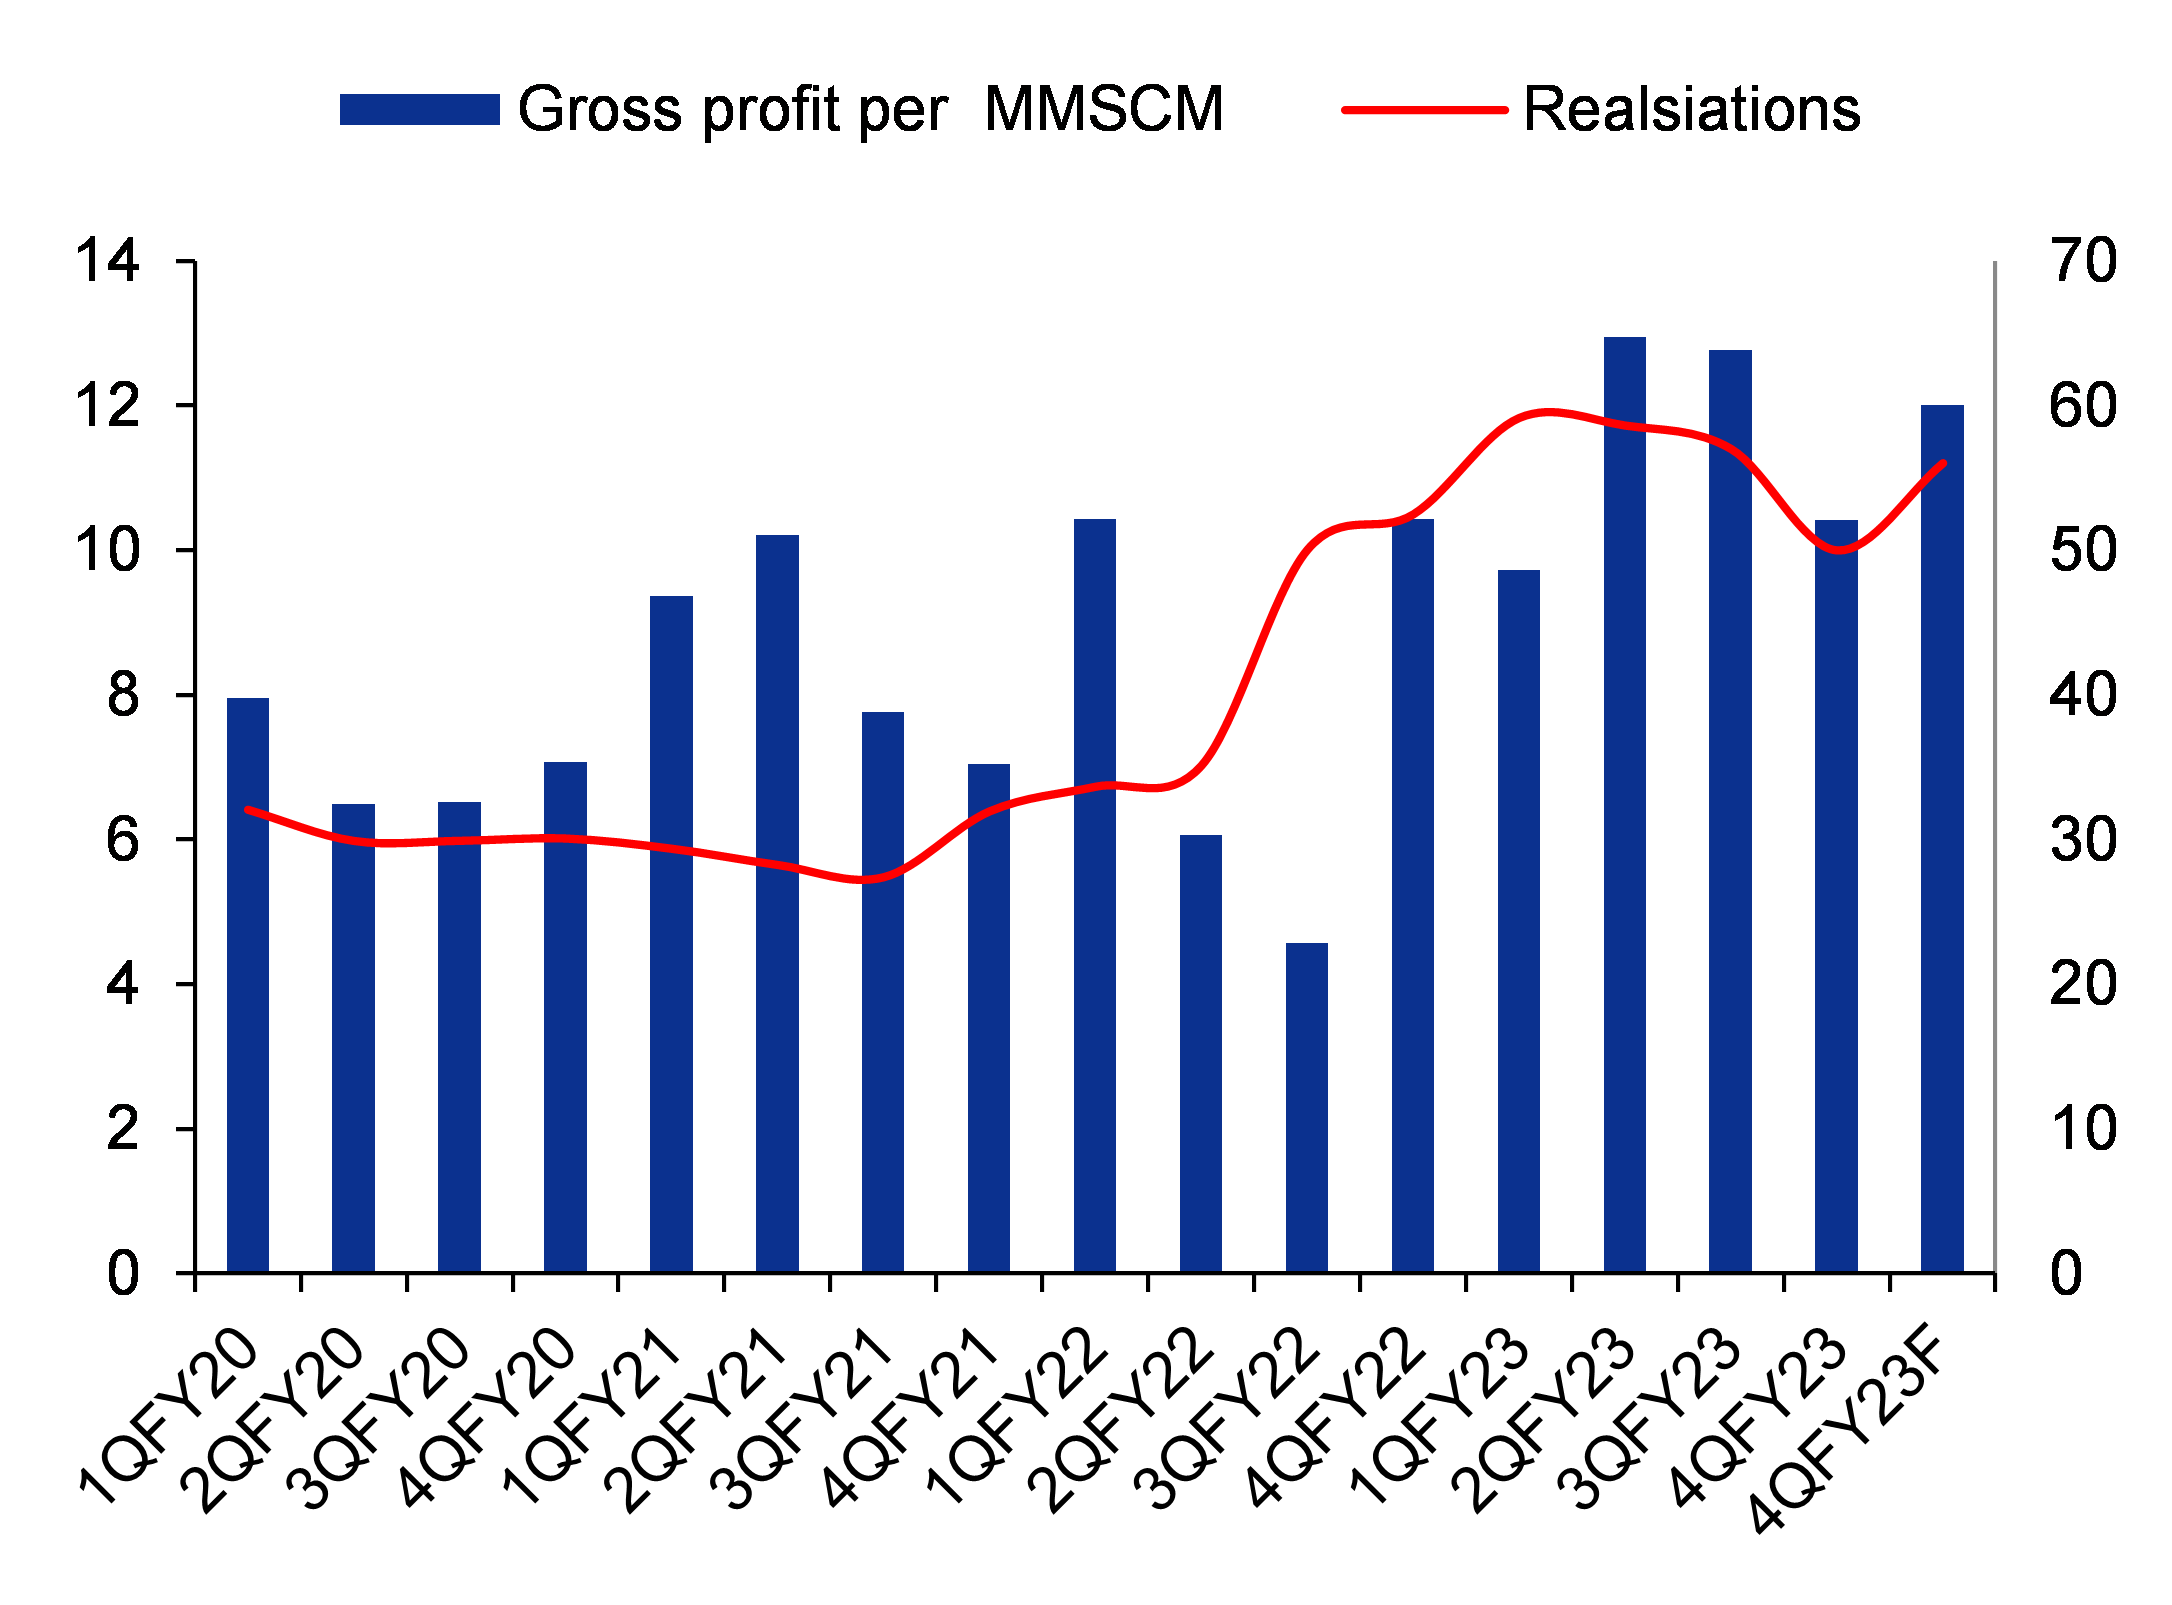
Gujarat Gas successfully managed its pricing amid intense competition from alternative fuels, resulting in a decline in margins. However, we expect improved margins in the future due to the global correction in LNG prices. The annualized gross profit per unit touched Rs11.4/scm, reflecting a YoY growth of 47.4%. For FY24F/25F, we expect the gross profit per unit for Gujarat Gas to be in the range of Rs12-12.5/scm. As a result, we have upgraded our rating on the stock to ADD (from REDUCE) with a higher target price of Rs679, based on 23x FY25F EPS.

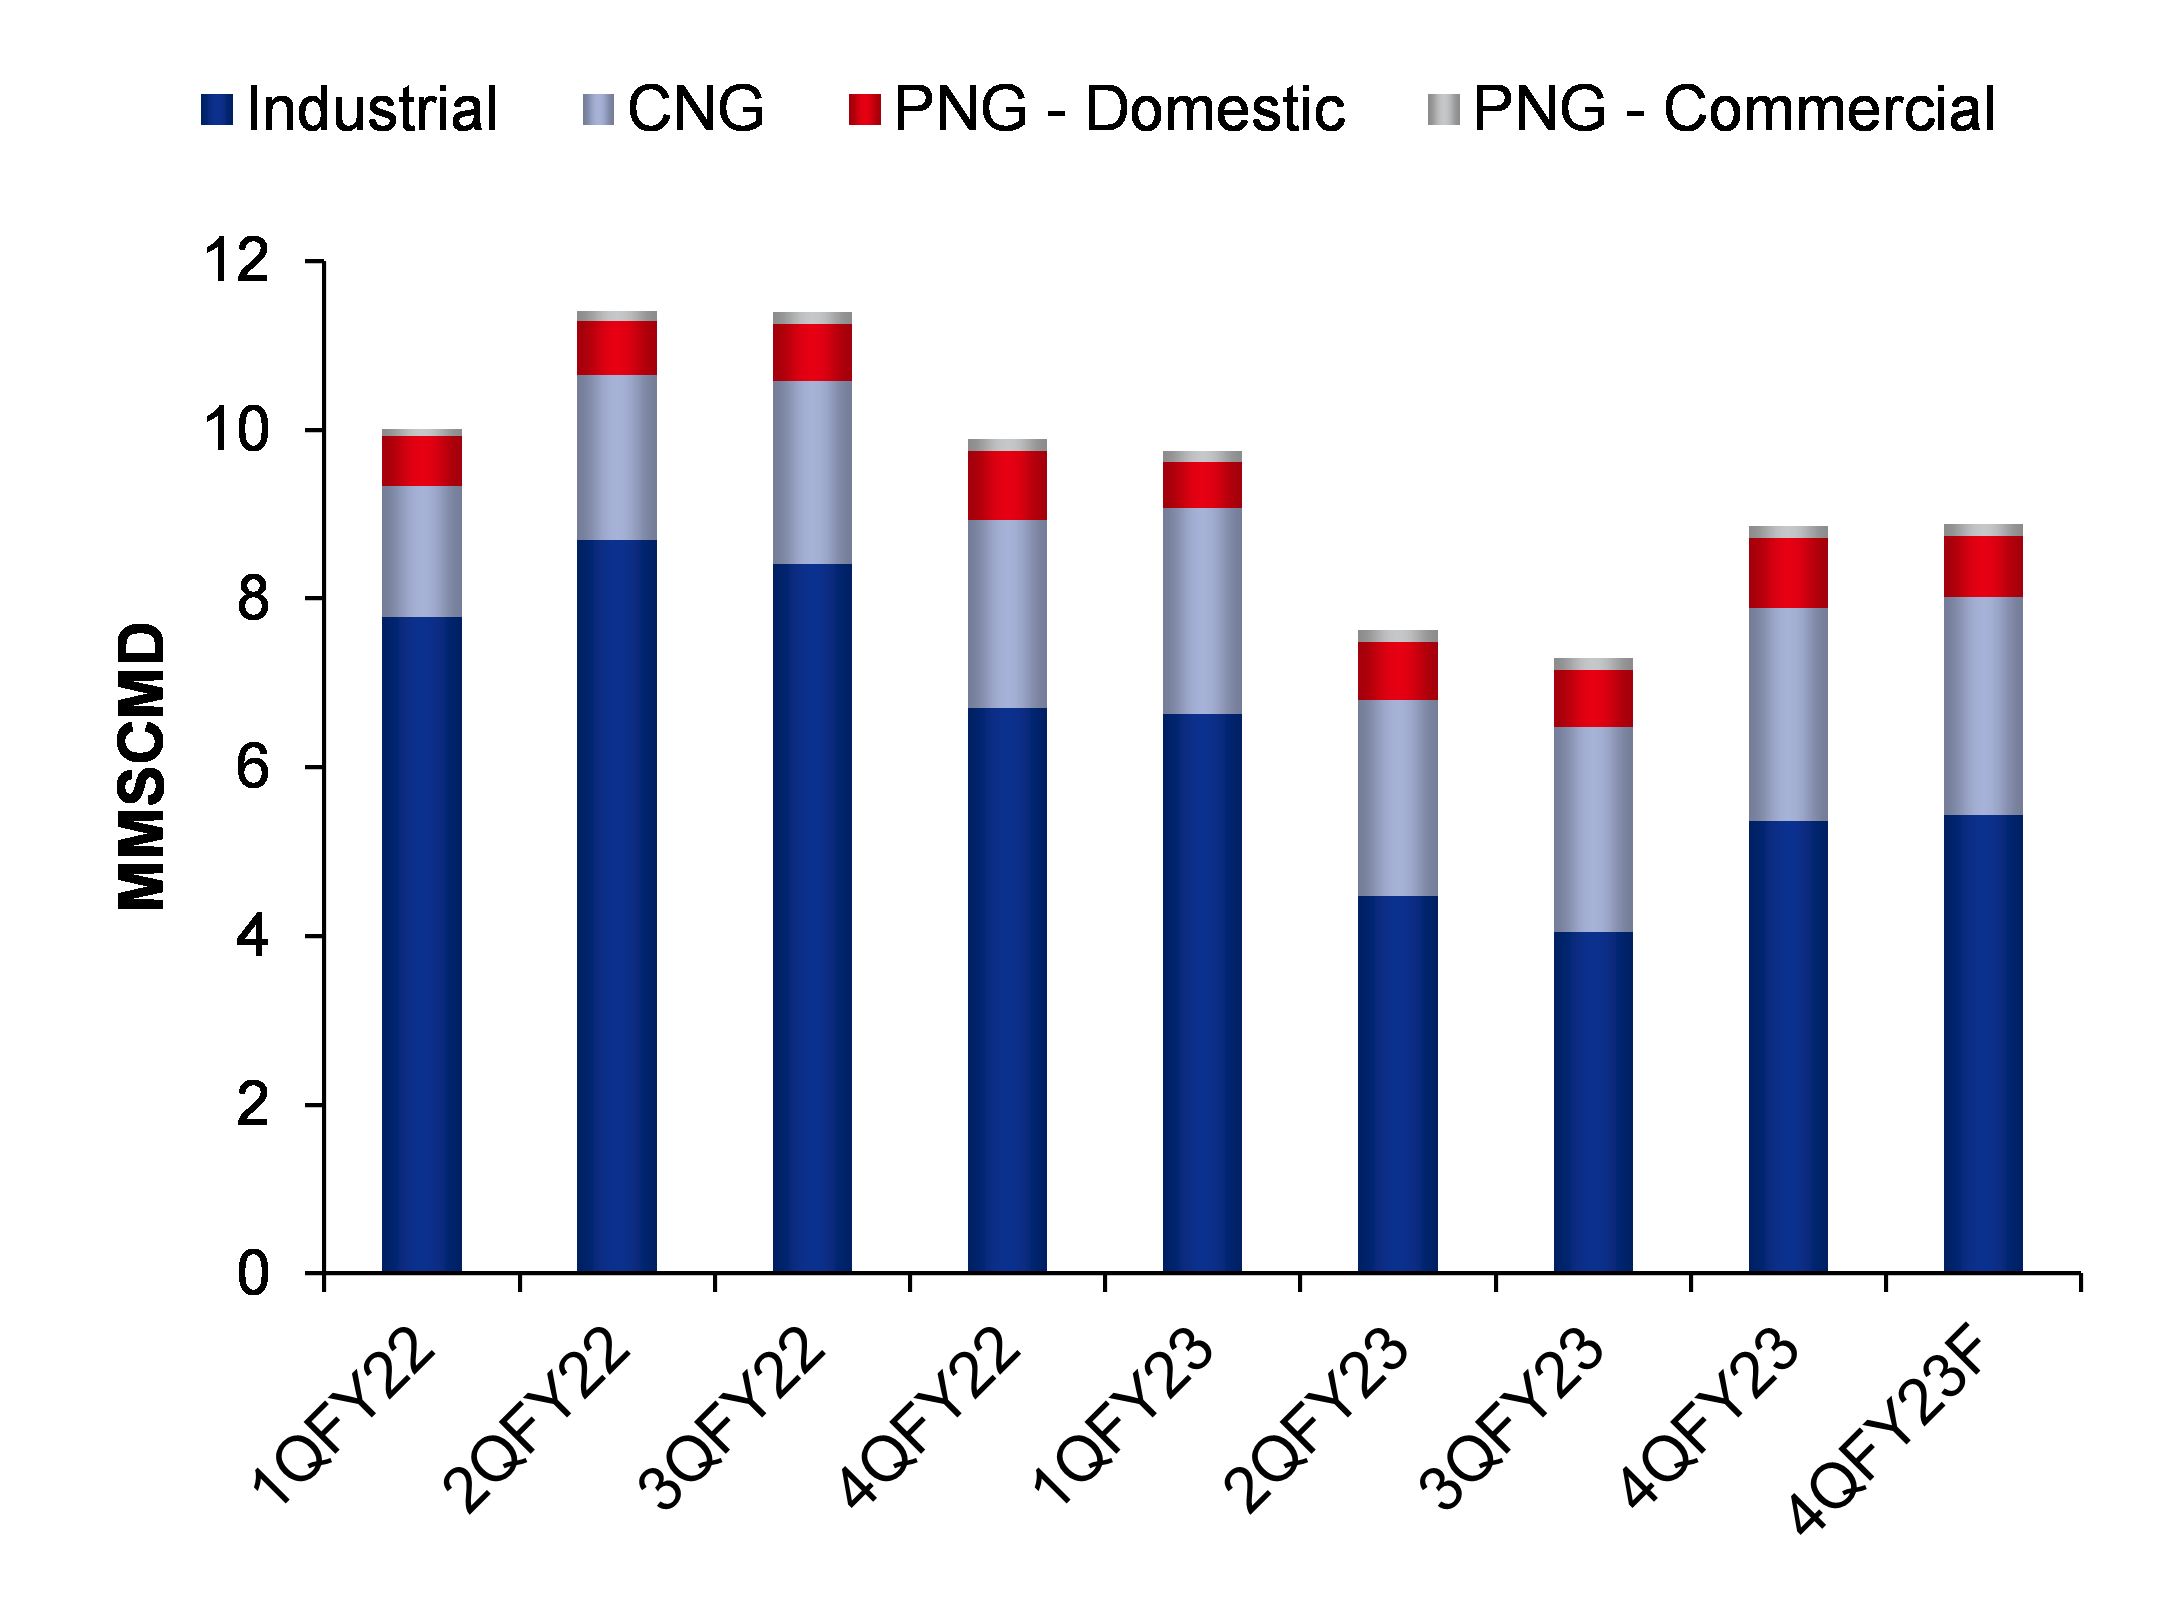
Gujarat Gas witnessed a significant increase in overall volume, reaching approximately 8.9mmscmd QoQ. This growth was primarily attributed to a favourable propane-to-gas price gap and proactive pricing measures in the industrial segment resulting in a recovery in its volume to 5.4/mmscmd in 4QFY23.

Despite the decline in propane price to Rs43.99/kg in Apr 2023, which led to Gujarat Gas’ equivalent price of around ~Rs44.7/kg, the company has taken proactive steps to reduce the industrial segment prices in Morbi by Rs9.5/scm over the past six months.

Going ahead, we expect moderate spot LNG prices, reduced APM gas cost due to price ceiling, and the momentum from new areas to drive the volume to ~9.4mmscmd in FY24F and further increase to ~10mmscmd in FY25F.

Figure 7: Gujarat Gas is expected to achieve gross profit/scm of approximately Rs12, an increase of 15% on QoQ basis

1QFY22

2QFY22

3QFY22

4QFY22

1QFY23

2QFY23

3QFY23

4QFY23

1QFY24F

YoY

QoQ

Revenue from operations

30,659

36,859

52,412

47,734

53,032

41,078

38,213

40,738

45,764

-14%

12%

Total cost of goods sold

21,154

30,498

47,631

38,239

44,304

31,998

29,650

32,250

35,958

-19%

11%

Gross profit

9,506

6,361

4,780

9,495

8,728

9,081

8,563

8,489

9,807

12%

16%

Total expenses

23,431

32,649

50,037

40,759

46,966

34,651

32,390

35,135

38,843

-17%

11%

EBITDA

7,229

4,210

2,375

6,974

6,066

6,427

5,823

5,603

6,921

14%

24%

Depreciation & amortization

905

937

969

1,021

1,032

1,064

1,093

1,094

1,094

6%

0%

EBIT

6,324

3,273

1,406

5,954

5,035

5,363

4,731

4,509

5,827

16%

29%

Other income

213

192

353

177

190

186

320

318

318

67%

0%

Finance costs

159

123

140

145

136

131

76

61

61

-55%

0%

PBT

6,378

3,343

1,619

5,867

5,089

5,418

4,974

4,766

6,084

20%

28%

Total tax

1,616

852

400

1,424

1,278

1,379

1,261

1,074

1,371

7%

28%

PAT

4,762

2,491

1,220

4,443

3,811

4,039

3,713

3,692

4,713

24%

28%


Sales volume in mmscm

1QFY22

2QFY22

3QFY22

4QFY22

1QFY23

2QFY23

3QFY23

4QFY23

1QFY24F

YoY

QoQ

PNG

708

799

774

616

610

411

373

493

500

-18%

1%

CNG

141

180

200

205

224

213

224

233

237

6%

2%

PNG - domestic

54

59

62

75

51

63

62

76

67

32%

-13%

PNG - commercial

8

11

13

13

12

13

13

13

13

12%

4%

Total sales volume

911

1,050

1,048

910

897

701

671

815

817

-9%

0%

Realization

34

35

50

52

59

59

57

50

56

-5%

12%

Gross profit/scm

10

6

5

10

10

13

13

10

12

23%

15%

EBITDA/scm

8

4

2

8

7

9

9

7

8

25%

23%


SOURCE: INCRED RESEARCH, COMPANY REPORTS


Figure 8: We expect its overall volume to be around 817mmscm, with growth remaining in line

SOURCE: INCRED RESEARCH, COMPANY REPORTS

Figure 9: We expect average realization of Rs56, a growth of 12% QoQ

SOURCE: INCRED RESEARCH, COMPANY REPORTS


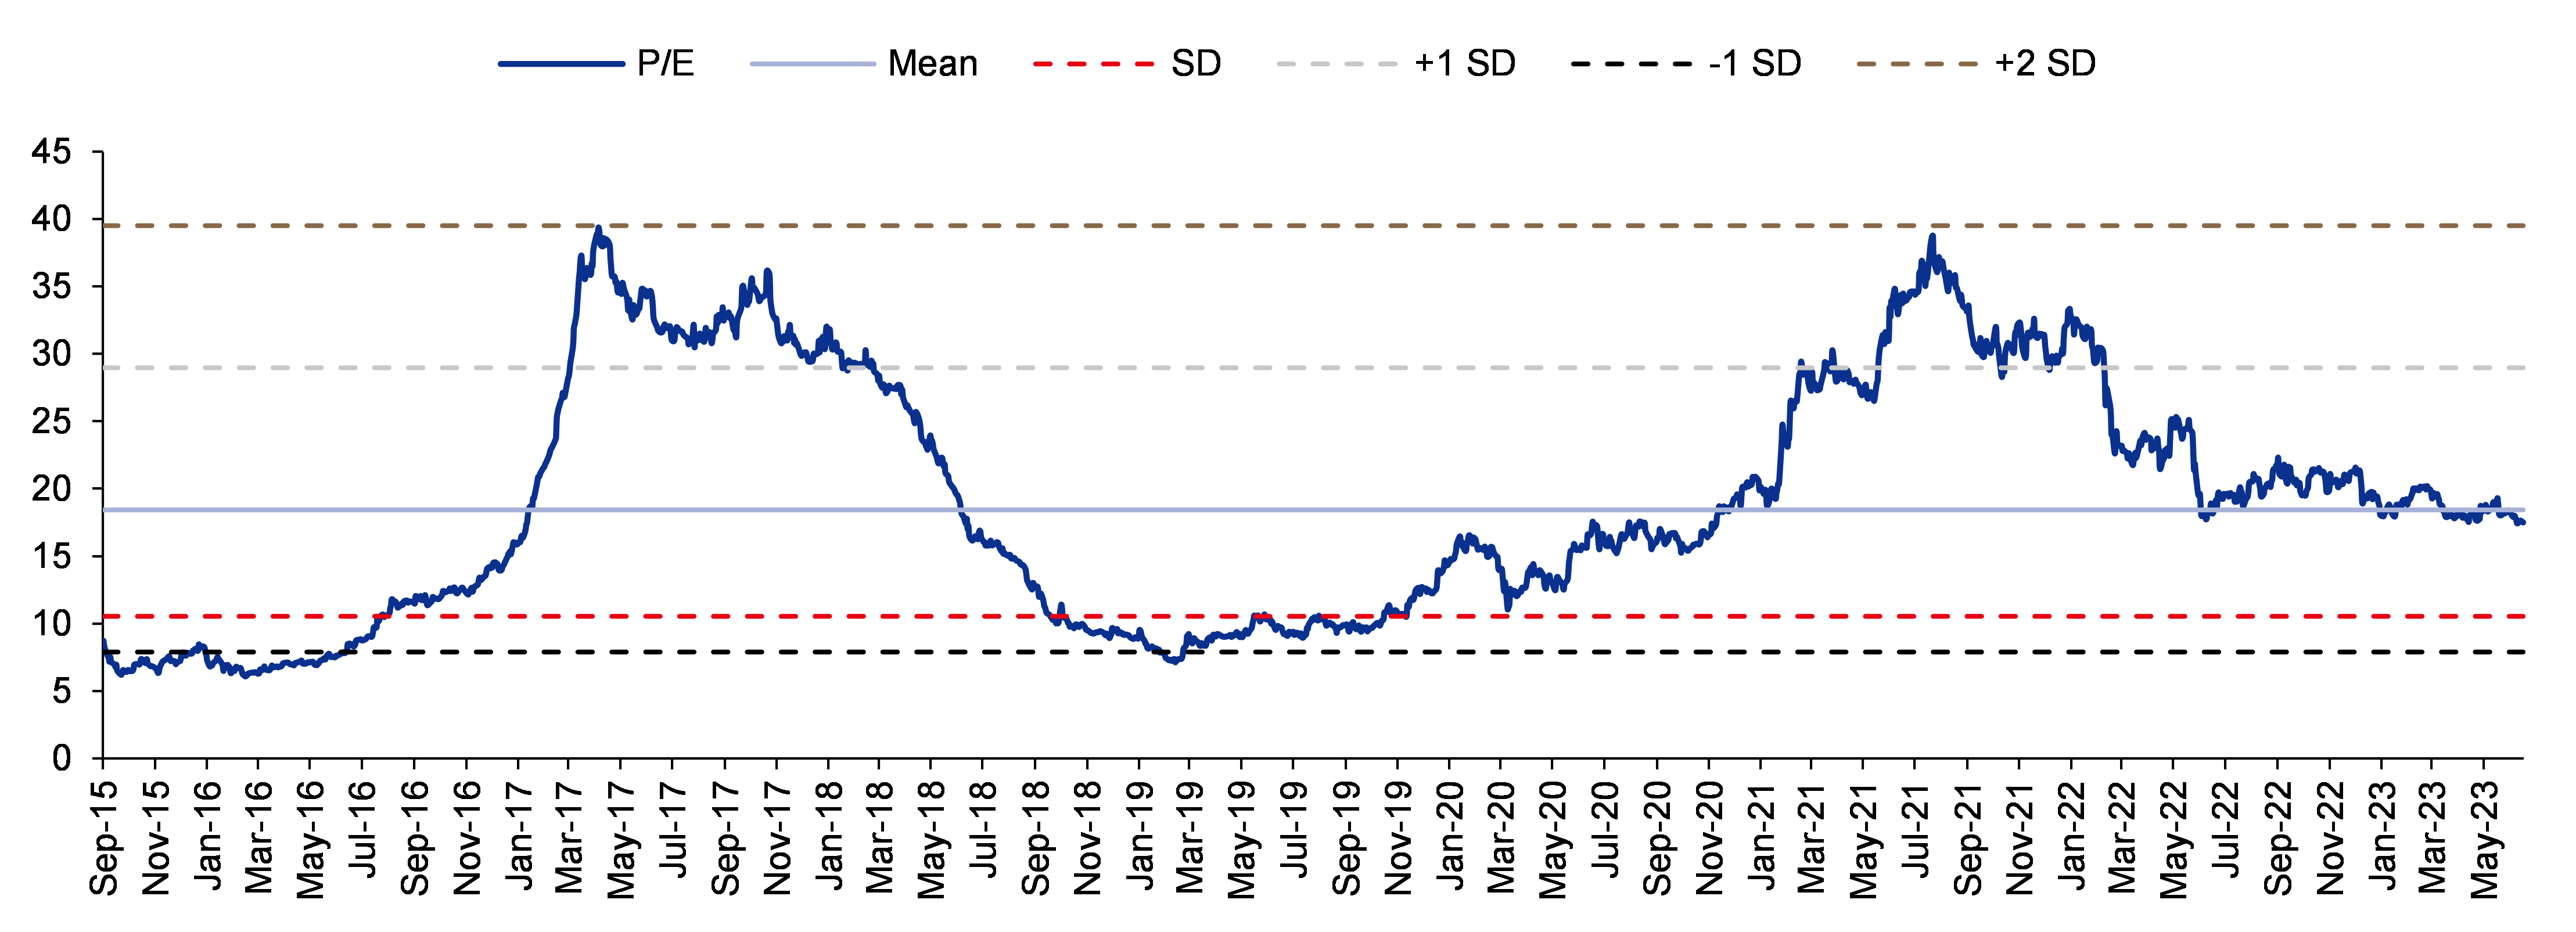
Figure 10: We have valued Gujarat Gas at 23x FY25F EPS to arrive at our target price of Rs679 (+0.5SD of long-term mean)

SOURCE: INCRED RESEARCH, COMPANY REPORTS


Mahanagar Gas

Margins set to improve further  

Mahanagar Gas (MGL) reported an annualized gross profit per unit of Rs14.9/scm, representing a YoY increase of 7.9%. The realization per unit stood at Rs55.4/scm, showing a substantial YoY increase of 56.1%. Going ahead, we estimate the gross profit per unit for FY24F/25F to be around Rs15/scm. The improvement in margins can be attributed to higher APM gas allocation, accounting for 93% of the gas supply, as well as increased CNG volume. In the light of these positive developments, we have upgraded our rating on the stock to ADD (from REDUCE earlier) and set a higher target price of Rs1,252, based on 18x FY25F EPS.

MGL implemented a new pricing formula, resulting in a reduction of CNG prices by Rs8/kg, from Rs87/kg to Rs79/kg, effective from 8 Apr 2023. Domestic PNG prices were also lowered by Rs5/scm, from Rs54/scm to Rs49/scm, with the same effective date.

MGL has actively expanded its CGD infrastructure, connecting 92,274 domestic households during the quarter and reaching a total of 2.17m households. The company laid 128km of steel and PE pipelines, bringing the aggregate length to 6,535km. Also, MGL added 12 new CNG stations, increasing the total count to 313 as of 31 Mar 2023.

The acquisition of 115 new industrial and commercial customers raised the total count to 4,558 by the end of the last financial year. In the Raigad area, MGL connected 68,033 domestic households and currently operates 28 CNG stations.

The pipeline network in Raigad was expanded by 10km, reaching a total length of 382km. MGL achieved an overall sales volume increase of 14.11% compared to the previous year, with an average sales volume of 3.423mmscmd for the year ended 31 Mar 2023, compared to 2.999mmscmd in the corresponding period last year.

Figure 11: MGL is expected to achieve gross profit per SCM of approximately Rs19, an increase of 2% QoQ and 32% YoY

1QFY22

2QFY22

3QFY22

4QFY22

1QFY23

2QFY23

3QFY23

4QFY23

1QFY24F

YoY

QoQ

Revenue from operations

6,669

9,076

11,229

11,876

15,932

17,175

18,384

17,718

19,864

25%

12%

Total cost of goods sold

2,424

4,593

8,603

8,081

11,423

13,024

14,077

12,041

13,574

19%

13%

Gross profit

4,245

4,482

2,626

3,795

4,508

4,151

4,307

5,677

6,290

40%

11%

Total expenses

3,629

6,058

10,198

9,721

13,076

14,647

15,823

13,821

15,197

16%

10%

EBITDA

3,040

3,018

1,031

2,155

2,856

2,528

2,561

3,897

4,667

63%

20%

Depreciation & amortization

453

473

482

555

537

551

585

638

638

19%

0%

EBIT

2,587

2,545

549

1,600

2,319

1,977

1,976

3,259

4,029

74%

24%

Other income

186

226

218

227

200

260

323

336

336

68%

0%

Finance costs

17

20

15

23

23

25

24

22

22

-3%

0%

PBT

2,756

2,751

752

1,804

2,496

2,213

2,274

3,573

4,343

74%

22%

Total tax

716

708

184

486

644

573

553

885

1,095

70%

24%

PAT

2,041

2,043

568

1,318

1,852

1,640

1,721

2,688

3,249

75%

21%


Volume in mmscm

1QFY22

2QFY22

3QFY22

4QFY22

1QFY23

2QFY23

3QFY23

4QFY23

1QFY24F

YoY

QoQ

CNG (scm m)

141

206

220

205

231

234

228

217

241

4%

11%

PNG - domestic (scm m)

43

42

44

43

43

43

46

46

47

10%

3%

PNG - commercial (scm m)

35

40

40

38

40

41

40

41

43

8%

6%

Total PNG (scm m)

77

82

84

80

83

84

86

87

90

9%

4%

Total Sales Volume (scm m)

218

287

304

285

314

318

314

303

331

6%

9%

Realization

31

32

37

42

51

54

59

58

60

18%

3%

Gross profit/scm

19

16

9

13

14

13

14

19

19

32%

2%

EBITDA/scm

14

10

3

8

9

8

8

13

14

55%

10%


SOURCE: INCRED RESEARCH, COMPANY REPORTS


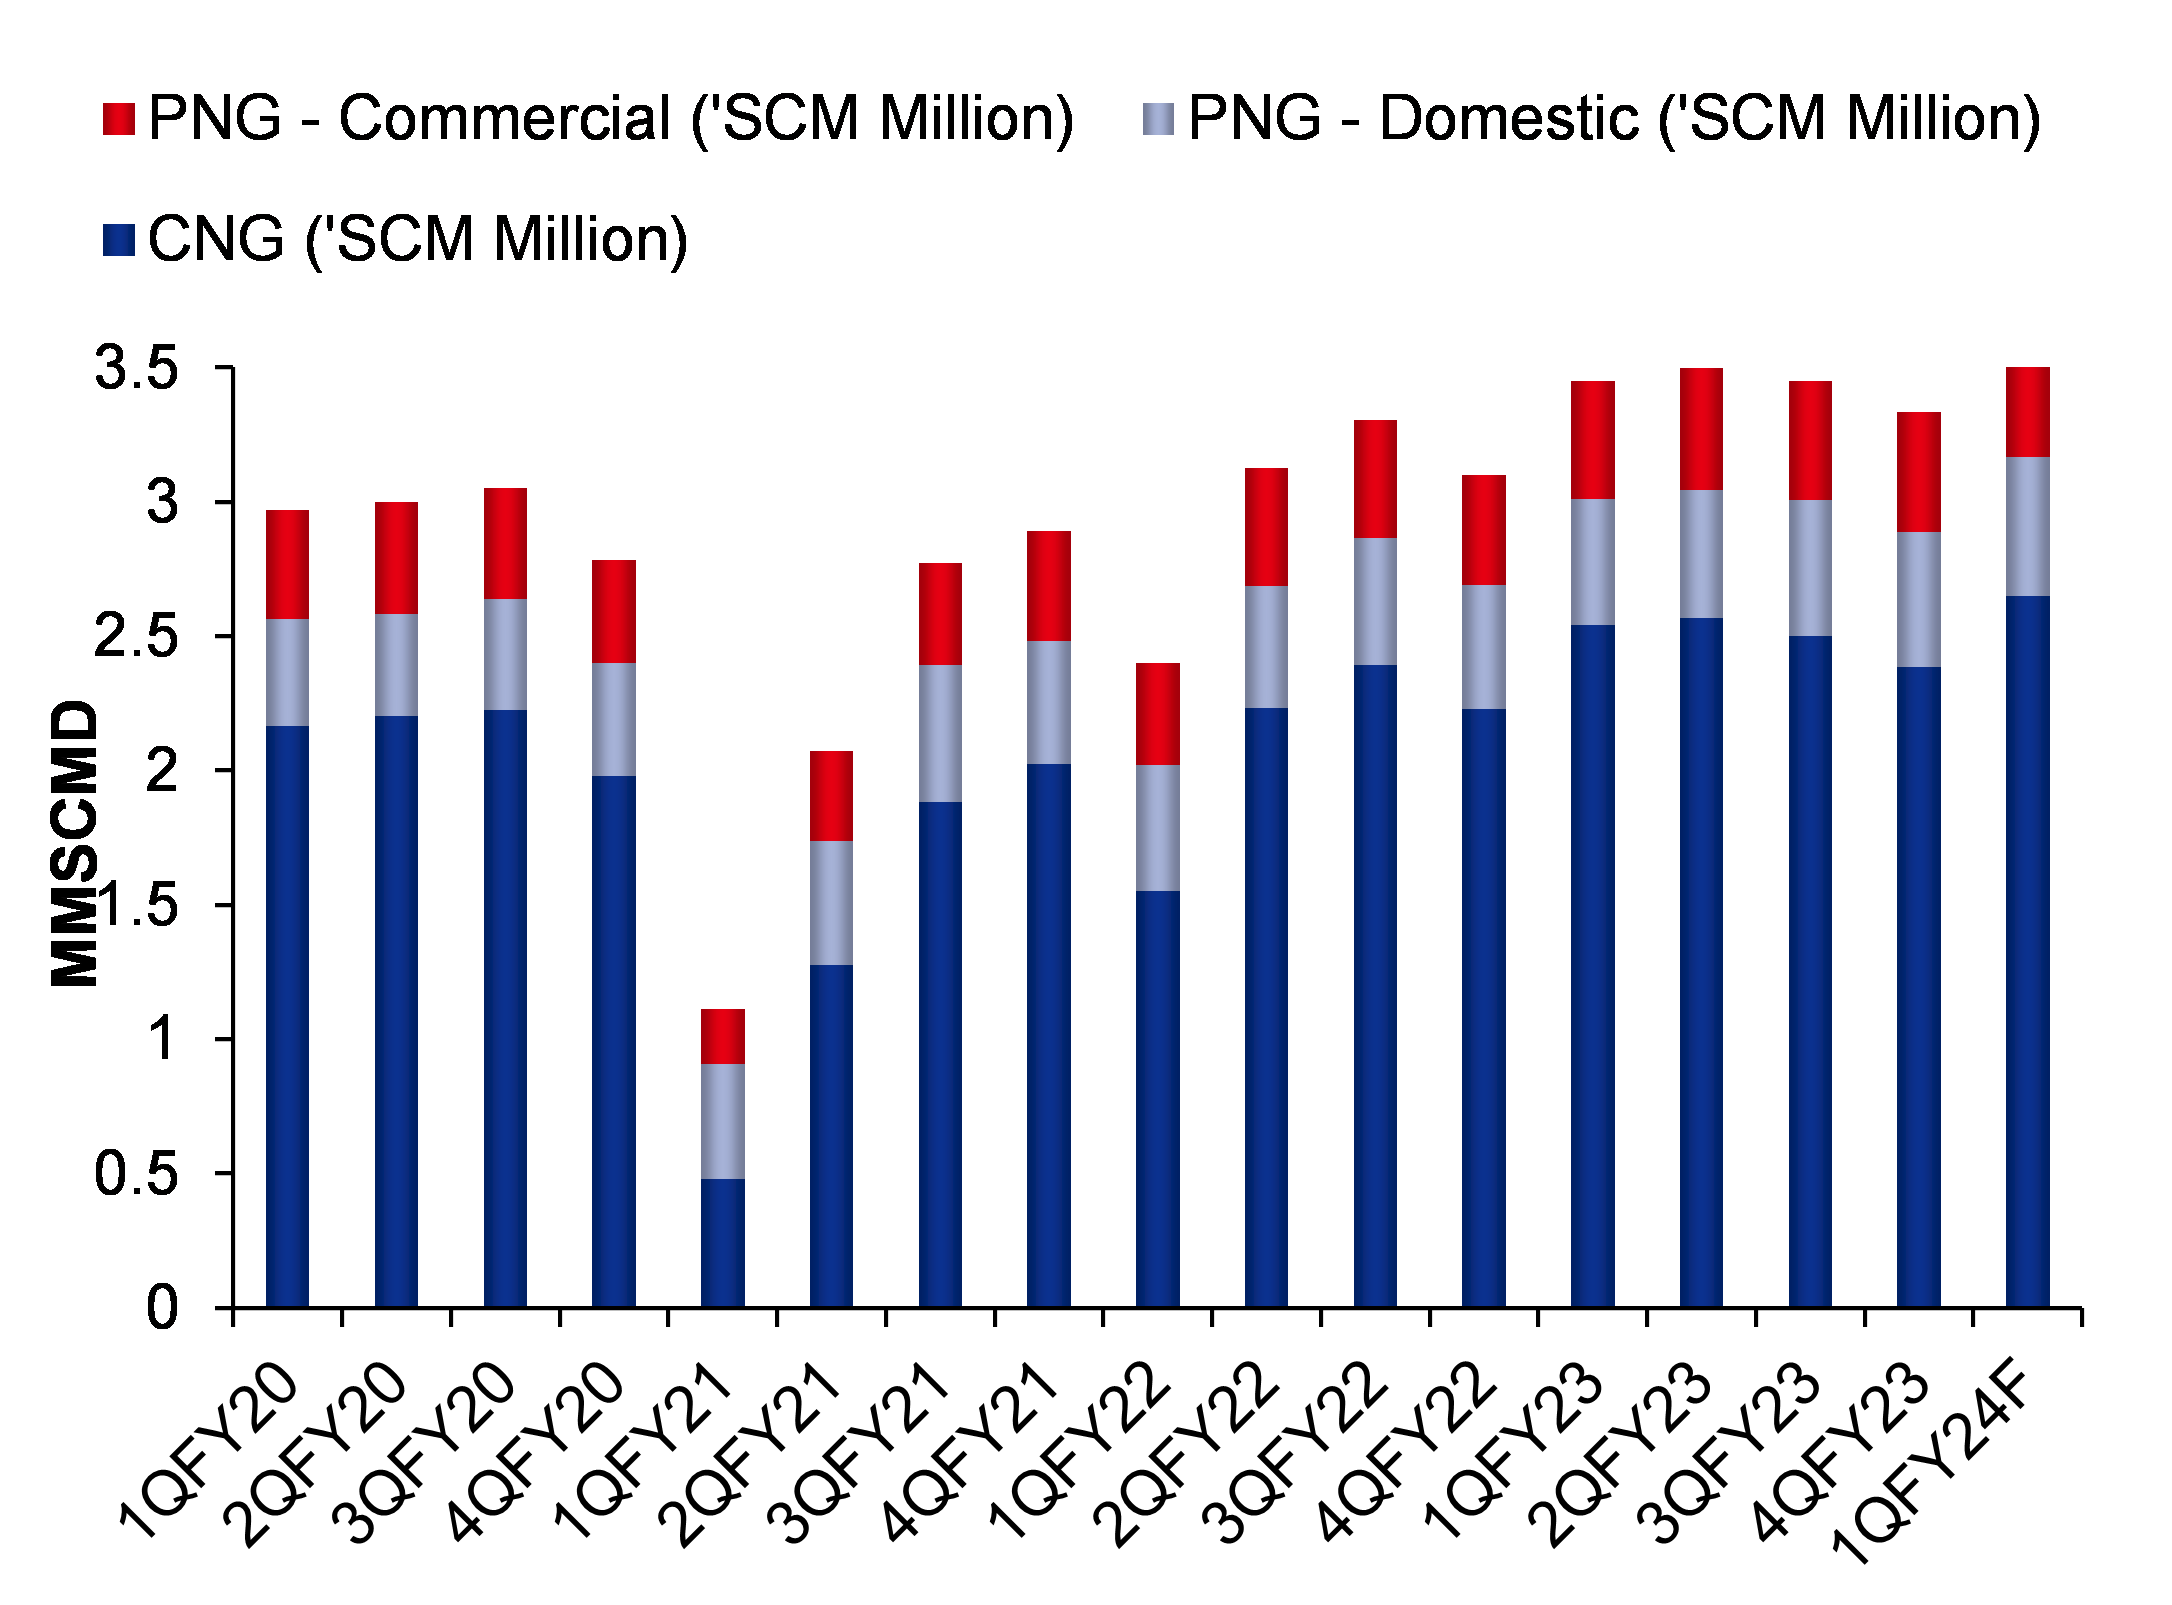
Figure 12: We expect its overall volume to be around 331mmscm, a growth of 6% & 9% on YoY & QoQ basis, respectively

SOURCE: INCRED RESEARCH, COMPANY REPORTS

Figure 13: We expect average realization of Rs60, a growth of 18% YoY, but remains in line QoQ

SOURCE: INCRED RESEARCH, COMPANY REPORTS


Figure 14: We have valued MGL at 18x one-year forward EPS to arrive at our target price of Rs1,252

SOURCE: INCRED RESEARCH, COMPANY REPORTS


DISCLAIMER

This report (including the views and opinions expressed therein, and the information comprised therein) has been prepared by Incred Research Services Private Ltd.(formerly known as Earnest Innovation Partners Private Limited) (hereinafter referred to as “ IRSPL”). IRSPL is registered with SEBI as a Research Analyst vide Registration No. INH000007793. Pursuant to a trademark agreement, IRSPL has adopted “Incred Equities ” as its trademark for use in this report.

The term “IRSPL” shall, unless the context otherwise requires, mean IRSPL and its affiliates, subsidiaries and related companies. This report is not directed or intended for distribution to or use by any person or entity resident in a state, country or any jurisdiction, where such distribution, publication, availability or use would be contrary to law, regulation or which would subject IRSPL and its affiliates/group companies to registration or licensing requirements within such jurisdictions.

This report is being supplied to you strictly on the basis that it will remain confidential. No part of this report may be (i) copied, photocopied, duplicated, stored or reproduced in any form by any means; or (ii) redistributed or passed on, directly or indirectly, to any other person in whole or in part, for any purpose without the prior written consent of IRSPL.

The information contained in this report is prepared from data believed to be correct and reliable at the time of issue of this report.

IRSPL is not required to issue regular reports on the subject matter of this report at any frequency and it may cease to do so or change the periodicity of reports at any time. IRSPL is not under any obligation to update this report in the event of a material change to the information contained in this report. IRSPL has not any and will not accept any, obligation to (i) check or ensure that the contents of this report remain current, reliable or relevant; (ii) ensure that the content of this report constitutes all the information a prospective investor may require; (iii) ensure the adequacy, accuracy, completeness, reliability or fairness of any views, opinions and information, and accordingly, IRSPL and its affiliates/group companies (and their respective directors, associates, connected persons and/or employees) shall not be liable in any manner whatsoever for any consequences (including but not limited to any direct, indirect or consequential losses, loss of profits and damages) of any reliance thereon or usage thereof.

Unless otherwise specified, this report is based upon reasonable sources. Such sources will, unless otherwise specified, for market data, be market data and prices available from the main stock exchange or market where the relevant security is listed, or, where appropriate, any other market. Information on the accounts and business of company(ies) will generally be based on published statements of the company(ies), information disseminated by regulatory information services, other publicly available information and information resulting from our research. Whilst every effort is made to ensure that statements of facts made in this report are accurate, all estimates, projections, forecasts, expressions of opinion and other subjective judgments contained in this report are based on assumptions considered to be reasonable as of the date of the document in which they are contained and must not be construed as a representation that the matters referred to therein will occur. Past performance is not a reliable indicator of future performance. The value of investments may go down as well as up and those investing may, depending on the investments in question, lose more than the initial investment. No report shall constitute an offer or an invitation by or on behalf of IRSPL and its affiliates/group companies to any person to buy or sell any investments.

The opinions expressed are based on information which are believed to be accurate and complete and obtained through reliable public or other non-confidential sources at the time made. (Information barriers and other arrangements may be established where necessary to prevent conflicts of interests arising. However, the analyst(s) may receive compensation that is based on his/their coverage of company(ies) in the performance of his/their duties or the performance of his/their recommendations. In reviewing this report, an investor should be aware that any or all of the foregoing, among other things, may give rise to real or potential conflicts of interest. Additional information is, subject to the duties of confidentiality, available on request.

The report is not a “prospectus” as defined under Indian Law, including the Companies Act, 2013, and is not, and shall not be, approved by, or filed or registered with, any Indian regulator, including any Registrar of Companies in India, SEBI, any Indian stock exchange, or the Reserve Bank of India. No offer, or invitation to offer, or solicitation of subscription with respect to any such securities listed or proposed to be listed in India is being made, or intended to be made, to the public, or to any member or section of the public in India, through or pursuant to this report.

The research analysts, strategists or economists principally responsible for the preparation of this research report are segregated from the other activities of IRSPL. Information barriers and other arrangements have been established, as required, to prevent any conflicts of interests.

The research analysts, strategists or economists principally responsible for the preparation of this research report are segregated from the other activities of IRSPL. Information barriers and other arrangements have been established, as required, to prevent any conflicts of interests.

IRSPL may have issued other reports (based on technical analysis, event specific, short term views etc.) that are inconsistent with and reach different conclusion from the information presented in this report.

Holding of Analysts/Relatives of Analysts, IRSPL and Associates of IRSPL in the covered securities, as on the date of publishing of this report

Analyst/ Relative Entity/ Associates
any financial interests in the company covered in this report (subject company) and nature of such financial interest NO NO
actual/beneficial ownership of 1% or more in securities of the subject company at the end of the month immediately preceding the date of publication of the research report or date of the public appearance; NO NO
any other material conflict of interest at the time of publication of the research report or at the time of public appearance NO NO
received any compensation from the subject company in the past twelve months for investment banking or merchant banking or brokerage services or investment advisory or depository or distribution from the subject company in the last twelve months for products/services other than investment banking or merchant banking or broker- age services or investment advisory or depository or distribution from the subject company in the last twelve months NO NO
managed or co-managed public offering of securities for the subject company in the last twelve months NO NO
received any compensation or other benefits from the subject company or third party in connection with the research report NO NO
served as an officer, director or employee of the subject company NO NO
been engaged in market making activity for the subject company NO NO
Analyst declaration
  • The analyst responsible for the production of this report hereby certifies that the views expressed herein accurately and exclusively reflect his or her personal views and opinions about any and all of the issuers or securities analysed in this report and were prepared independently and autonomously in an unbiased manner.
  • No part of the compensation of the analyst(s) was, is, or will be directly or indirectly related to the inclusion of specific recommendations(s) or view(s) in this report or based any specific investment banking transaction.
  • The analyst(s) has(have) not had any serious disciplinary action taken against him/her(them). • The analyst, strategist, or economist does not have any material conflict of interest at the time of
  • publication of this report.
  • The analyst(s) has(have) received compensation based upon various factors, including quality, accuracy and value of research, overall firm performance, client feedback and competitive factors.

IRSPL and/or its affiliates and/or its Directors/employees may own or have positions in securities of the company(ies) covered in this report or any securities related thereto and may from time to time add to or dispose of, or may be materially interested in, any such securities.

IRSPL and/or its affiliates and/or its Directors/employees may do and seek to do business with the company(ies) covered in this research report and may from time to time (a) buy/sell the securities covered in this report, from time to time and/or (b) act as market maker or have assumed an underwriting commitment in securities of such company(ies), and/or (c) may sell them to or buy them from customers on a principal basis and/or (d) may also perform or seek to perform significant investment banking, advisory, underwriting or placement services for or relating to such company(ies) and/or (e) solicit such investment, advisory or other services from any entity mentioned in thisreport and/or (f) act as a lender/borrower to such company and may earn brokerage or other compensation. However, Analysts are forbidden to acquire, on their own account or hold securities (physical or uncertificated, including derivatives) of companies in respect of which they are compiling and producing financial recommendations or in the result of which they play a key part.