India

Overweight (no change)

Highlighted Companies

Oil & Natural Gas
ADD, TP Rs221, Rs134 close

We build in US$65/bbl crude oil price in our long-term realization assumption for ONGC. Reiterate Add rating on it with potential of a 59% upside and with a dividend yield of 7% provides a grasp to the stock.

Oil India
ADD, TP Rs261, Rs185 close

We are bullish on crude oil and see Brent price staying still and hence, reiterate Add rating on Oil India. Downside risk to our estimates and target price is the complete collapse of crude oil price to below US$60/bbl.


P/E (x)

Summary Valuation Metrics

P/E (x) Mar22-F Mar23-F Mar24-F
Oil & Natural Gas 3.54 3.63 3.72
Oil India 3.56 2.99 3.25
P/BV (x) Mar22-F Mar23-F Mar24-F
Oil & Natural Gas 0.47 0.58 0.52
Oil India 0.72 0.62 0.55
Dividend Yield
Oil & Natural Gas 10.47% 8.97% 7.48%
Oil India 6.49% 7.57% 6.49%
Analyst(s)

Satish KUMAR

T (91) 22 4161 1562
E satish.kumar@incredcapital.com

Abbas PUNJANI
T (91) 22 4161 1562
E abbas.punjani@incredcapital.com

Brent crude may not fall below US$80-85/bbl

Geopolitics, lack of investment in oil assets, dwindling strategic petroleum reserves (SPR) as well as the OPEC’s own financial condition means that Brent crude oil prices are unlikely to remain below US$80-85 for a long time.

Fall in Chinese diesel exports, its formidable presence in Gulf of Aden (Djibouti) and Persia (Gwadar) necessitates the need for higher SPR.

We are bullish on crude oil. We build in US$65/bbl realization assumption and rate ONGC and OIL as strong Add-rated stocks in our coverage universe.

SPR requirement for western economies is higher

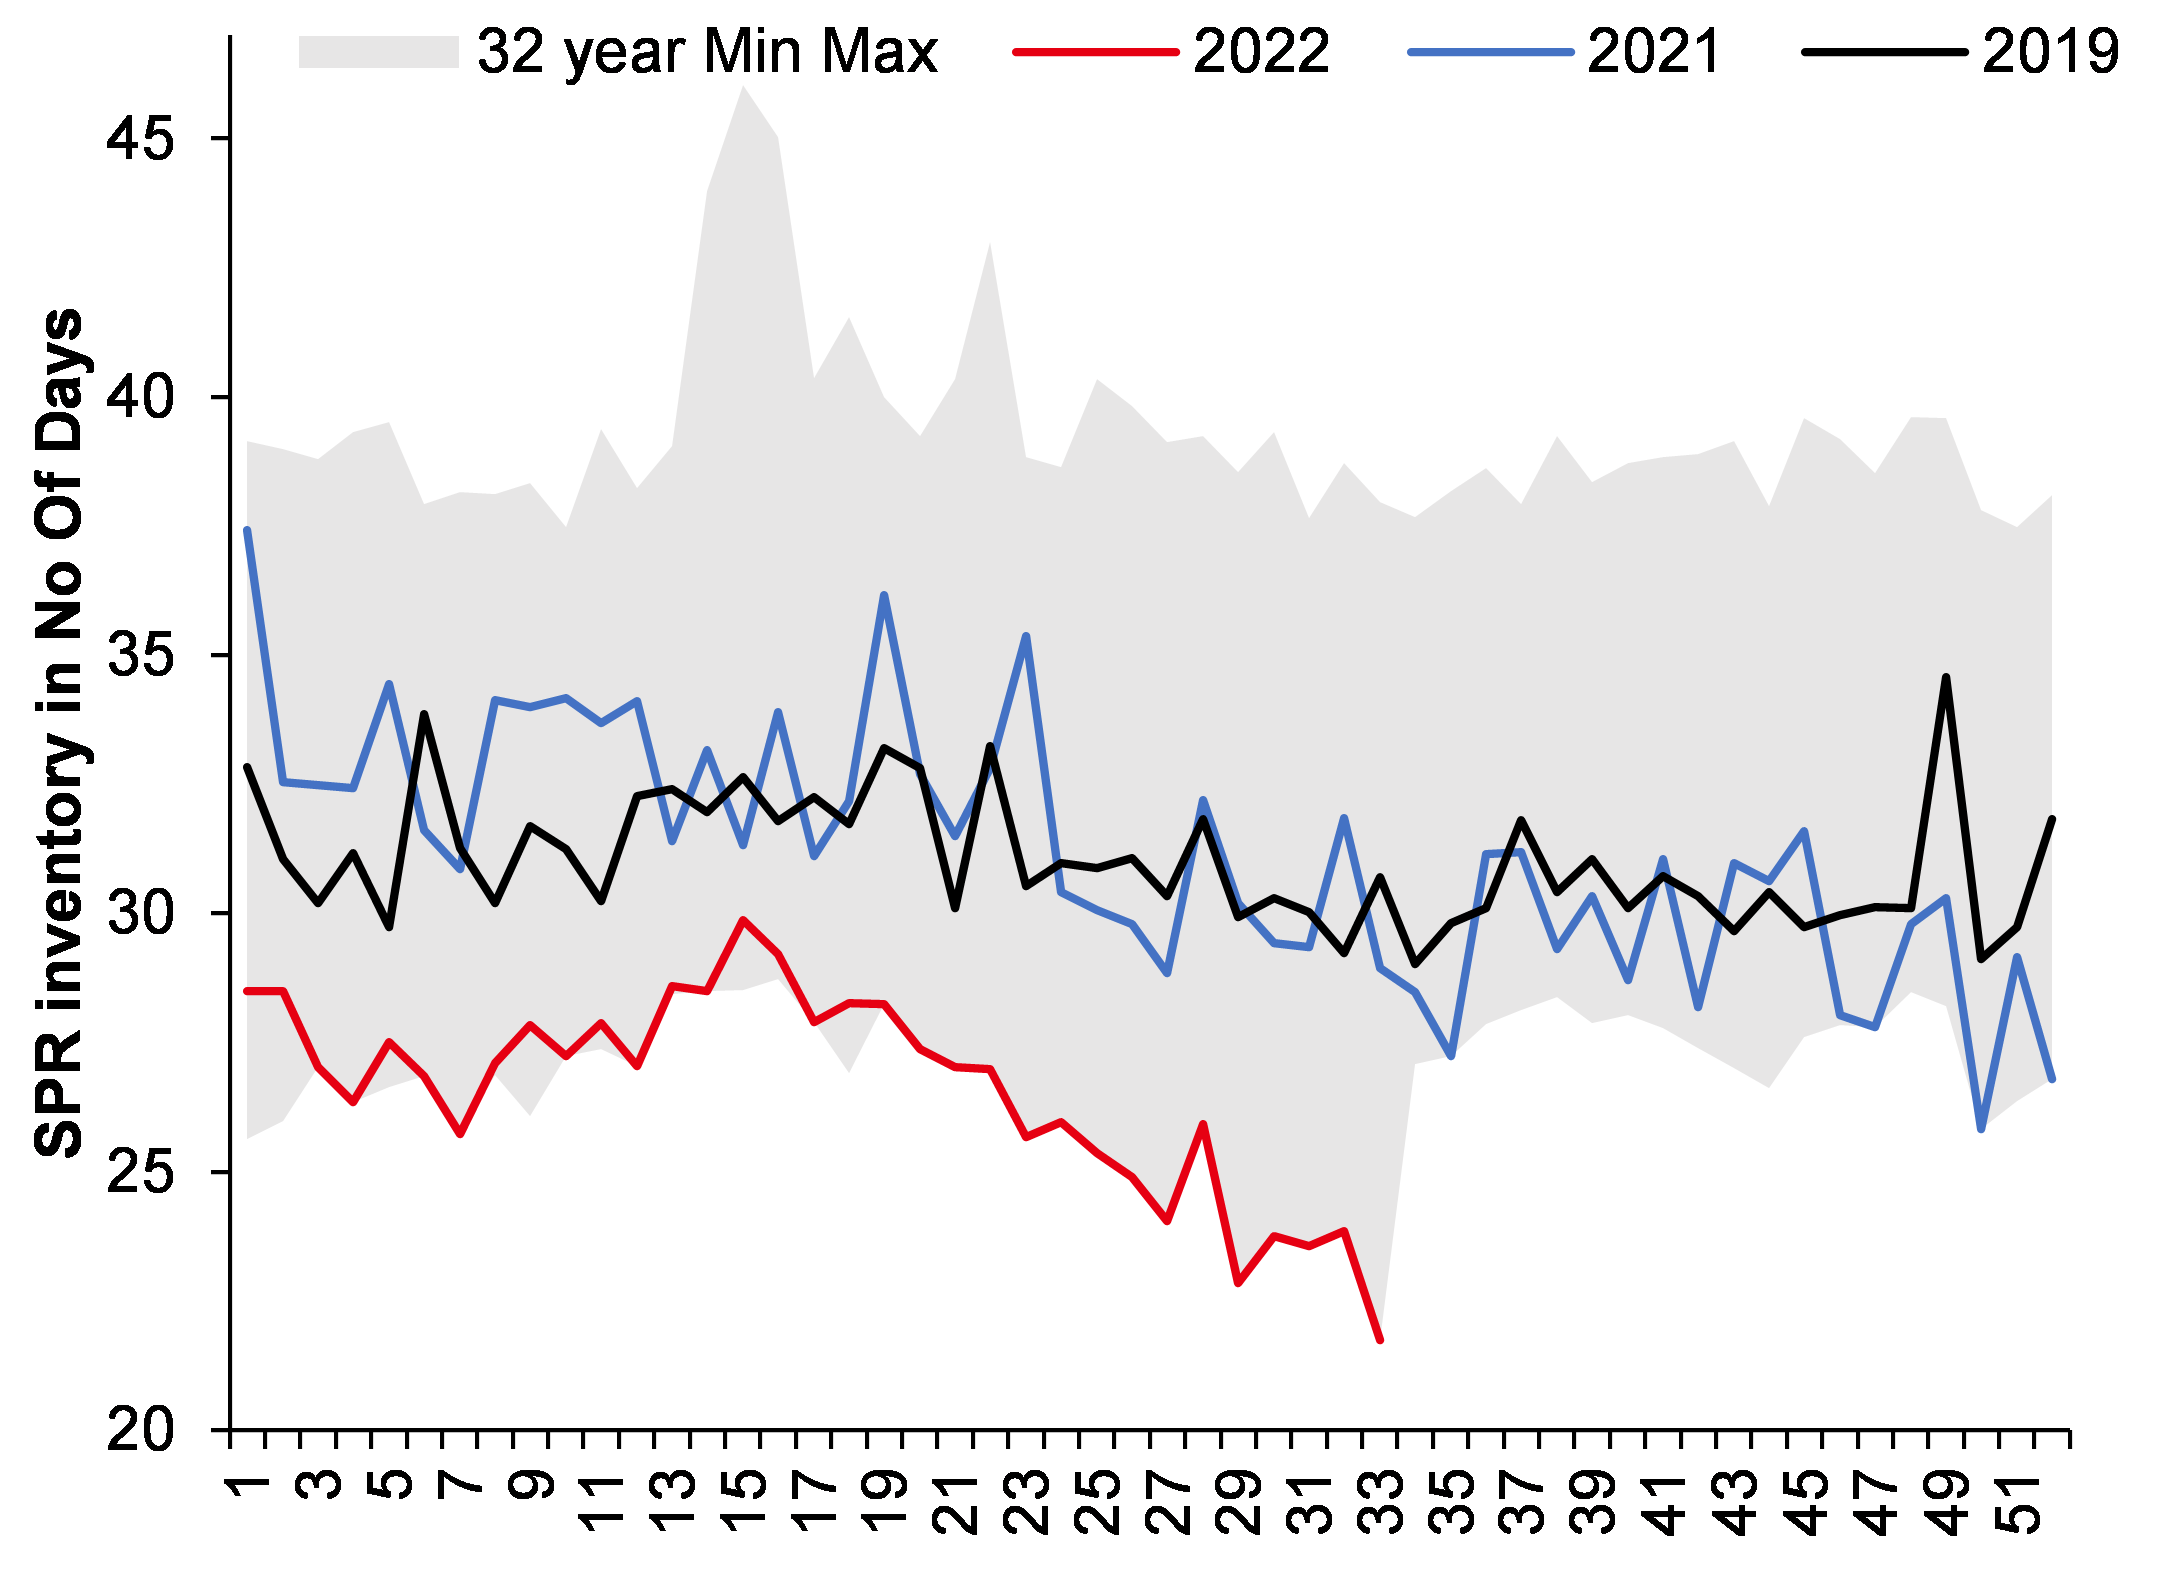
USA and OECD countries have reduced their SPR inventory to 25 days. While USA is hedged in a way as it can procure sour crude oil from Canada, Europe is not that lucky. The way USA has gone all out to help Europe in its liquefied natural gas or LNG quest makes us believe that in case Europe’s insurance policy (SPR) is not enough, then USA will come to its rescue. In that scenario, may be the current drawdown of inventory is nearing its end. Please note that after Russian crude oil stoppage, almost 50% of inbound European crude oil will come from Gulf of Peris and Aden where the Chinese presence is high (Djibouti in Gulf of Aden and Gwadar at the mouth of Gulf of Persia). We don’t think China will risk antagonizing OPEC by destroying its Europe/USA bound cargo but it can always do supply disruption by creating chaos (like South China Sea) which will be good enough for spreading fear across USA and Europe.  While this is our base case, China President Xi’s irrationality has little limits and hence, OECD countries need a bigger insurance policy. Therefore, the release of SPR cannot continue for long.

ESG has led to lack of investment in oil assets

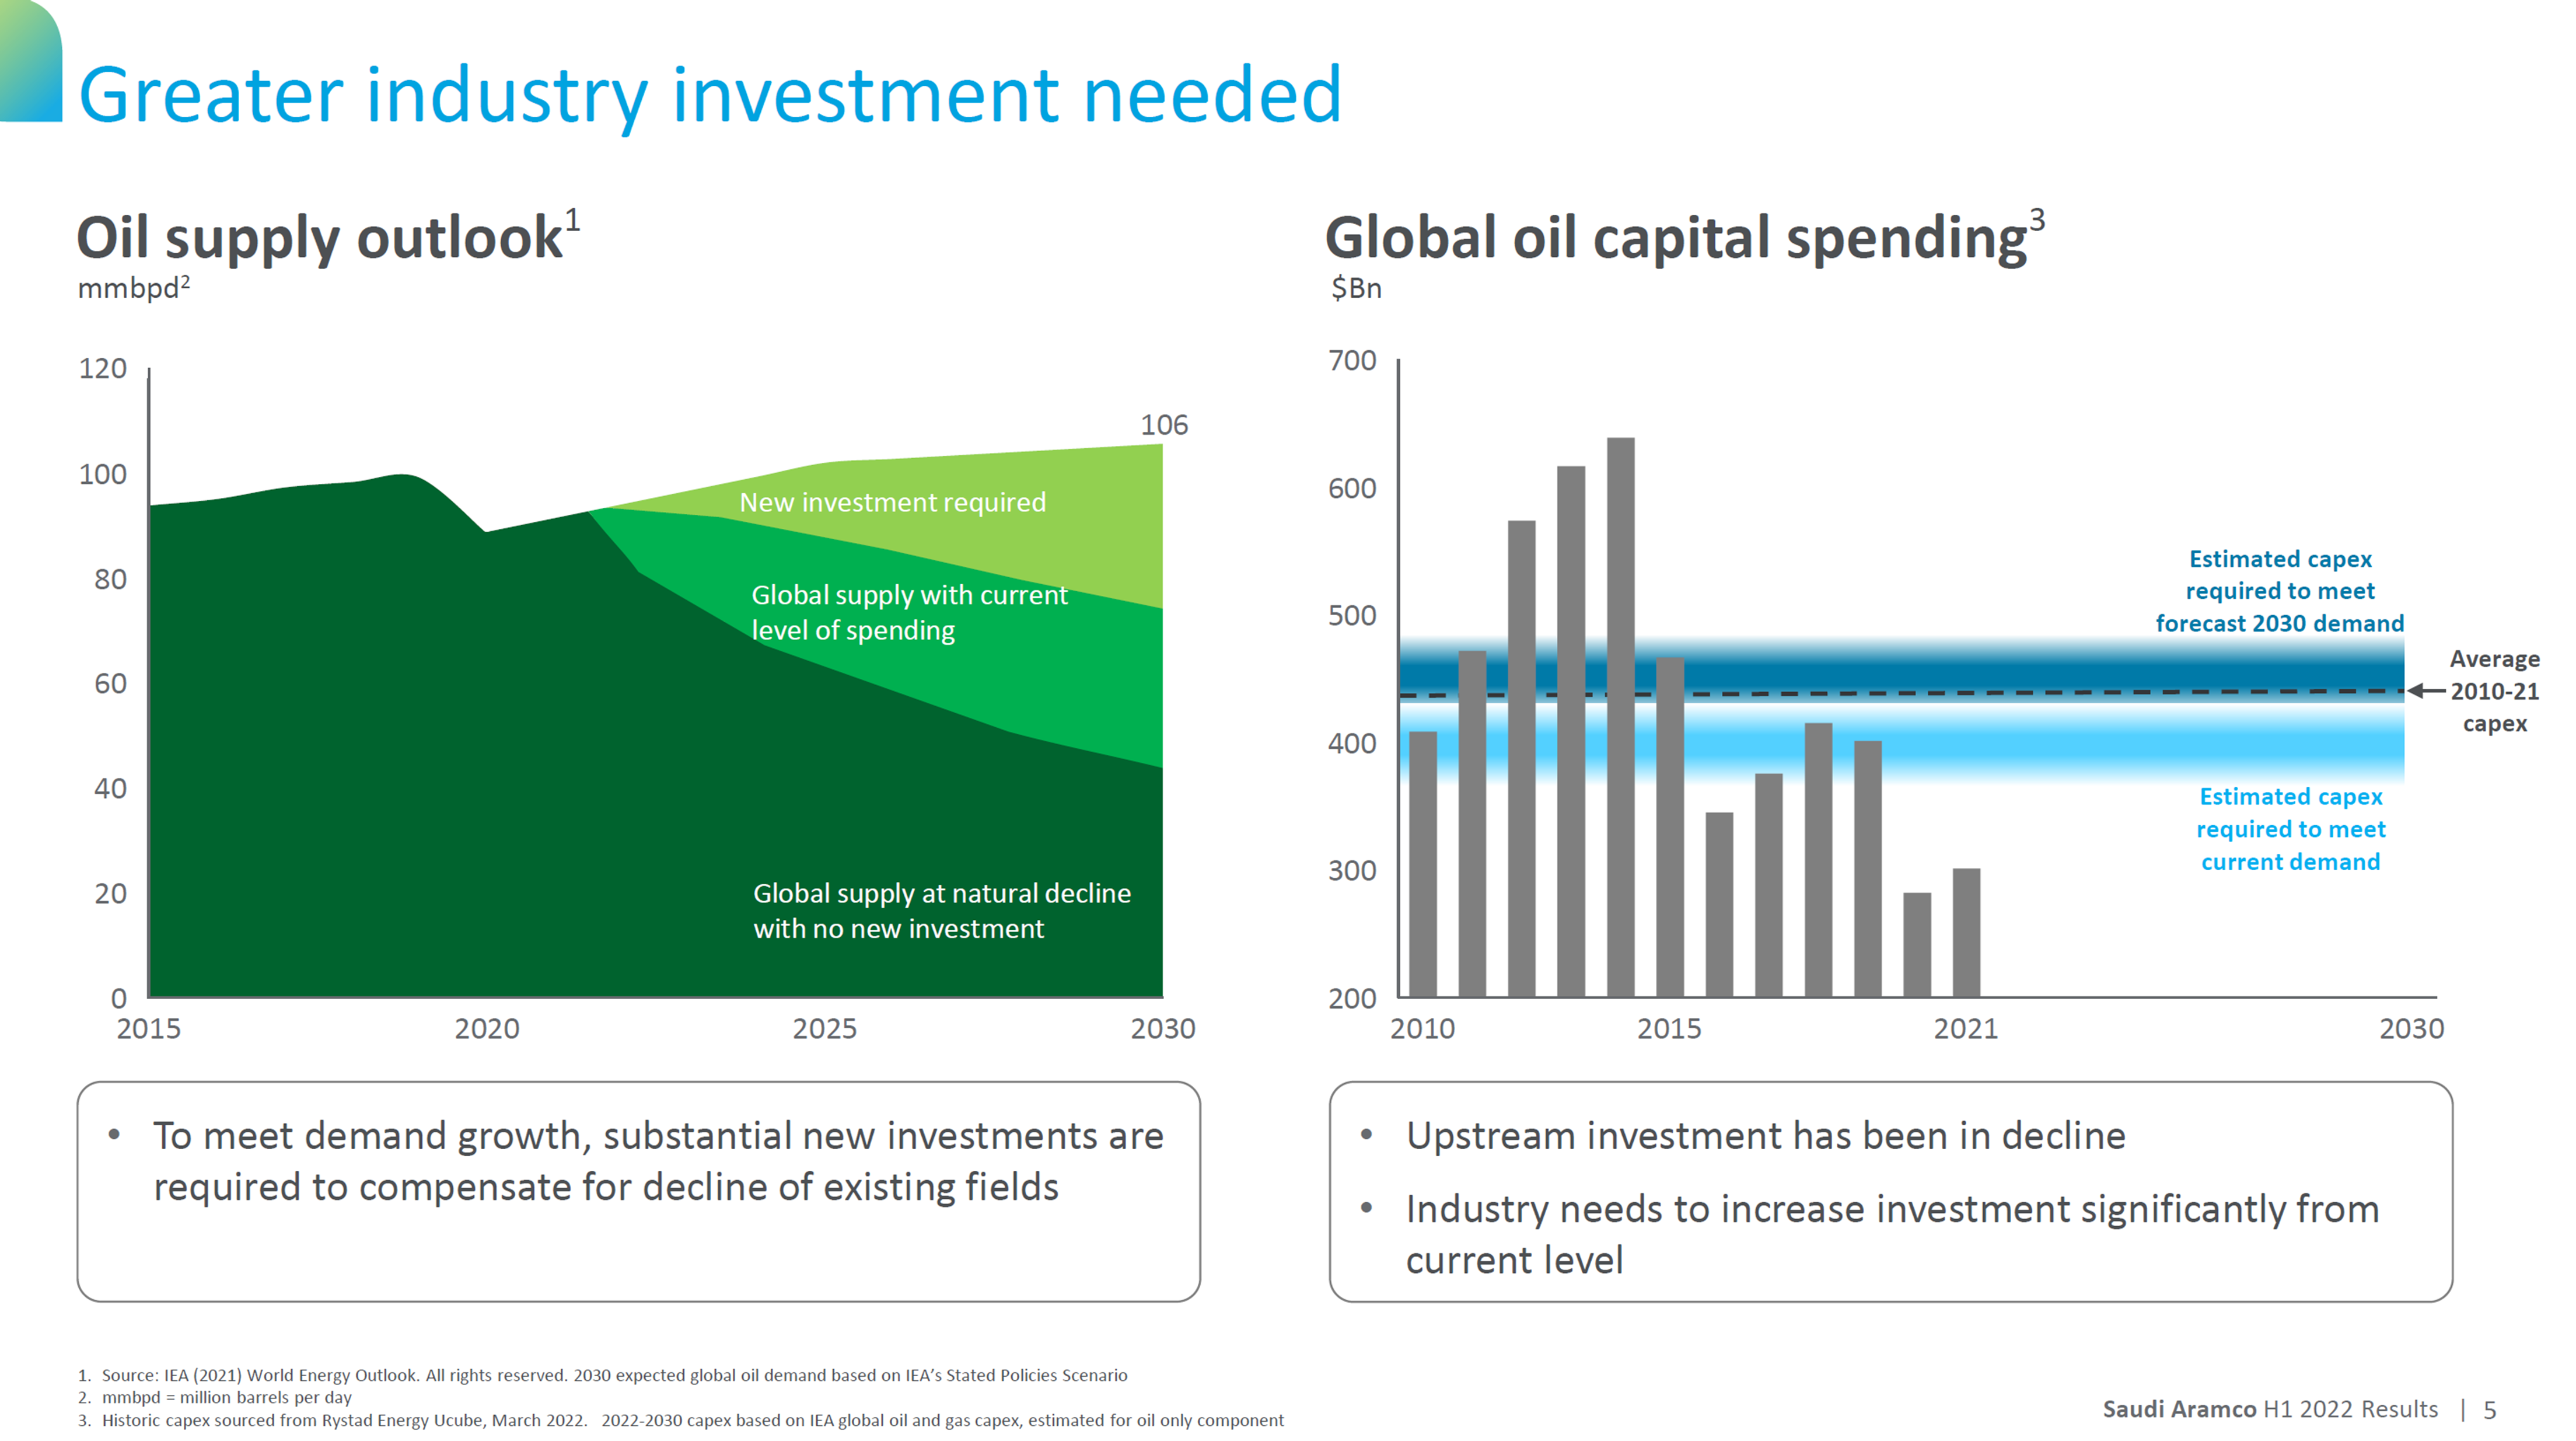
Media frenzy and unwarranted investor activism has led to a steep decline in investment in oil assets. Companies are delivering fat dividends, but not investing enough. In fact, Aramco in its 1HCY22 presentation said that given the current rate of investments, global crude oil production capacity can decline to ~95mbbl by 2025F. There isn’t going to be any revolution in clean energy by that time and hence, crude oil prices will rise. In between, there can be many factors like release of SPR, US President Joe Biden’s statements and what not, but the trajectory for crude oil is up from this level.

ONGC and Oil India are our top Add-rated stocks

We build in US$65/bbl crude oil price in our long-term realization assumptions for ONGC and Oil India or OIL. It’s becoming increasingly clear that the government of India won’t let oil drilling companies to make higher than US$65-70/bbl. It is counterproductive for the long-term energy security of India, but we don’t think rationality will prevail. In any case, even these assumptions for ONGC and OIL gives them more than a 50% upside. Downside risk to our estimates and target prices is the complete collapse of crude oil price to below US$60/bbl.


We don’t know yet what is the bare minimum level of SPR inventory USA is comfortable with. It’s not economic but a geopolitical decision for USA.  However, there has been lot of speculation about the level USA can be comfortable with.

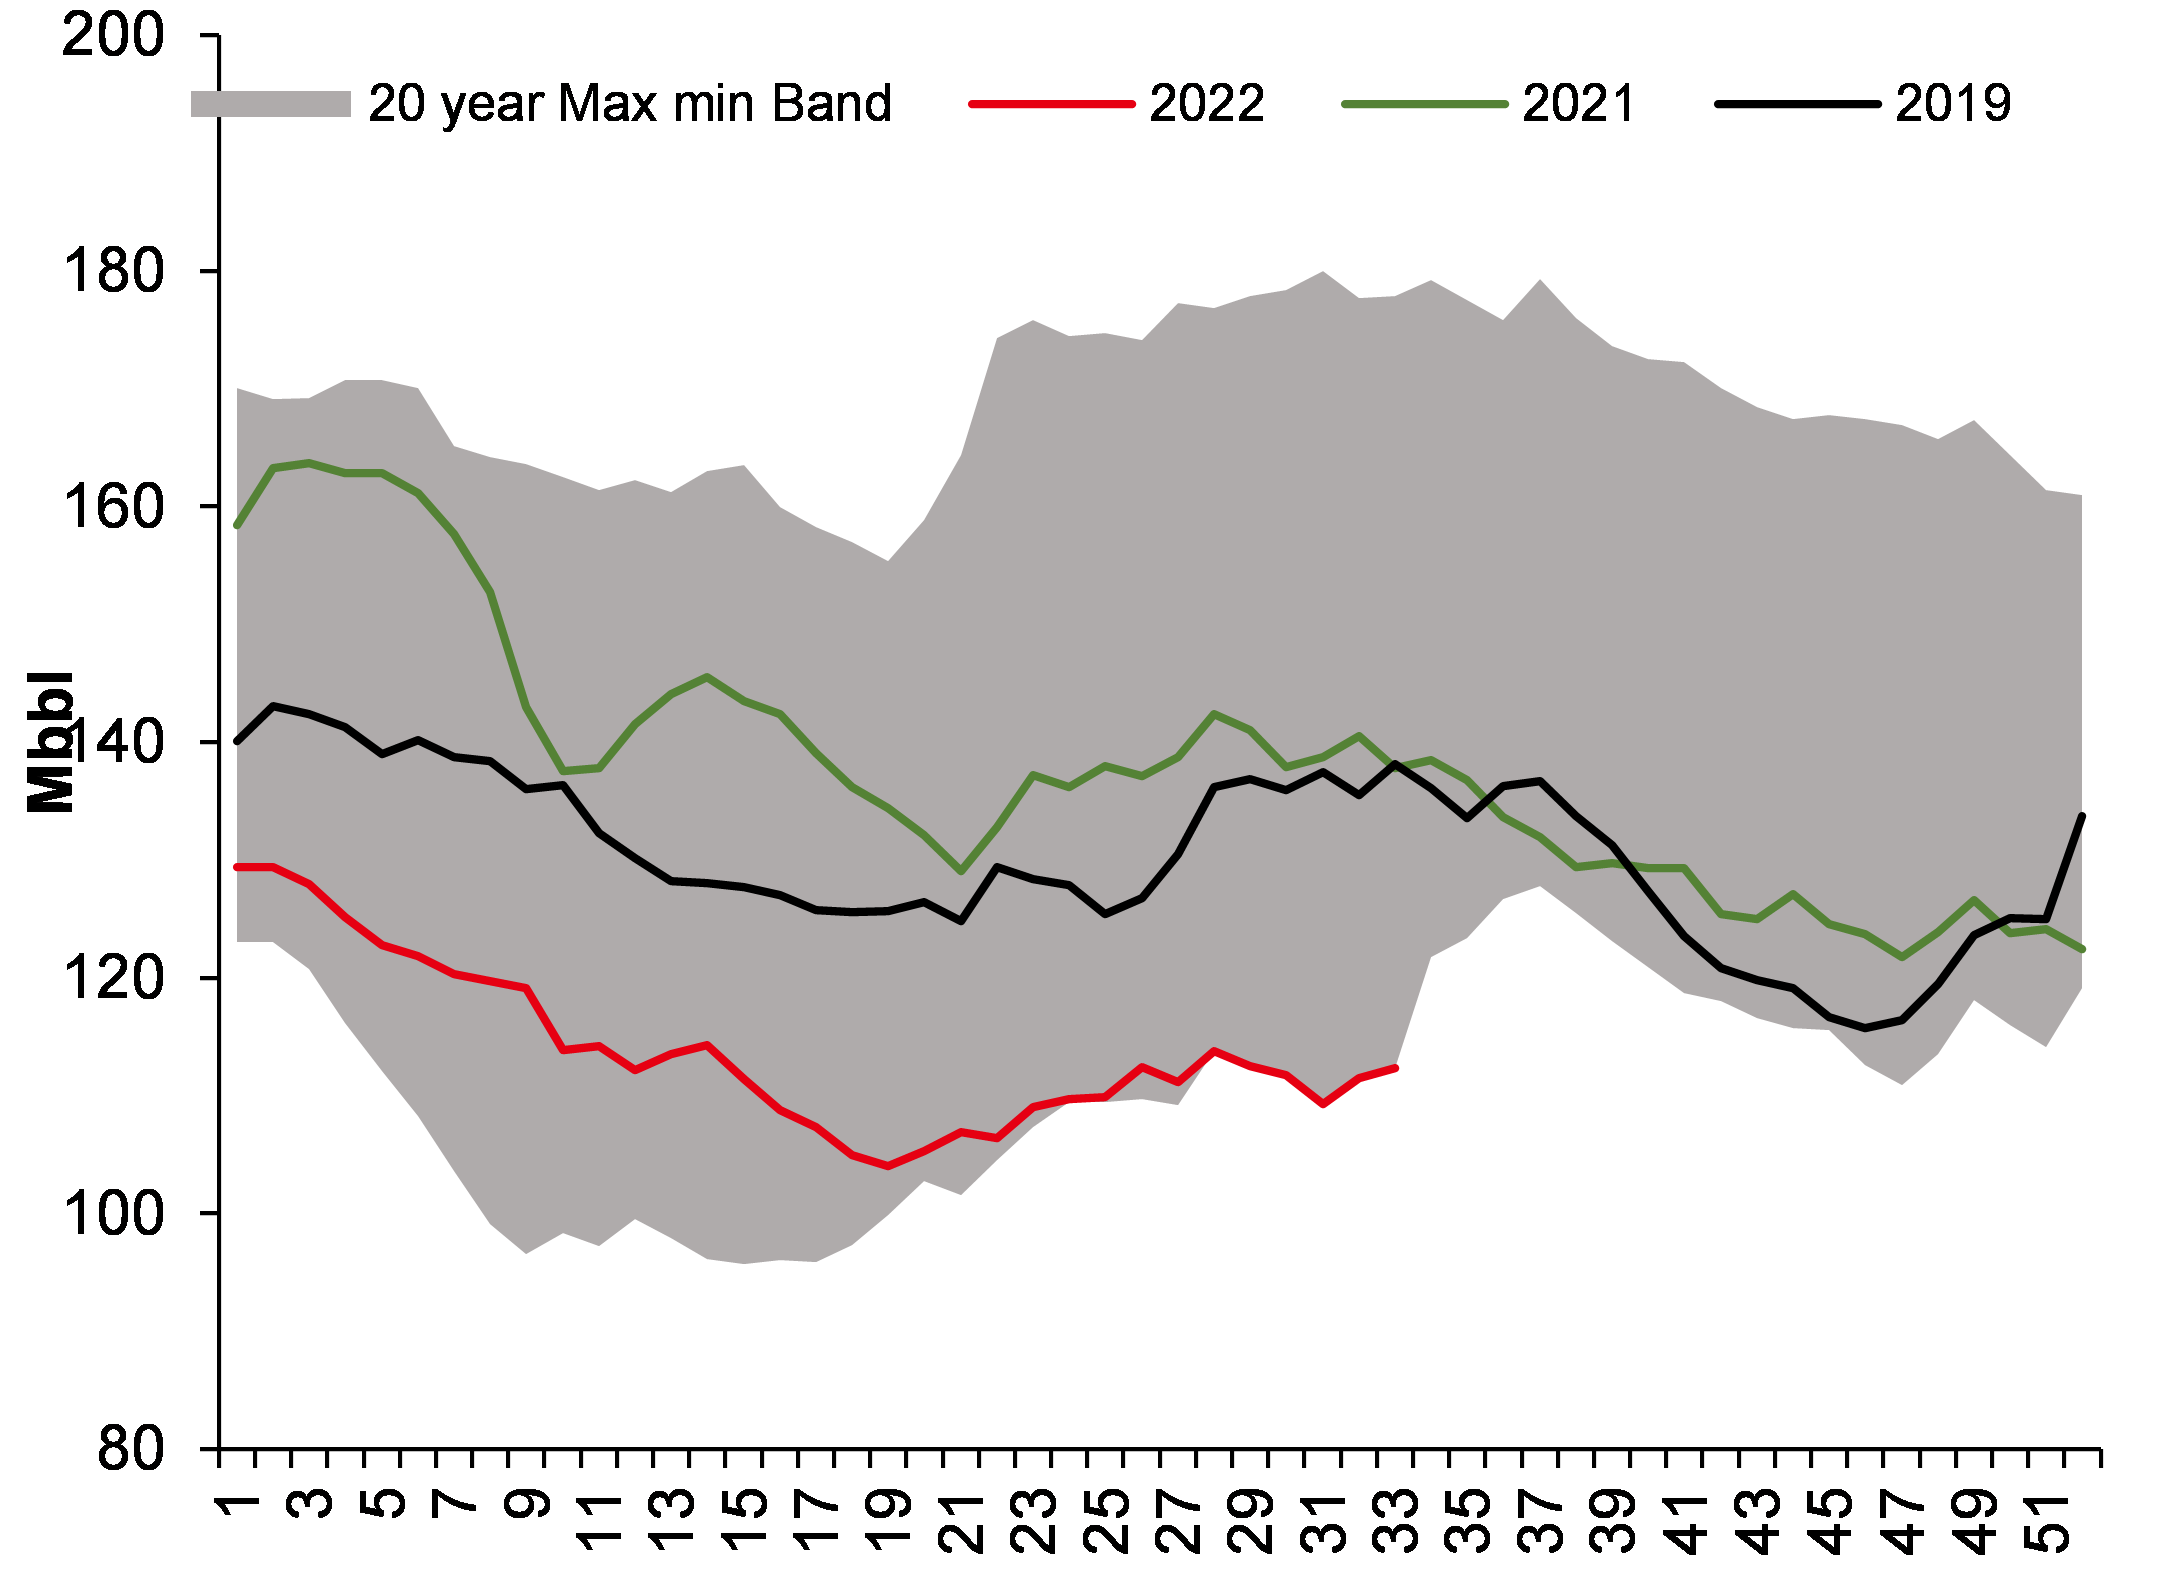
USA’s SPR inventory is near a 33-year low (in term of days of consumption)

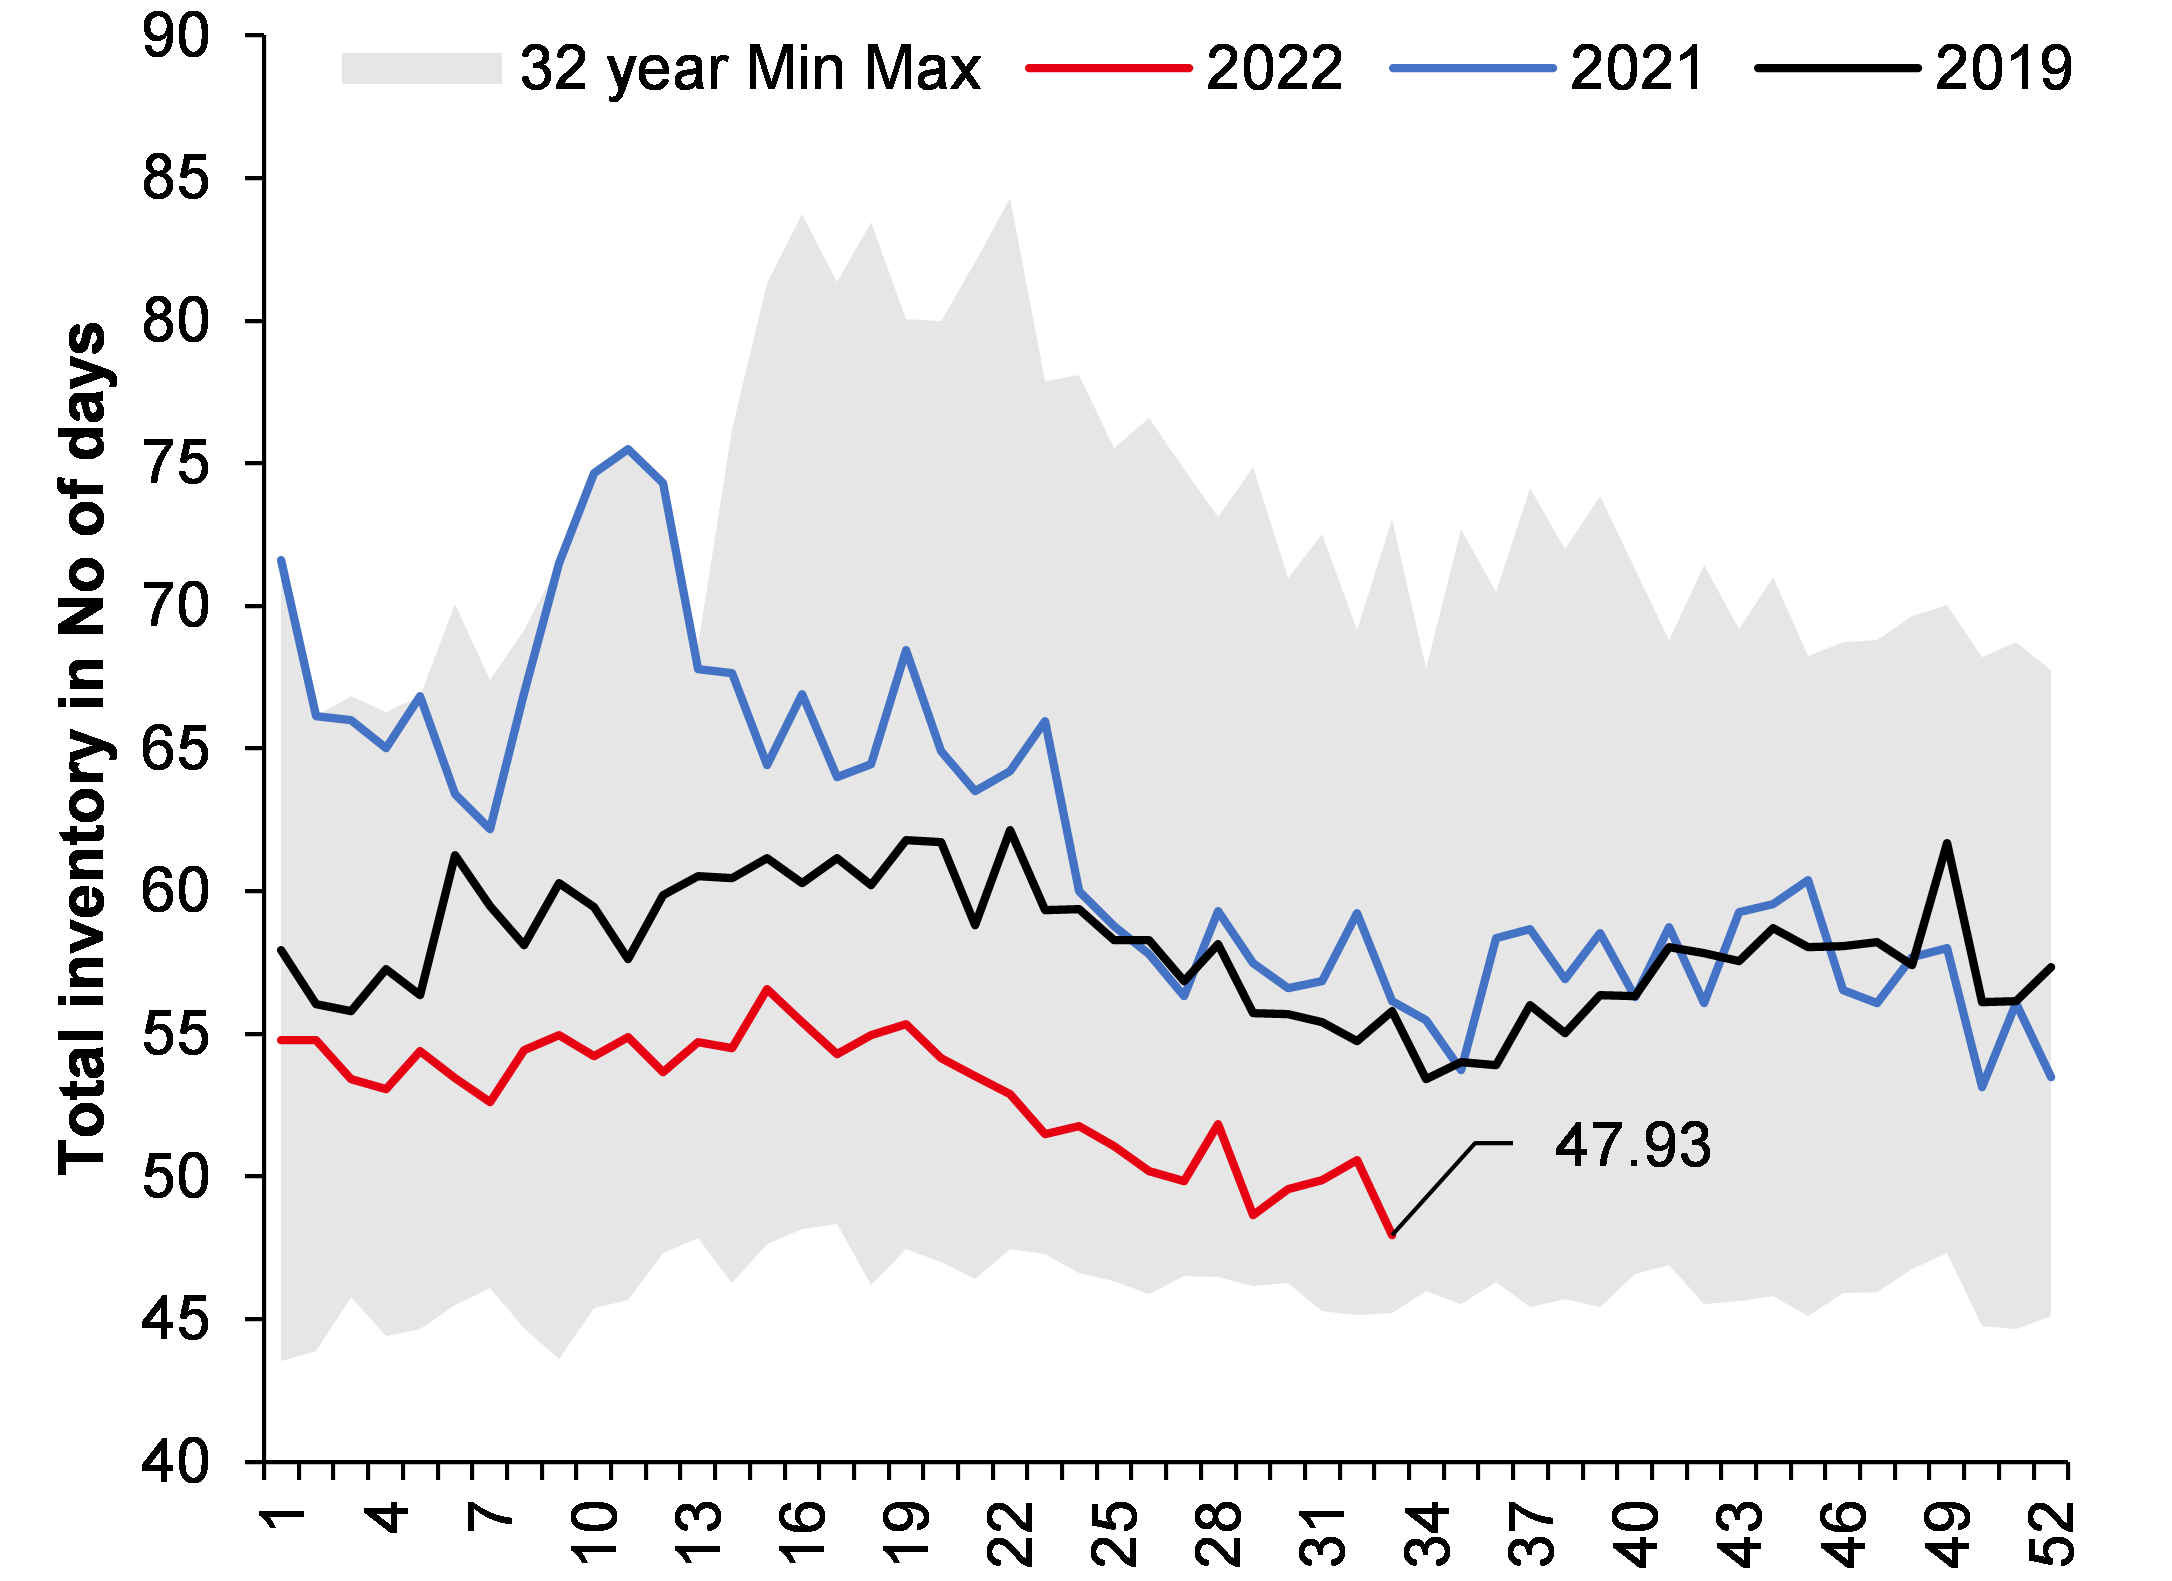
USA’s overall system crude oil inventory is at 48 days, something it has never witnessed in the past several years.

Figure 1: USA’s SPR inventory is at a multi-decade low

SOURCE: INCRED RESEARCH, COMPANY REPORTS

Figure 2: Total crude oil inventory is at a two-decade low

SOURCE: INCRED RESEARCH, COMPANY REPORTS

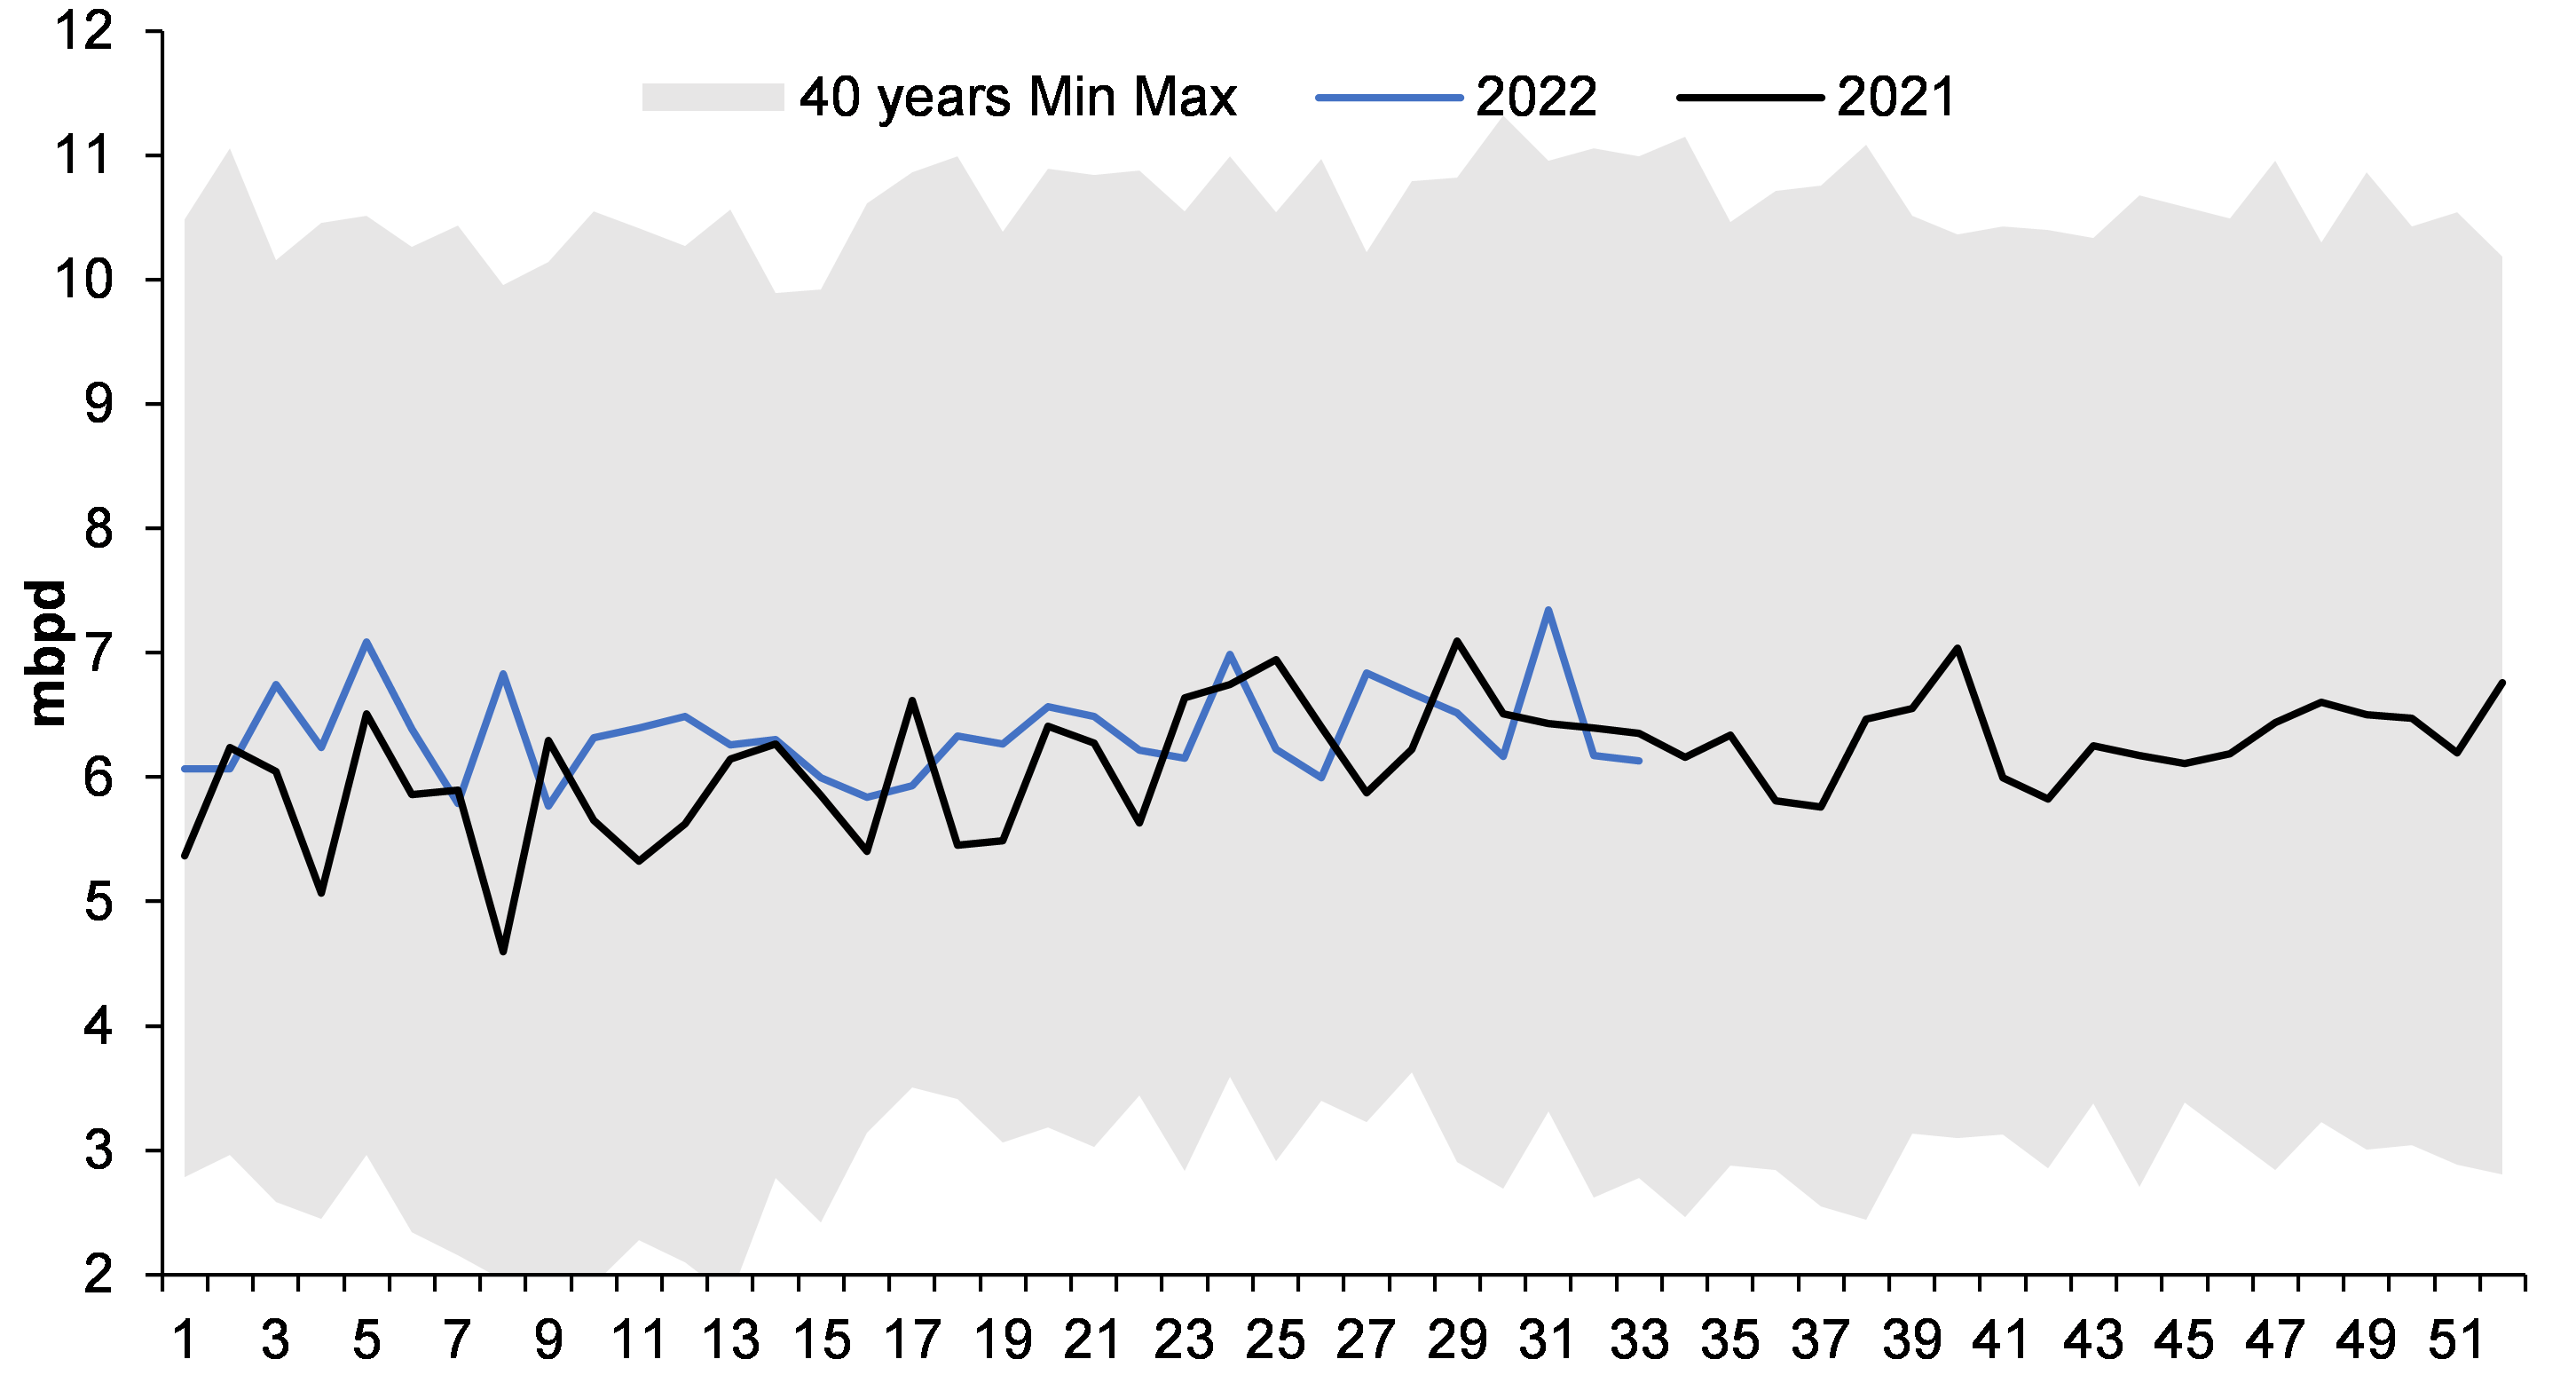
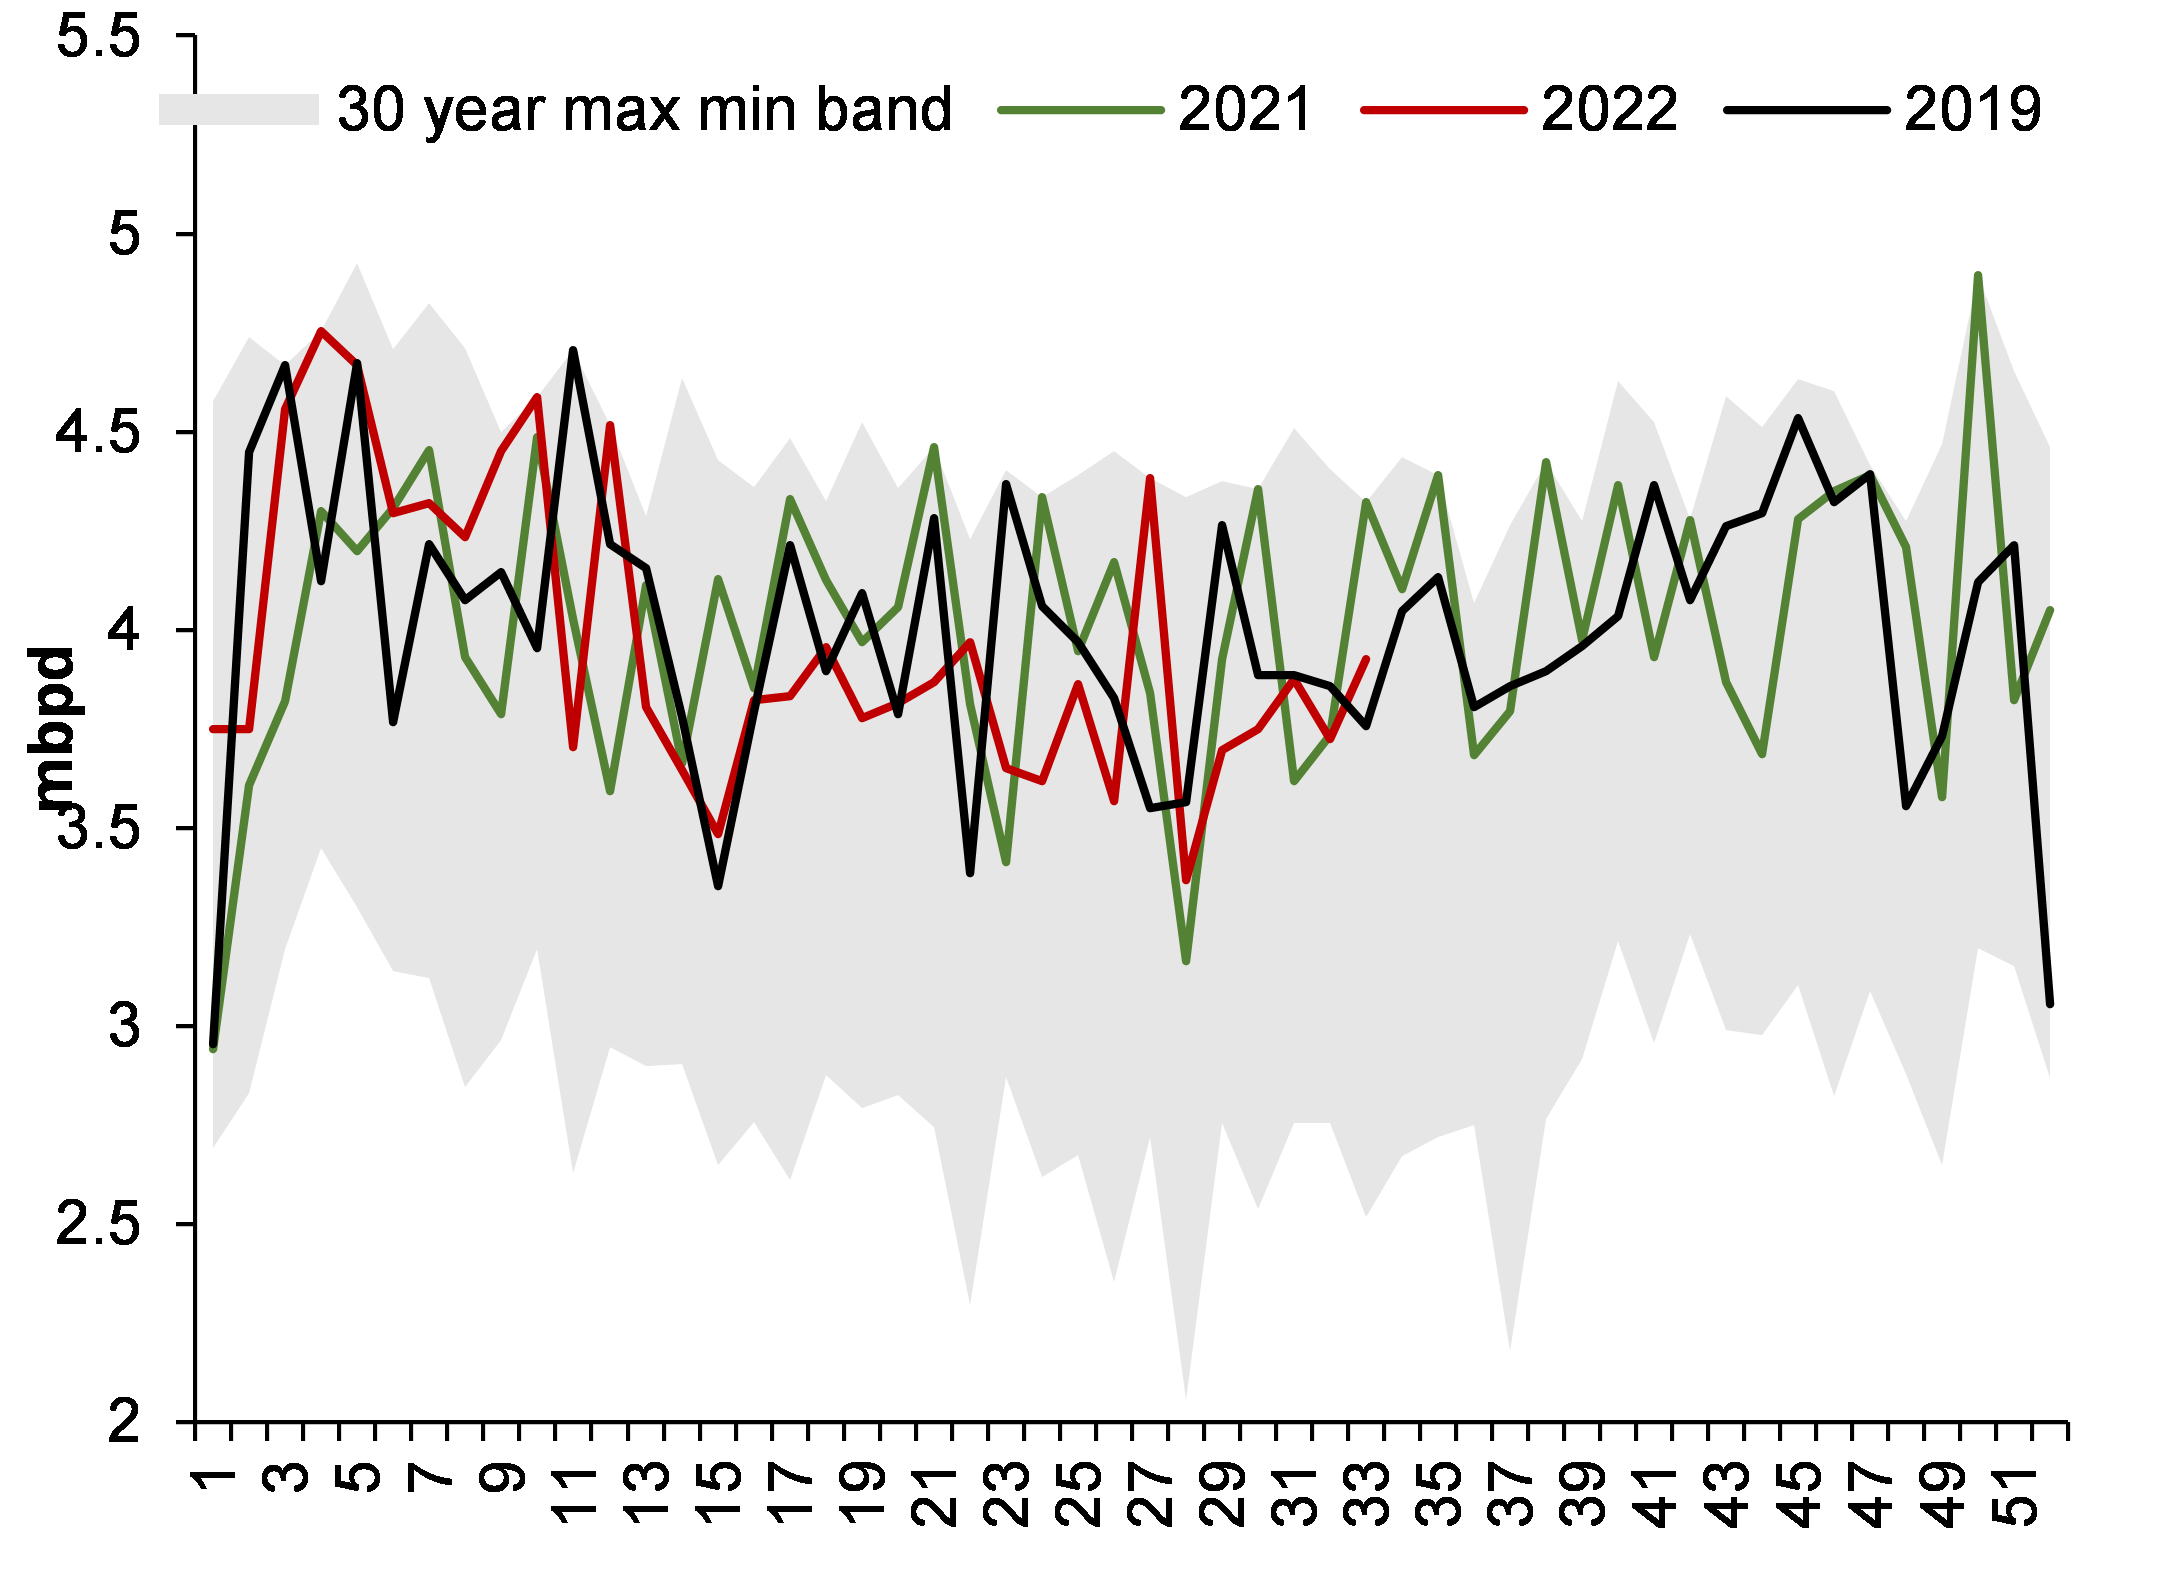
May be the present dispensation in USA is highly comfortable with its Middle East relations, but it’s a risk that USA never took in the past several decades. More so when its import dependence is still quite high. Please note that not all USA refineries can process WTI crude and hence, oil imports are a necessity for USA.

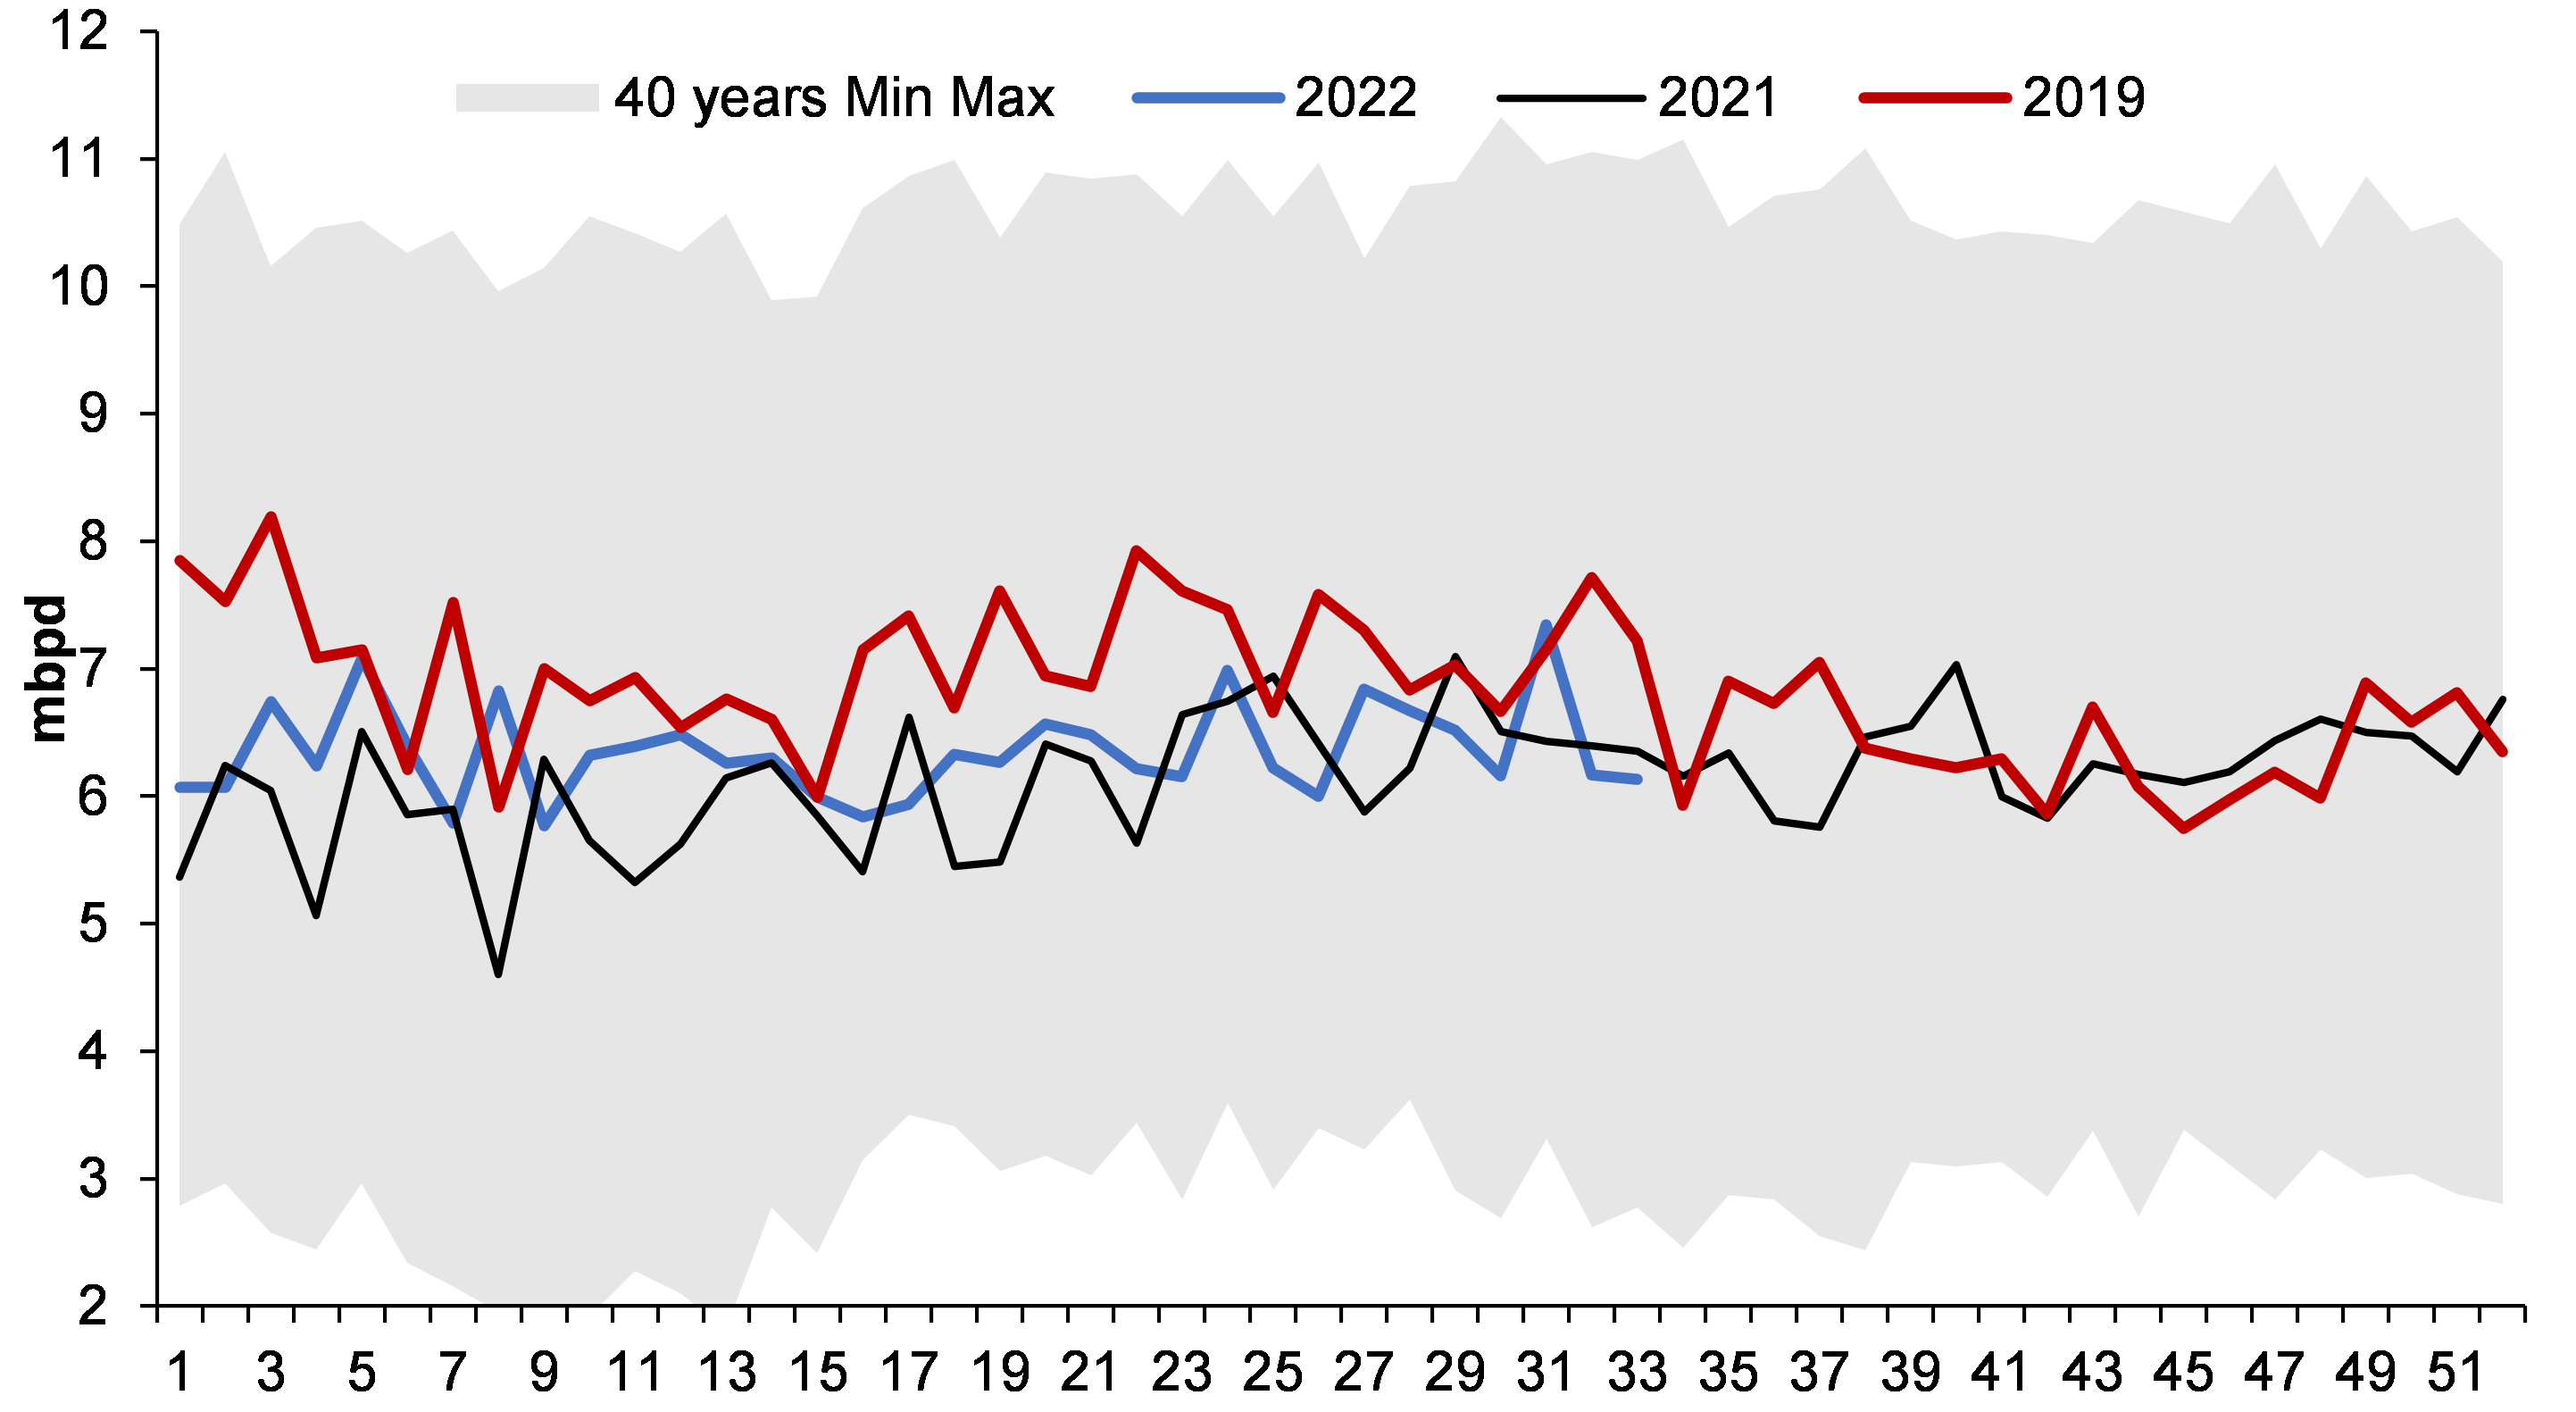
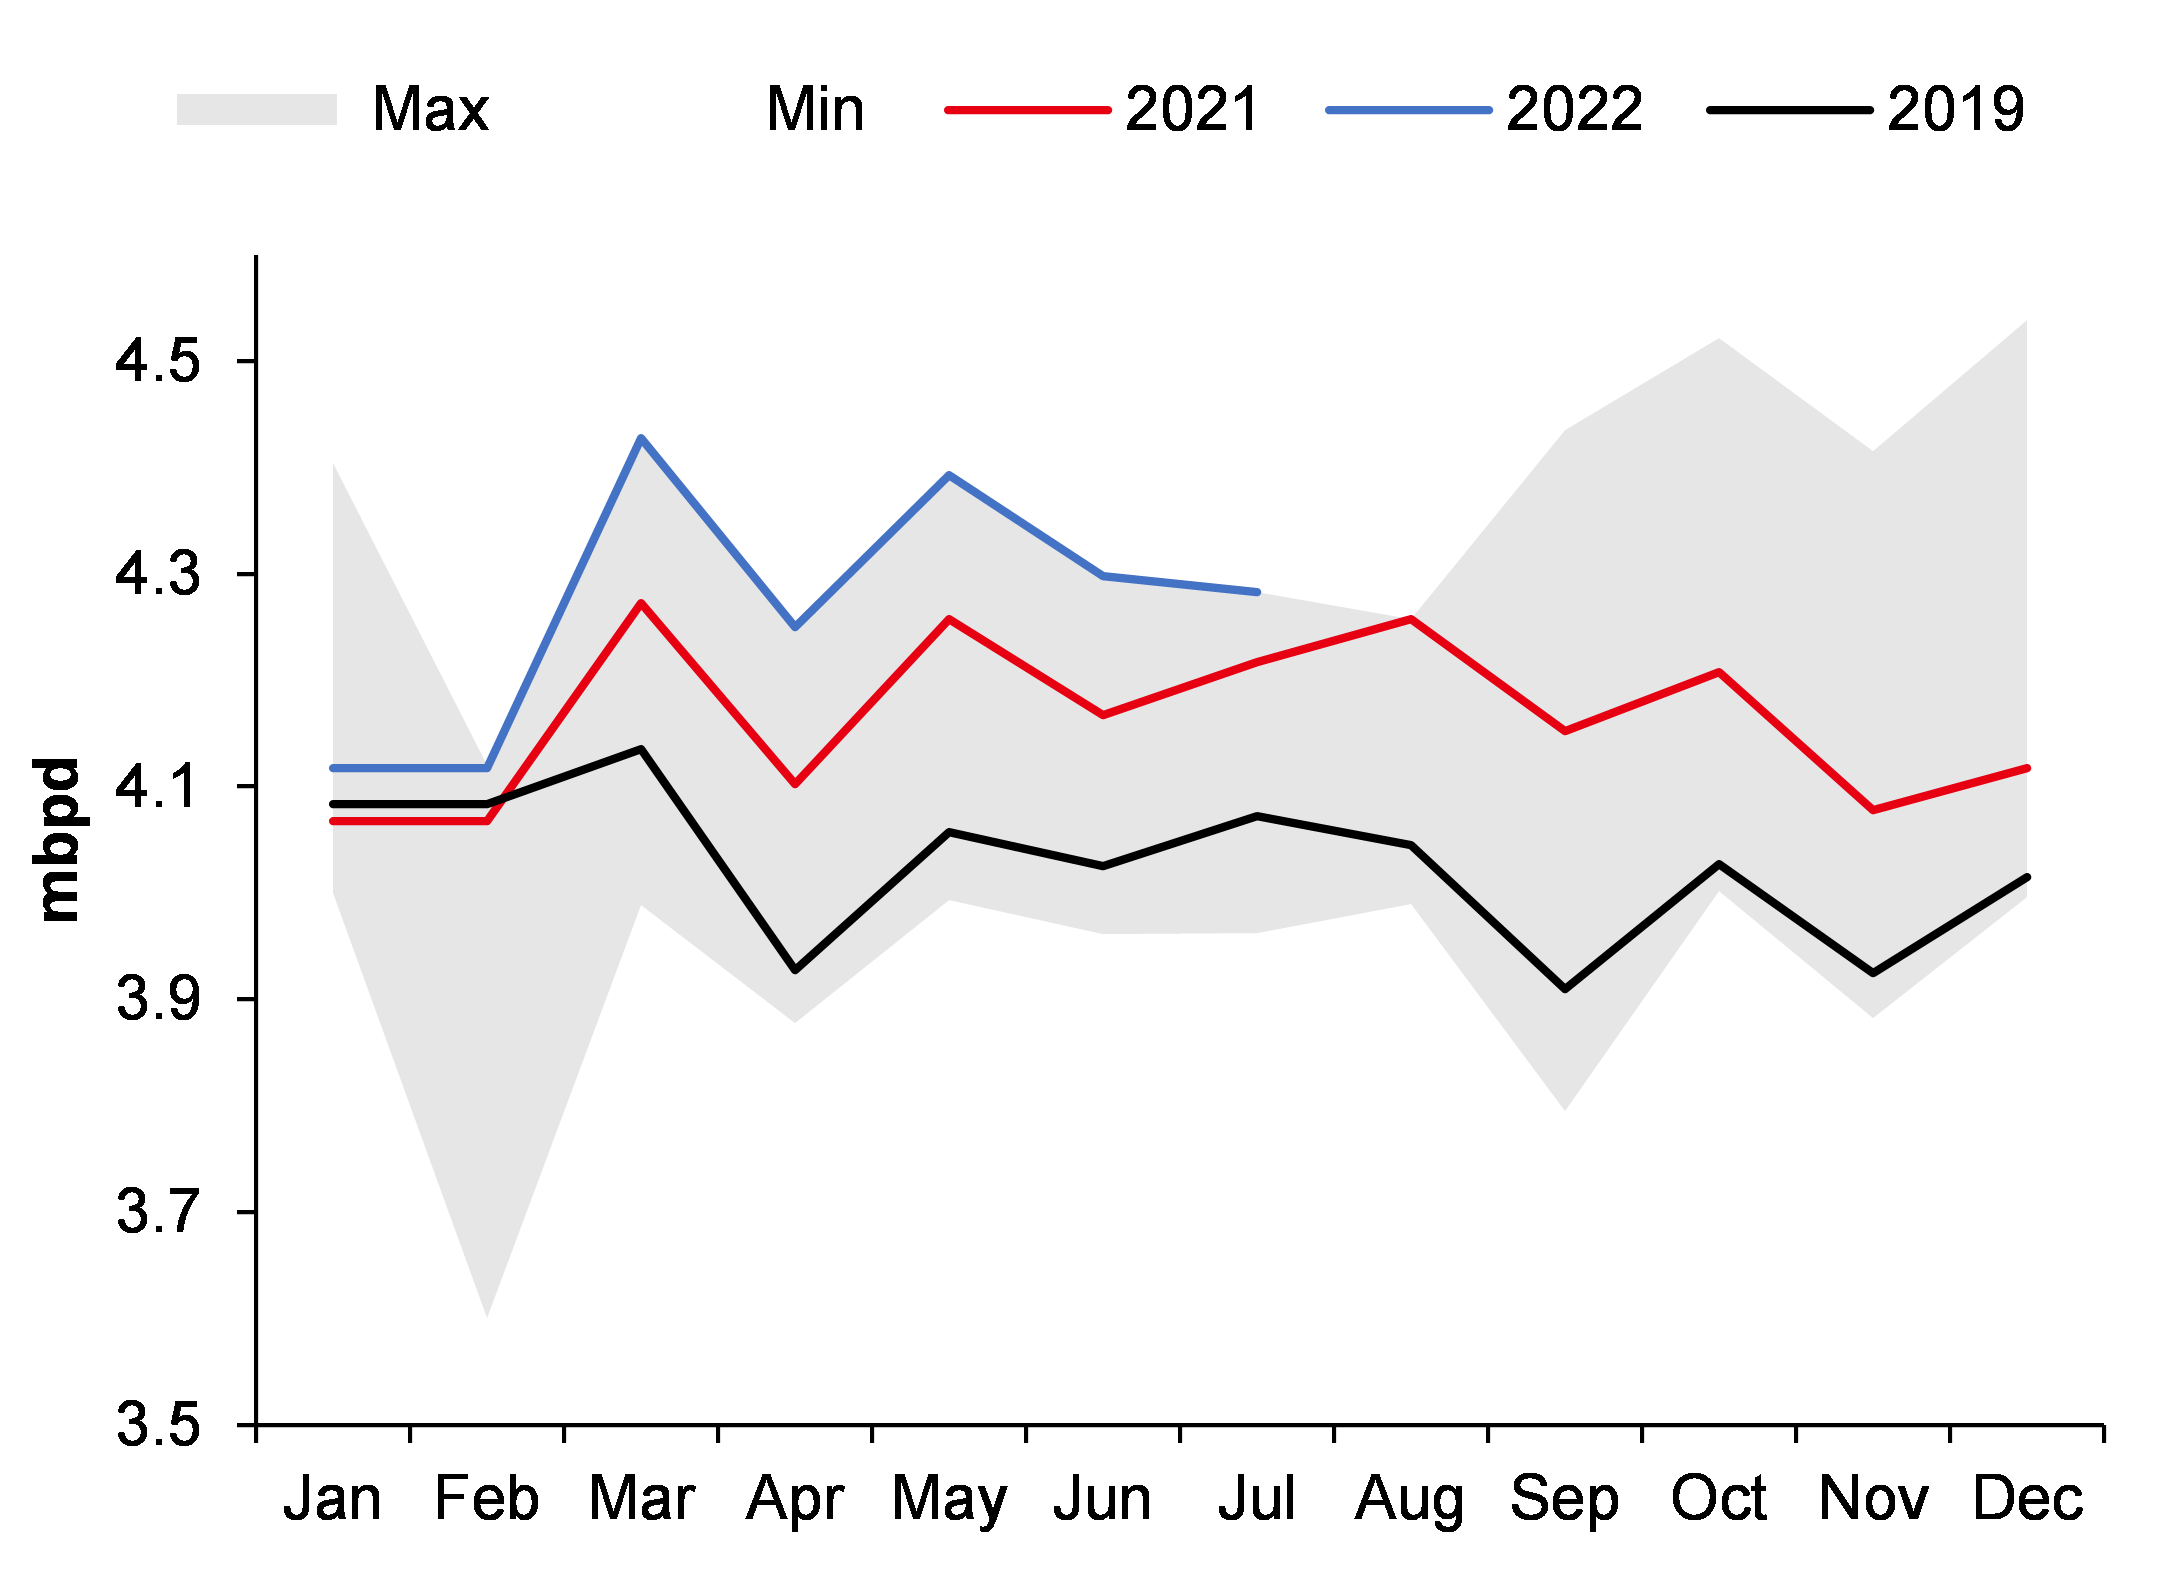
Figure 3: USA still imports around 6.7mbpd of crude oil and these imports cannot come down as many USA refineries cannot process WTI crude oil

SOURCE: INCRED RESEARCH, COMPANY REPORTS


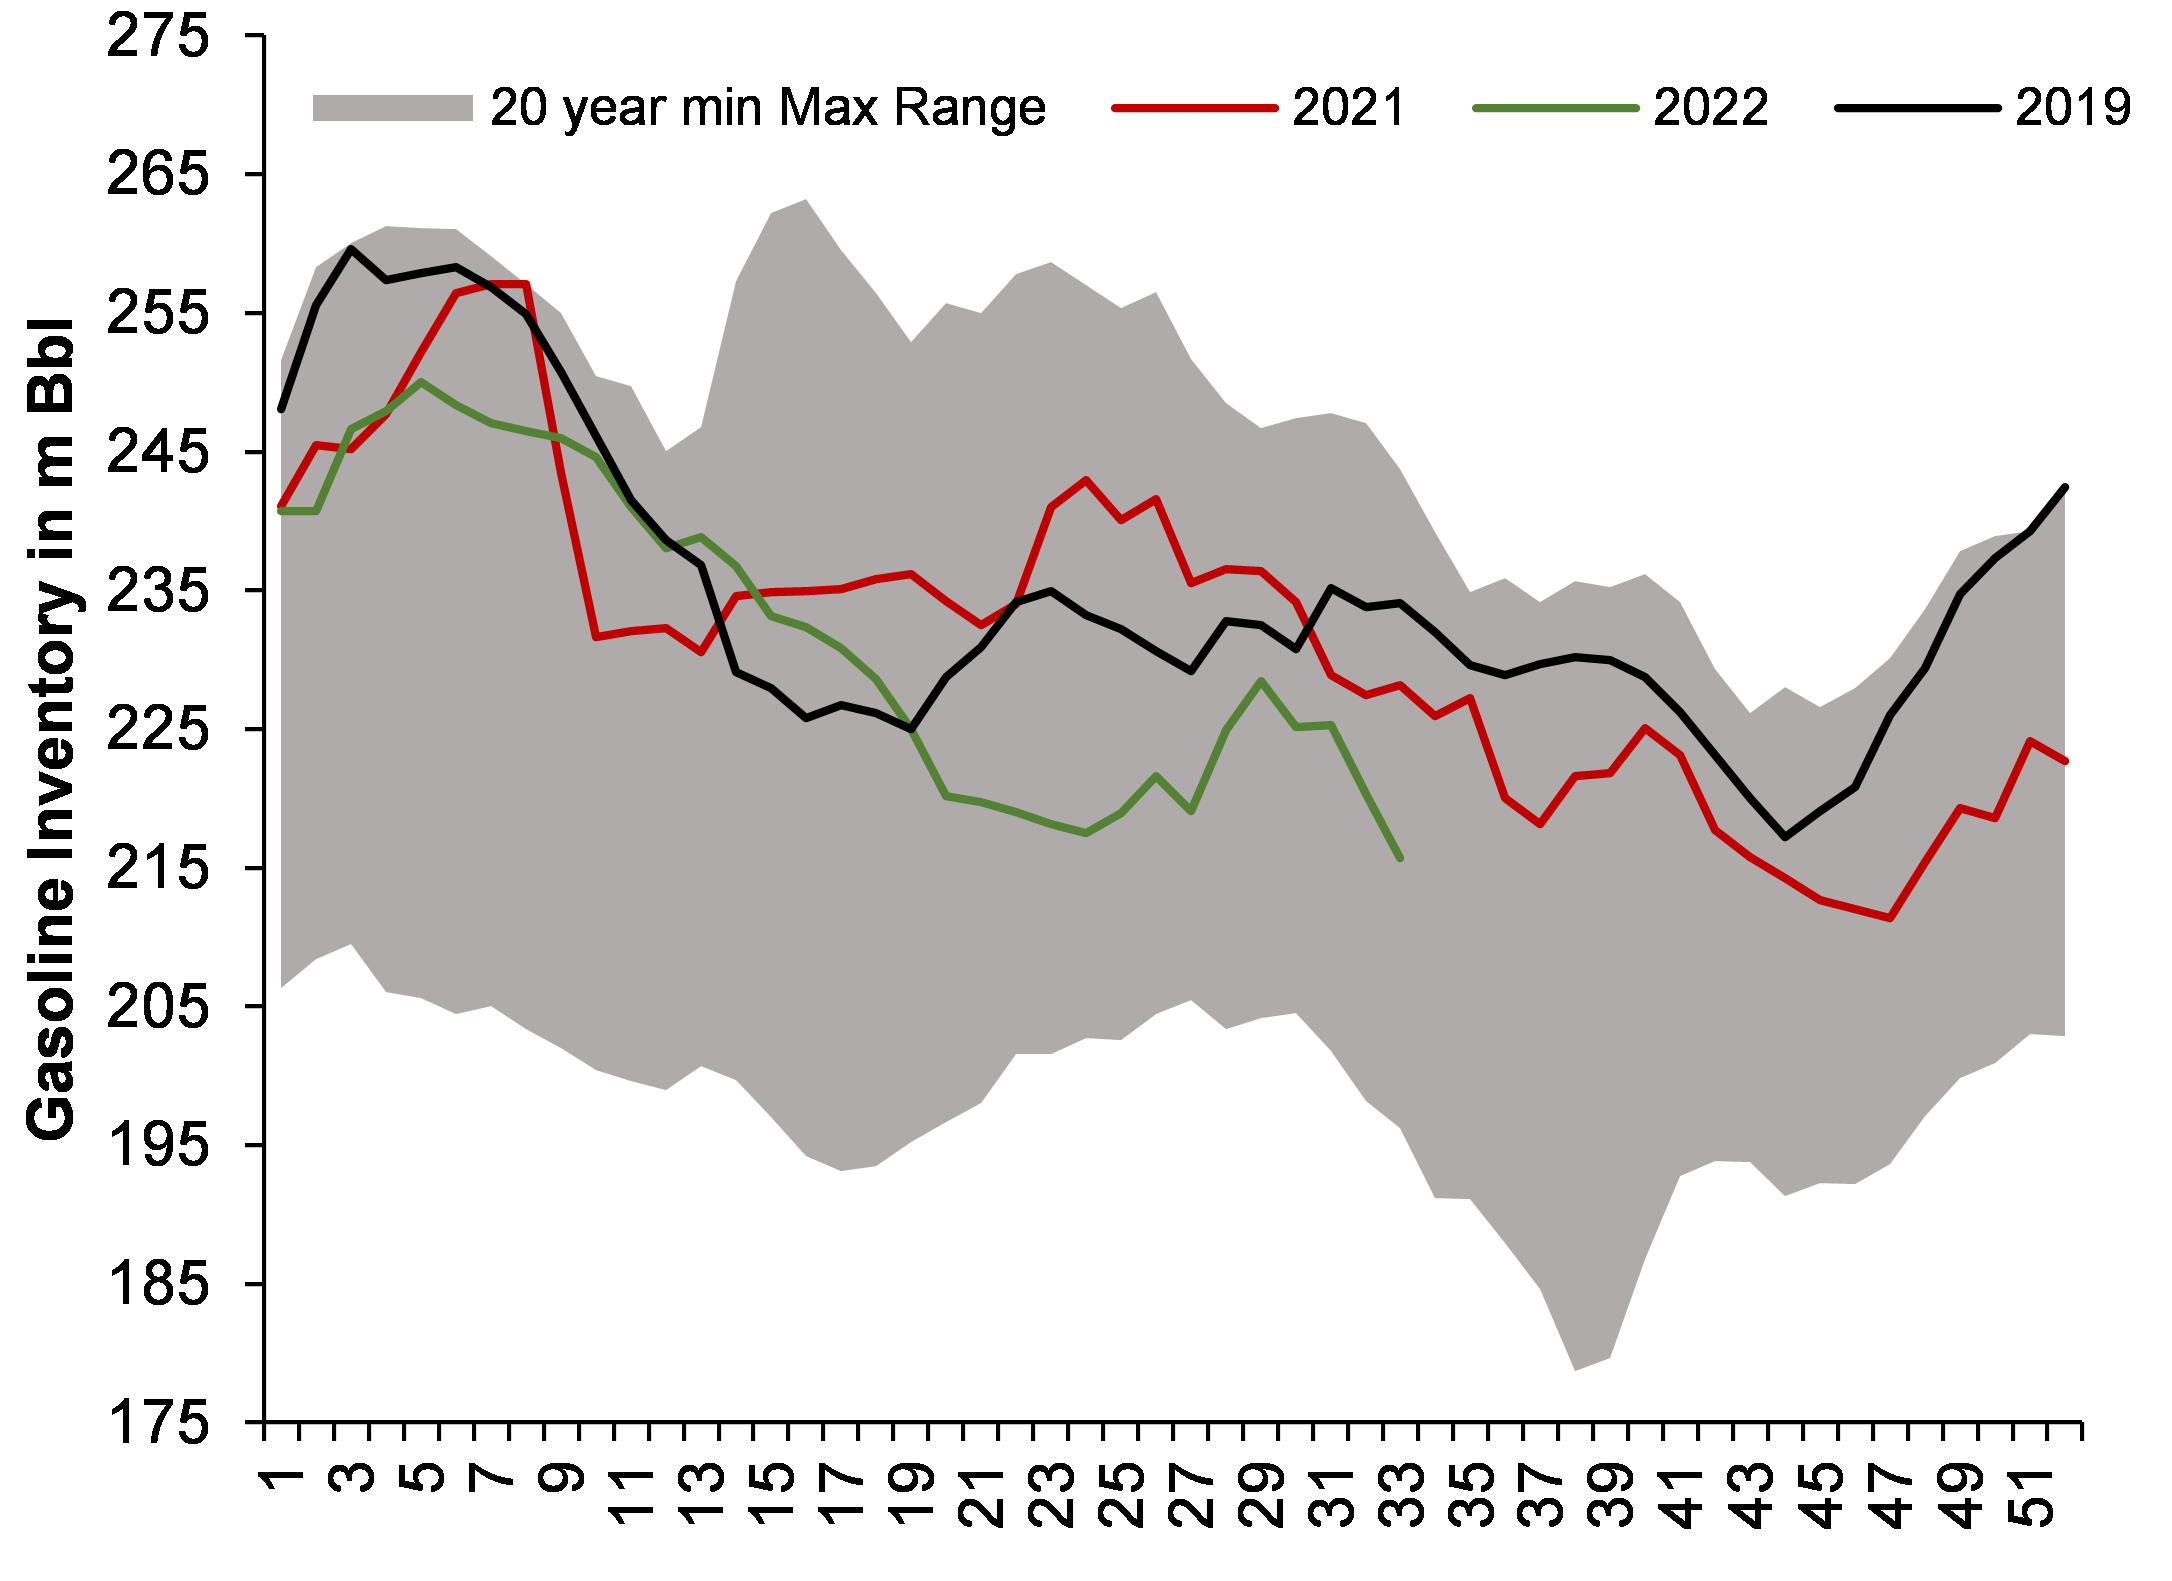
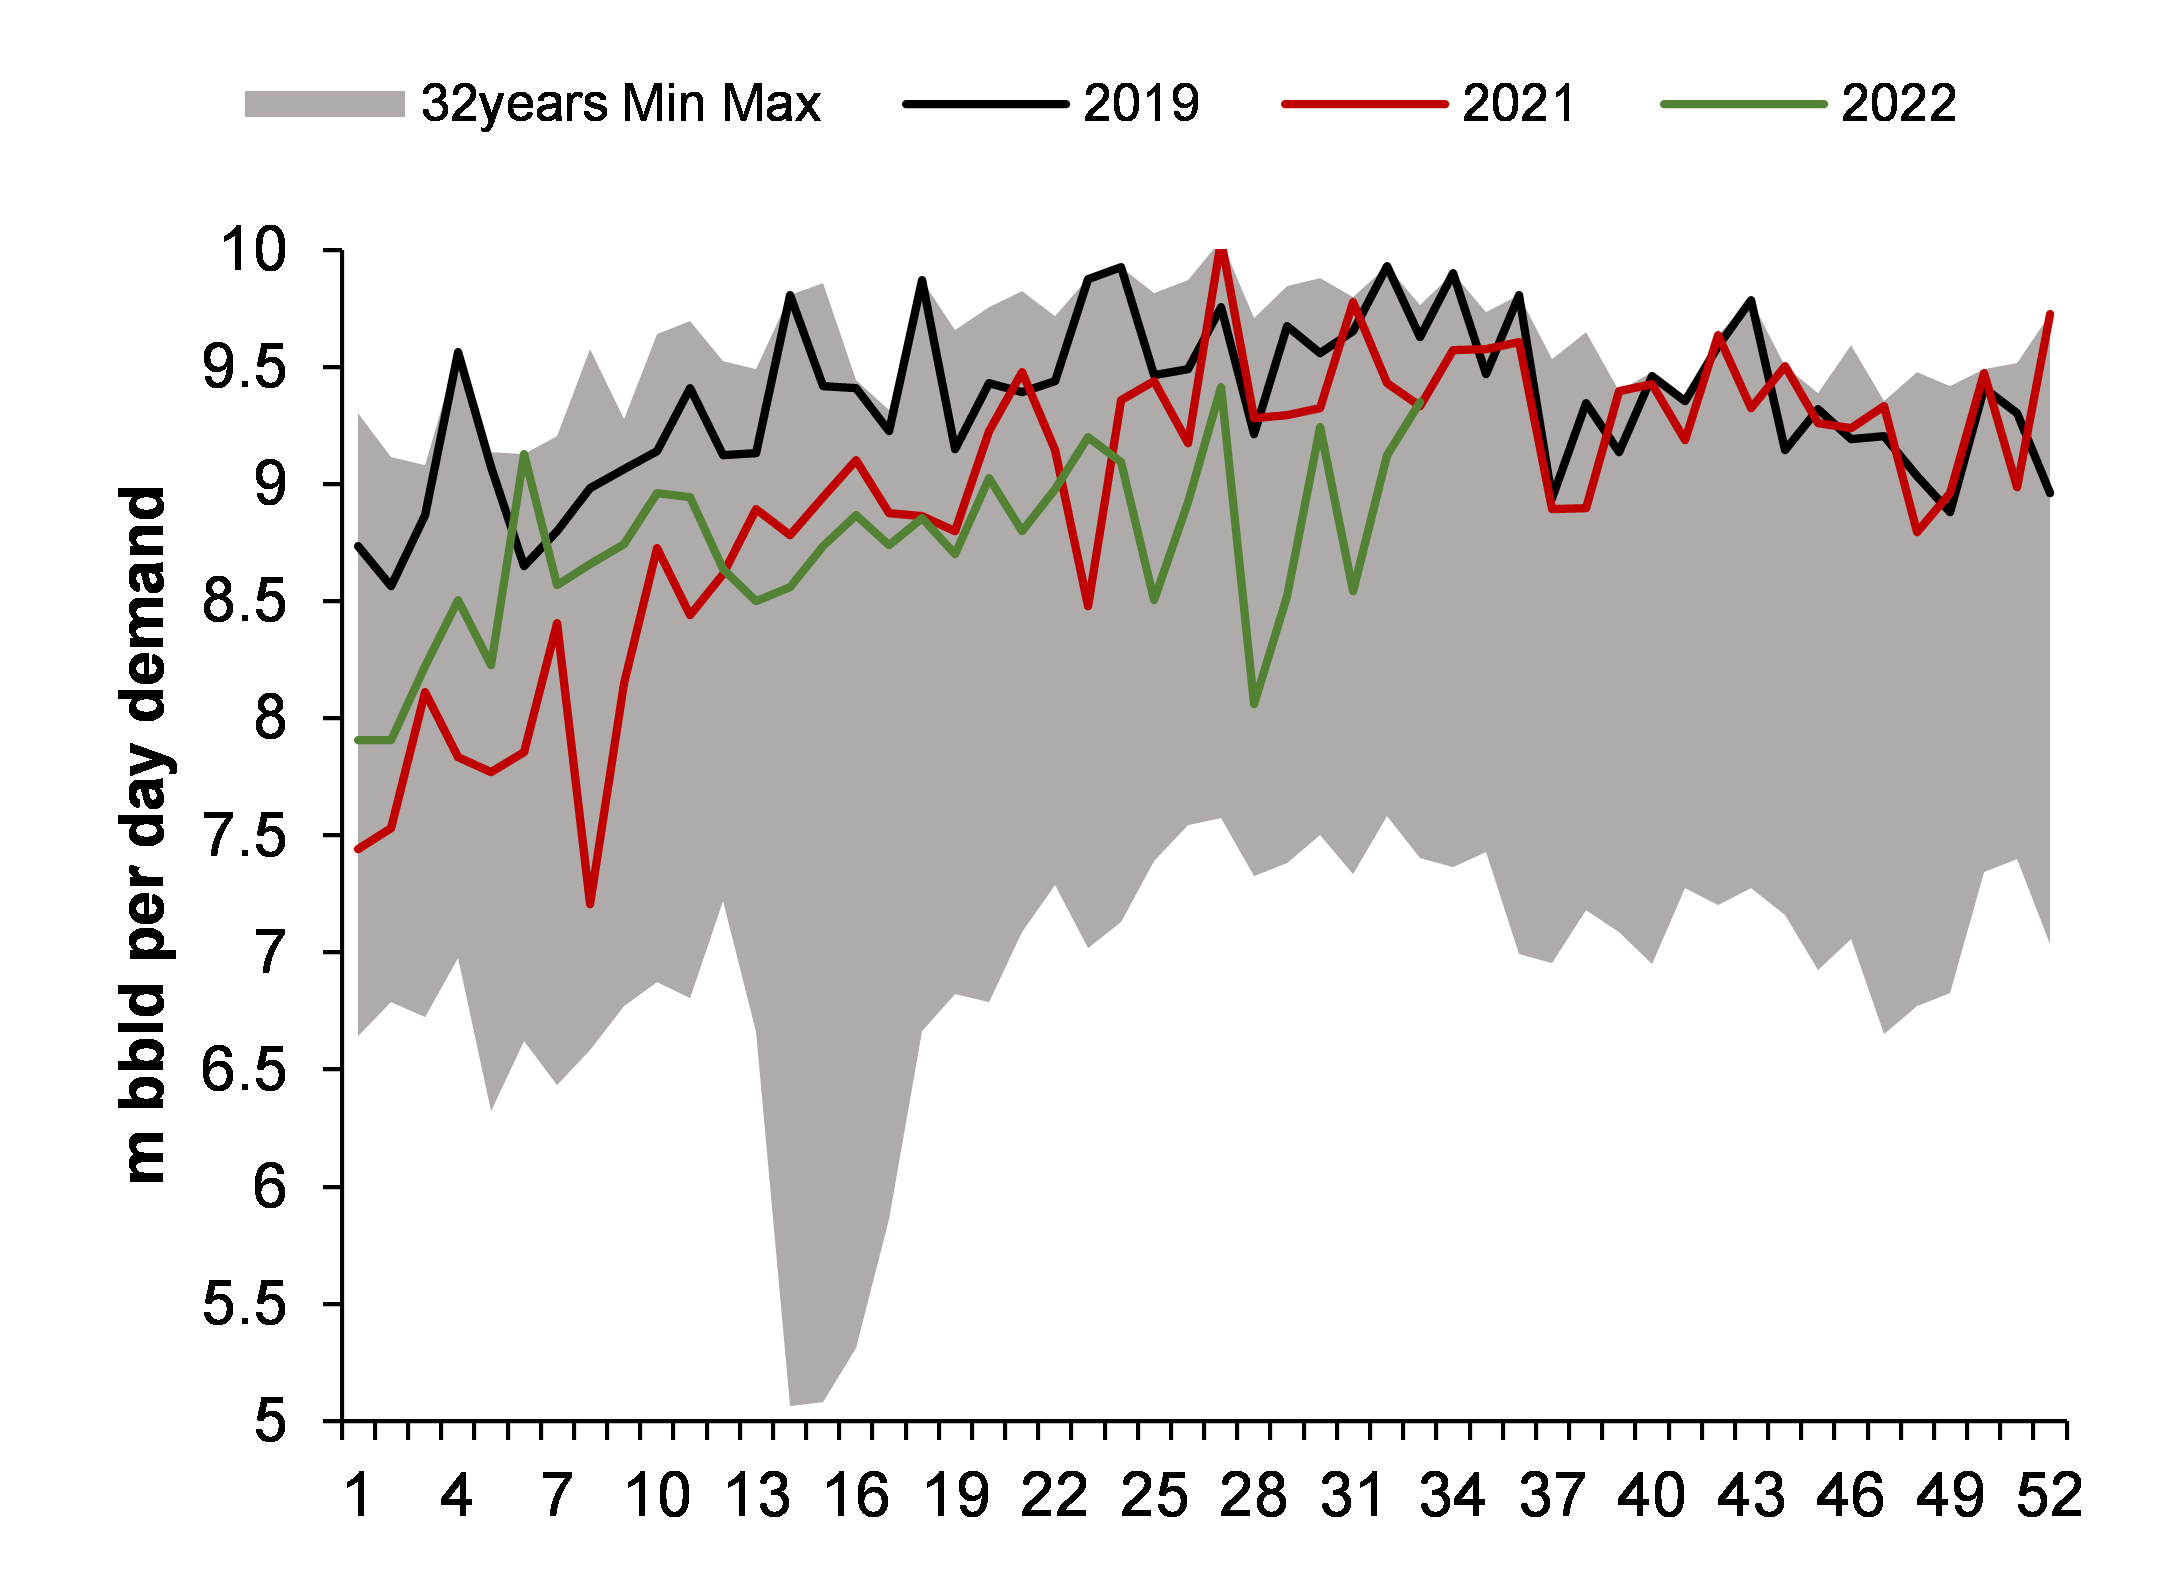
Gasoline demand is fluctuating but not falling below the 8.5mbpd mark, but diesel demand is just extra strong

Figure 4: USA’s gasoline inventory is declining

SOURCE: INCRED RESEARCH, COMPANY REPORTS

Figure 5: However, demand (measured in terms of product supplied) is all over the place in past few weeks

SOURCE: INCRED RESEARCH, COMPANY REPORTS


Figure 6: Middle distillate inventory (mainly diesel) is at all-time low…

SOURCE: INCRED RESEARCH, COMPANY REPORTS

Figure 7: …and middle distillate demand appears to be extra strong

SOURCE: INCRED RESEARCH, COMPANY REPORTS


Crude oil demand is not weak and  investmentin upstream assets is declining

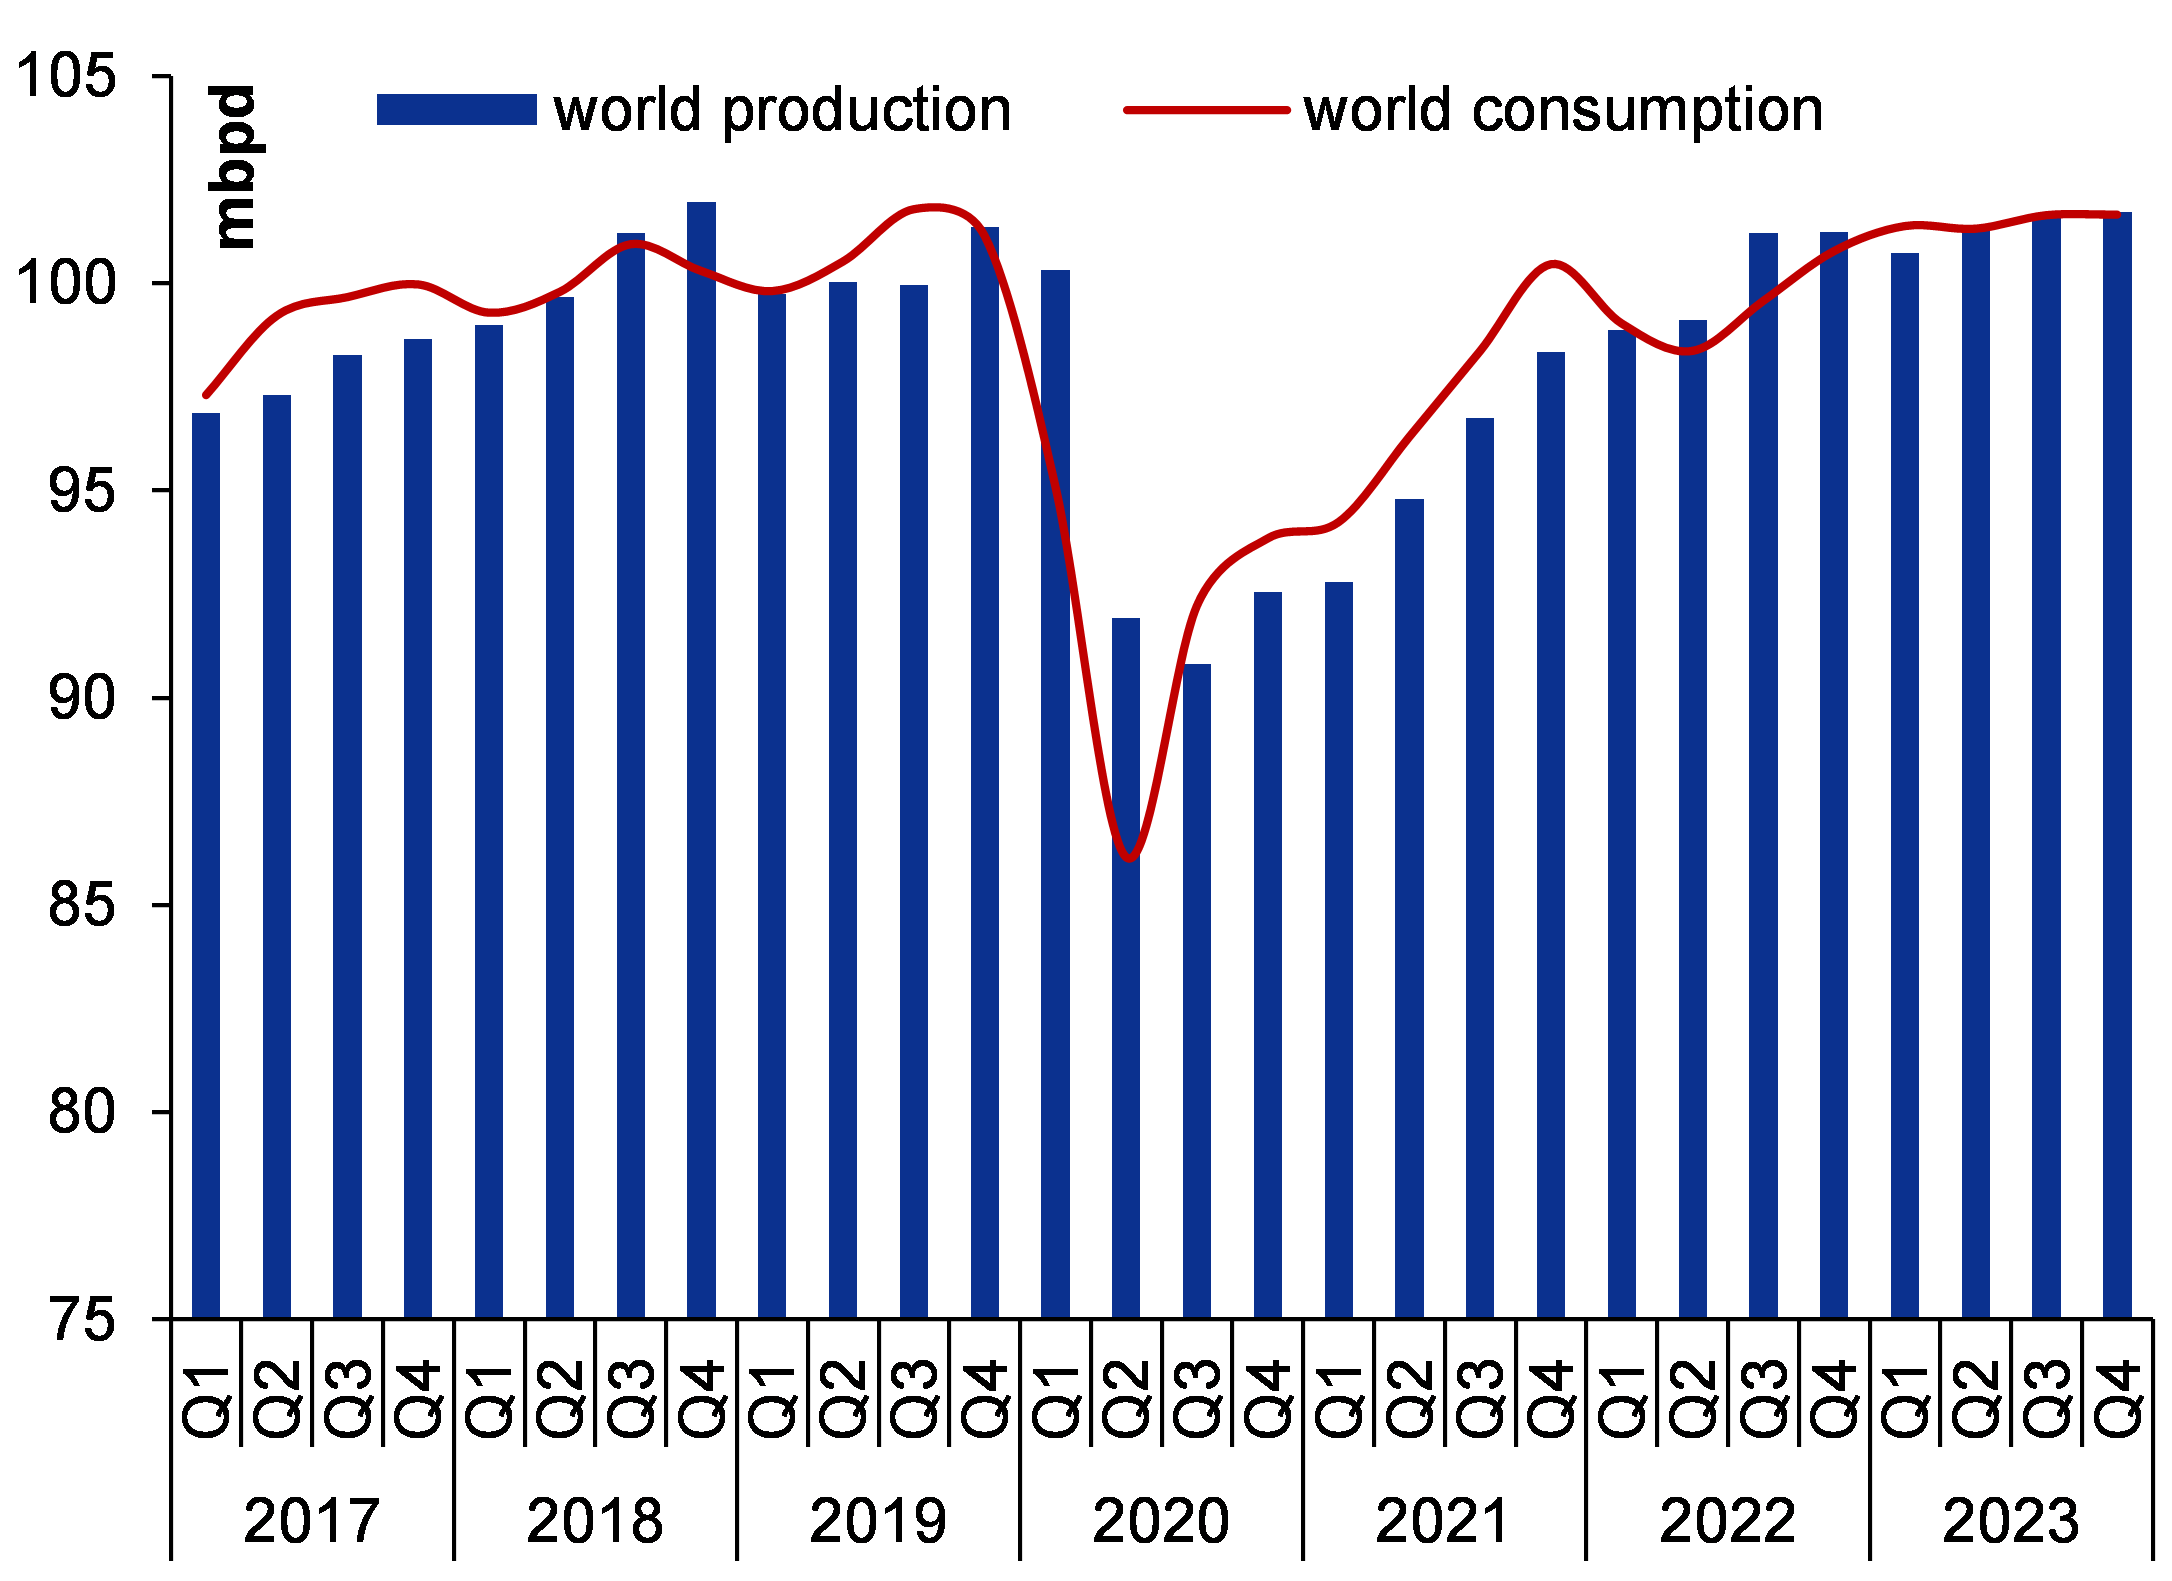
International Energy Agency or IEA is projecting a robust demand environment

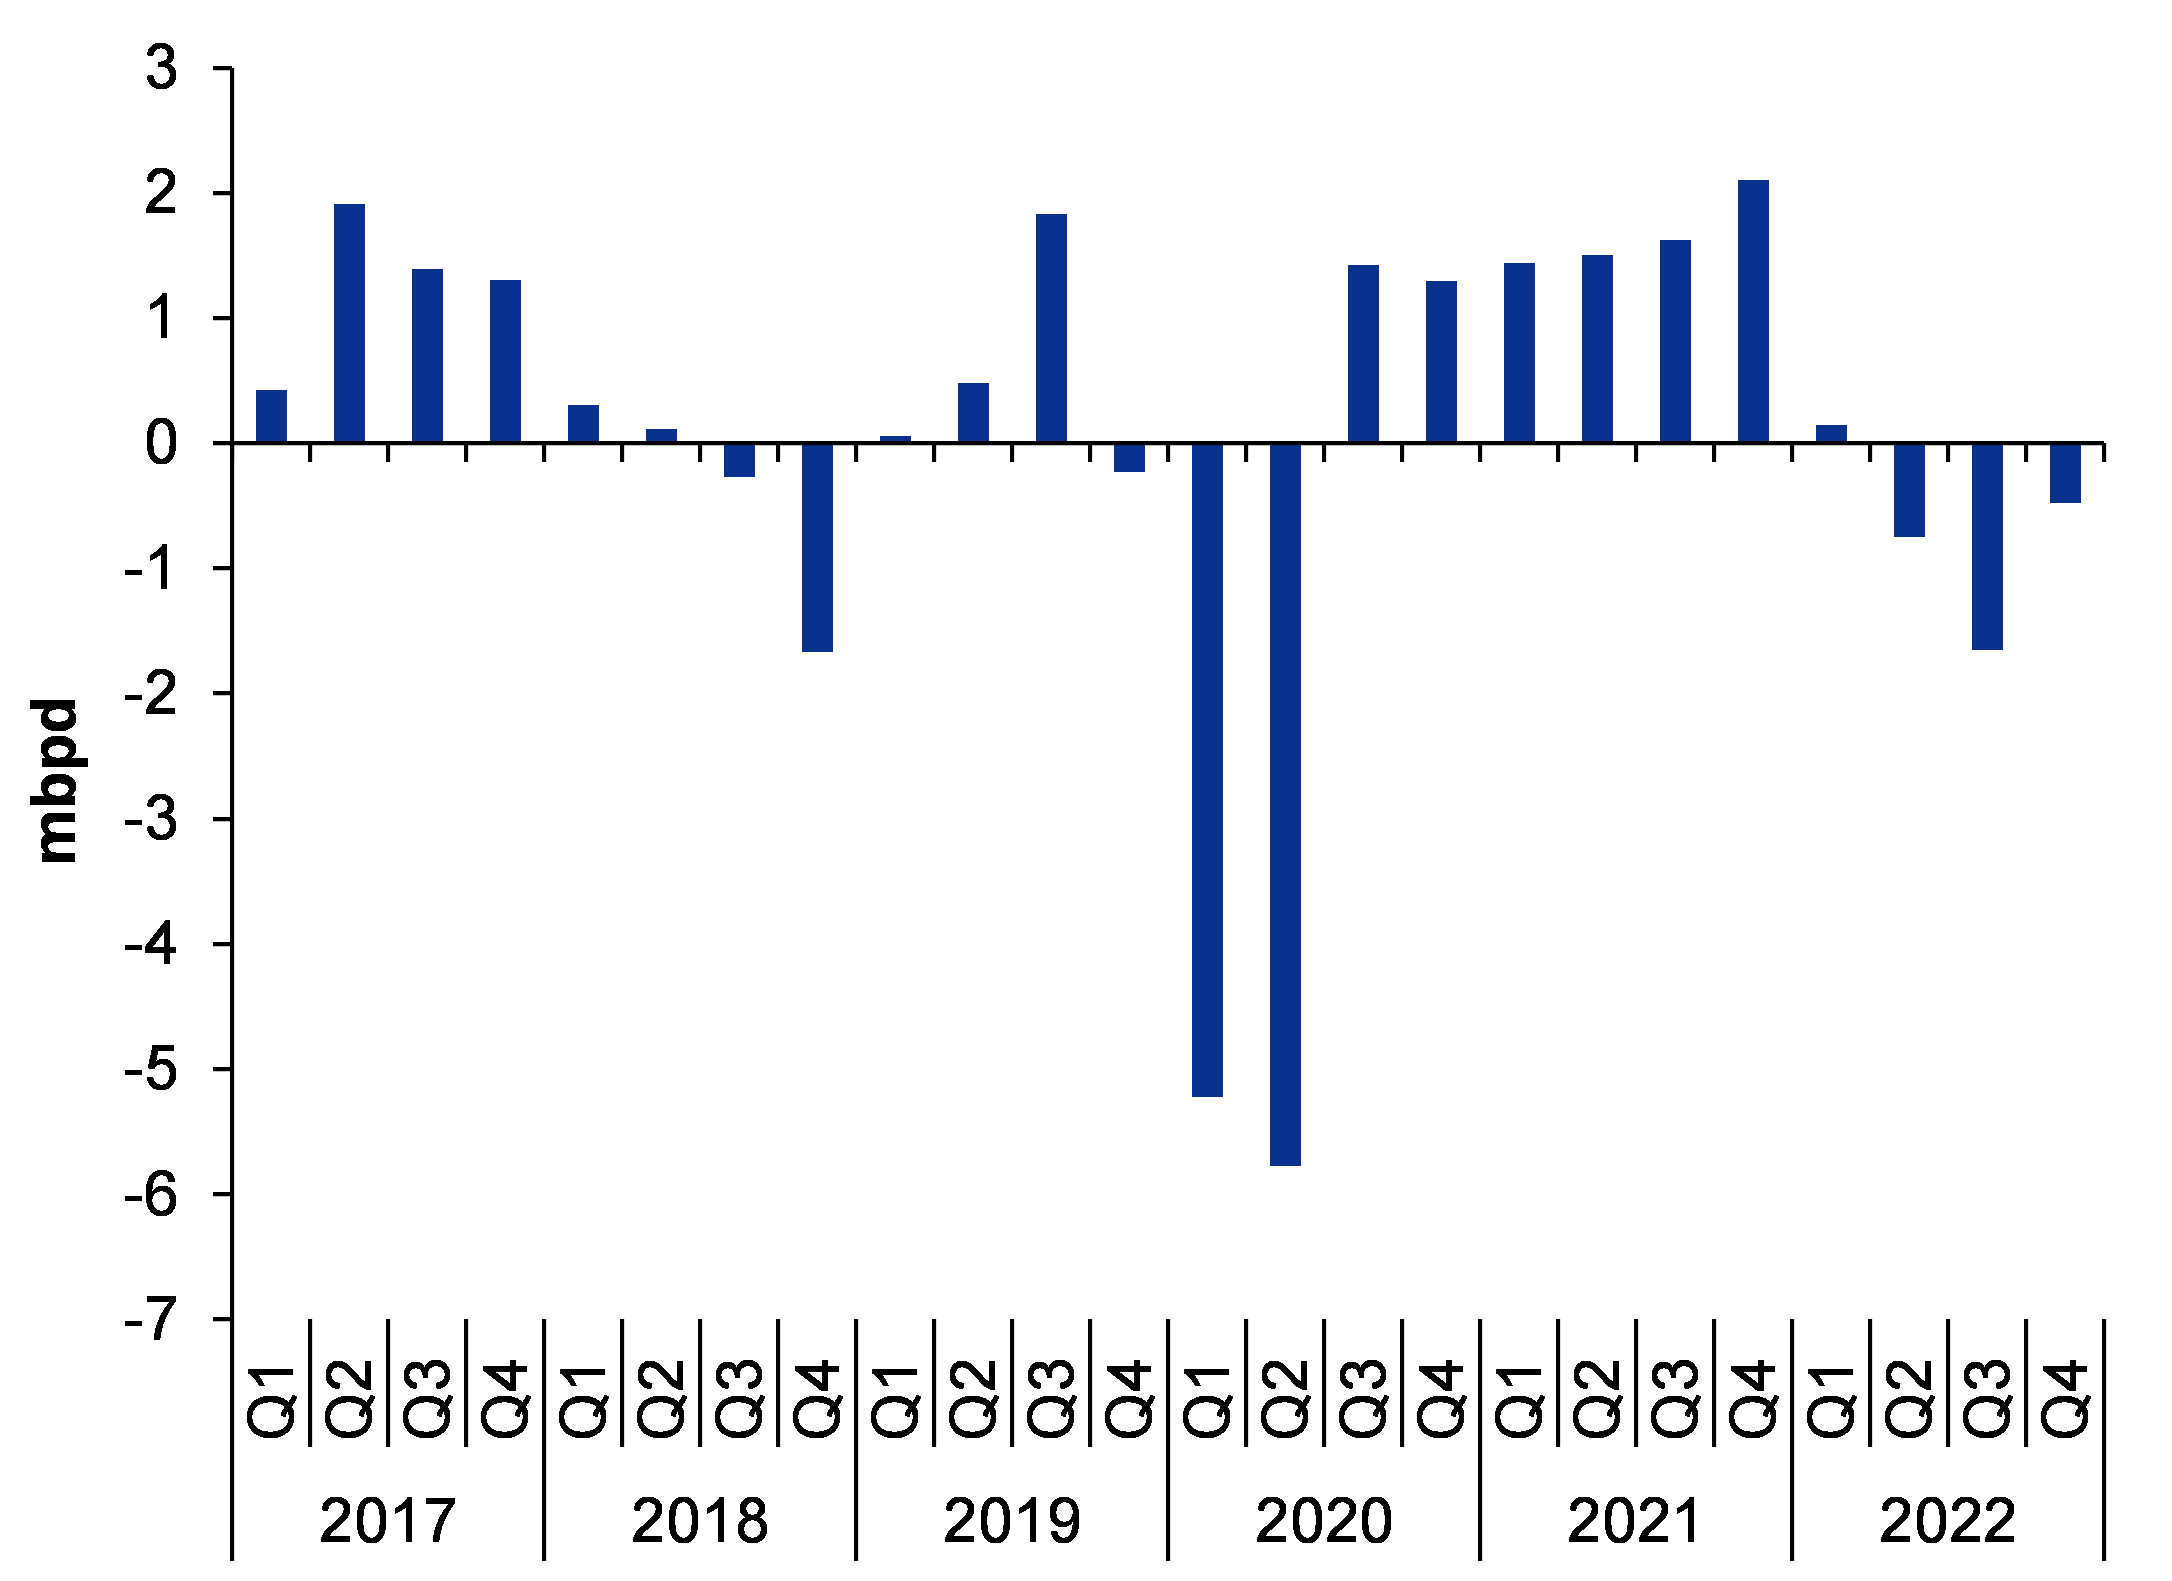
Figure 8: Global production of crude oil is seen higher than demand in 3QCY22F

SOURCE: INCRED RESEARCH, COMPANY REPORTS

Figure 9: Stock drawdown is also projected by IEA

SOURCE: INCRED RESEARCH, COMPANY REPORTS

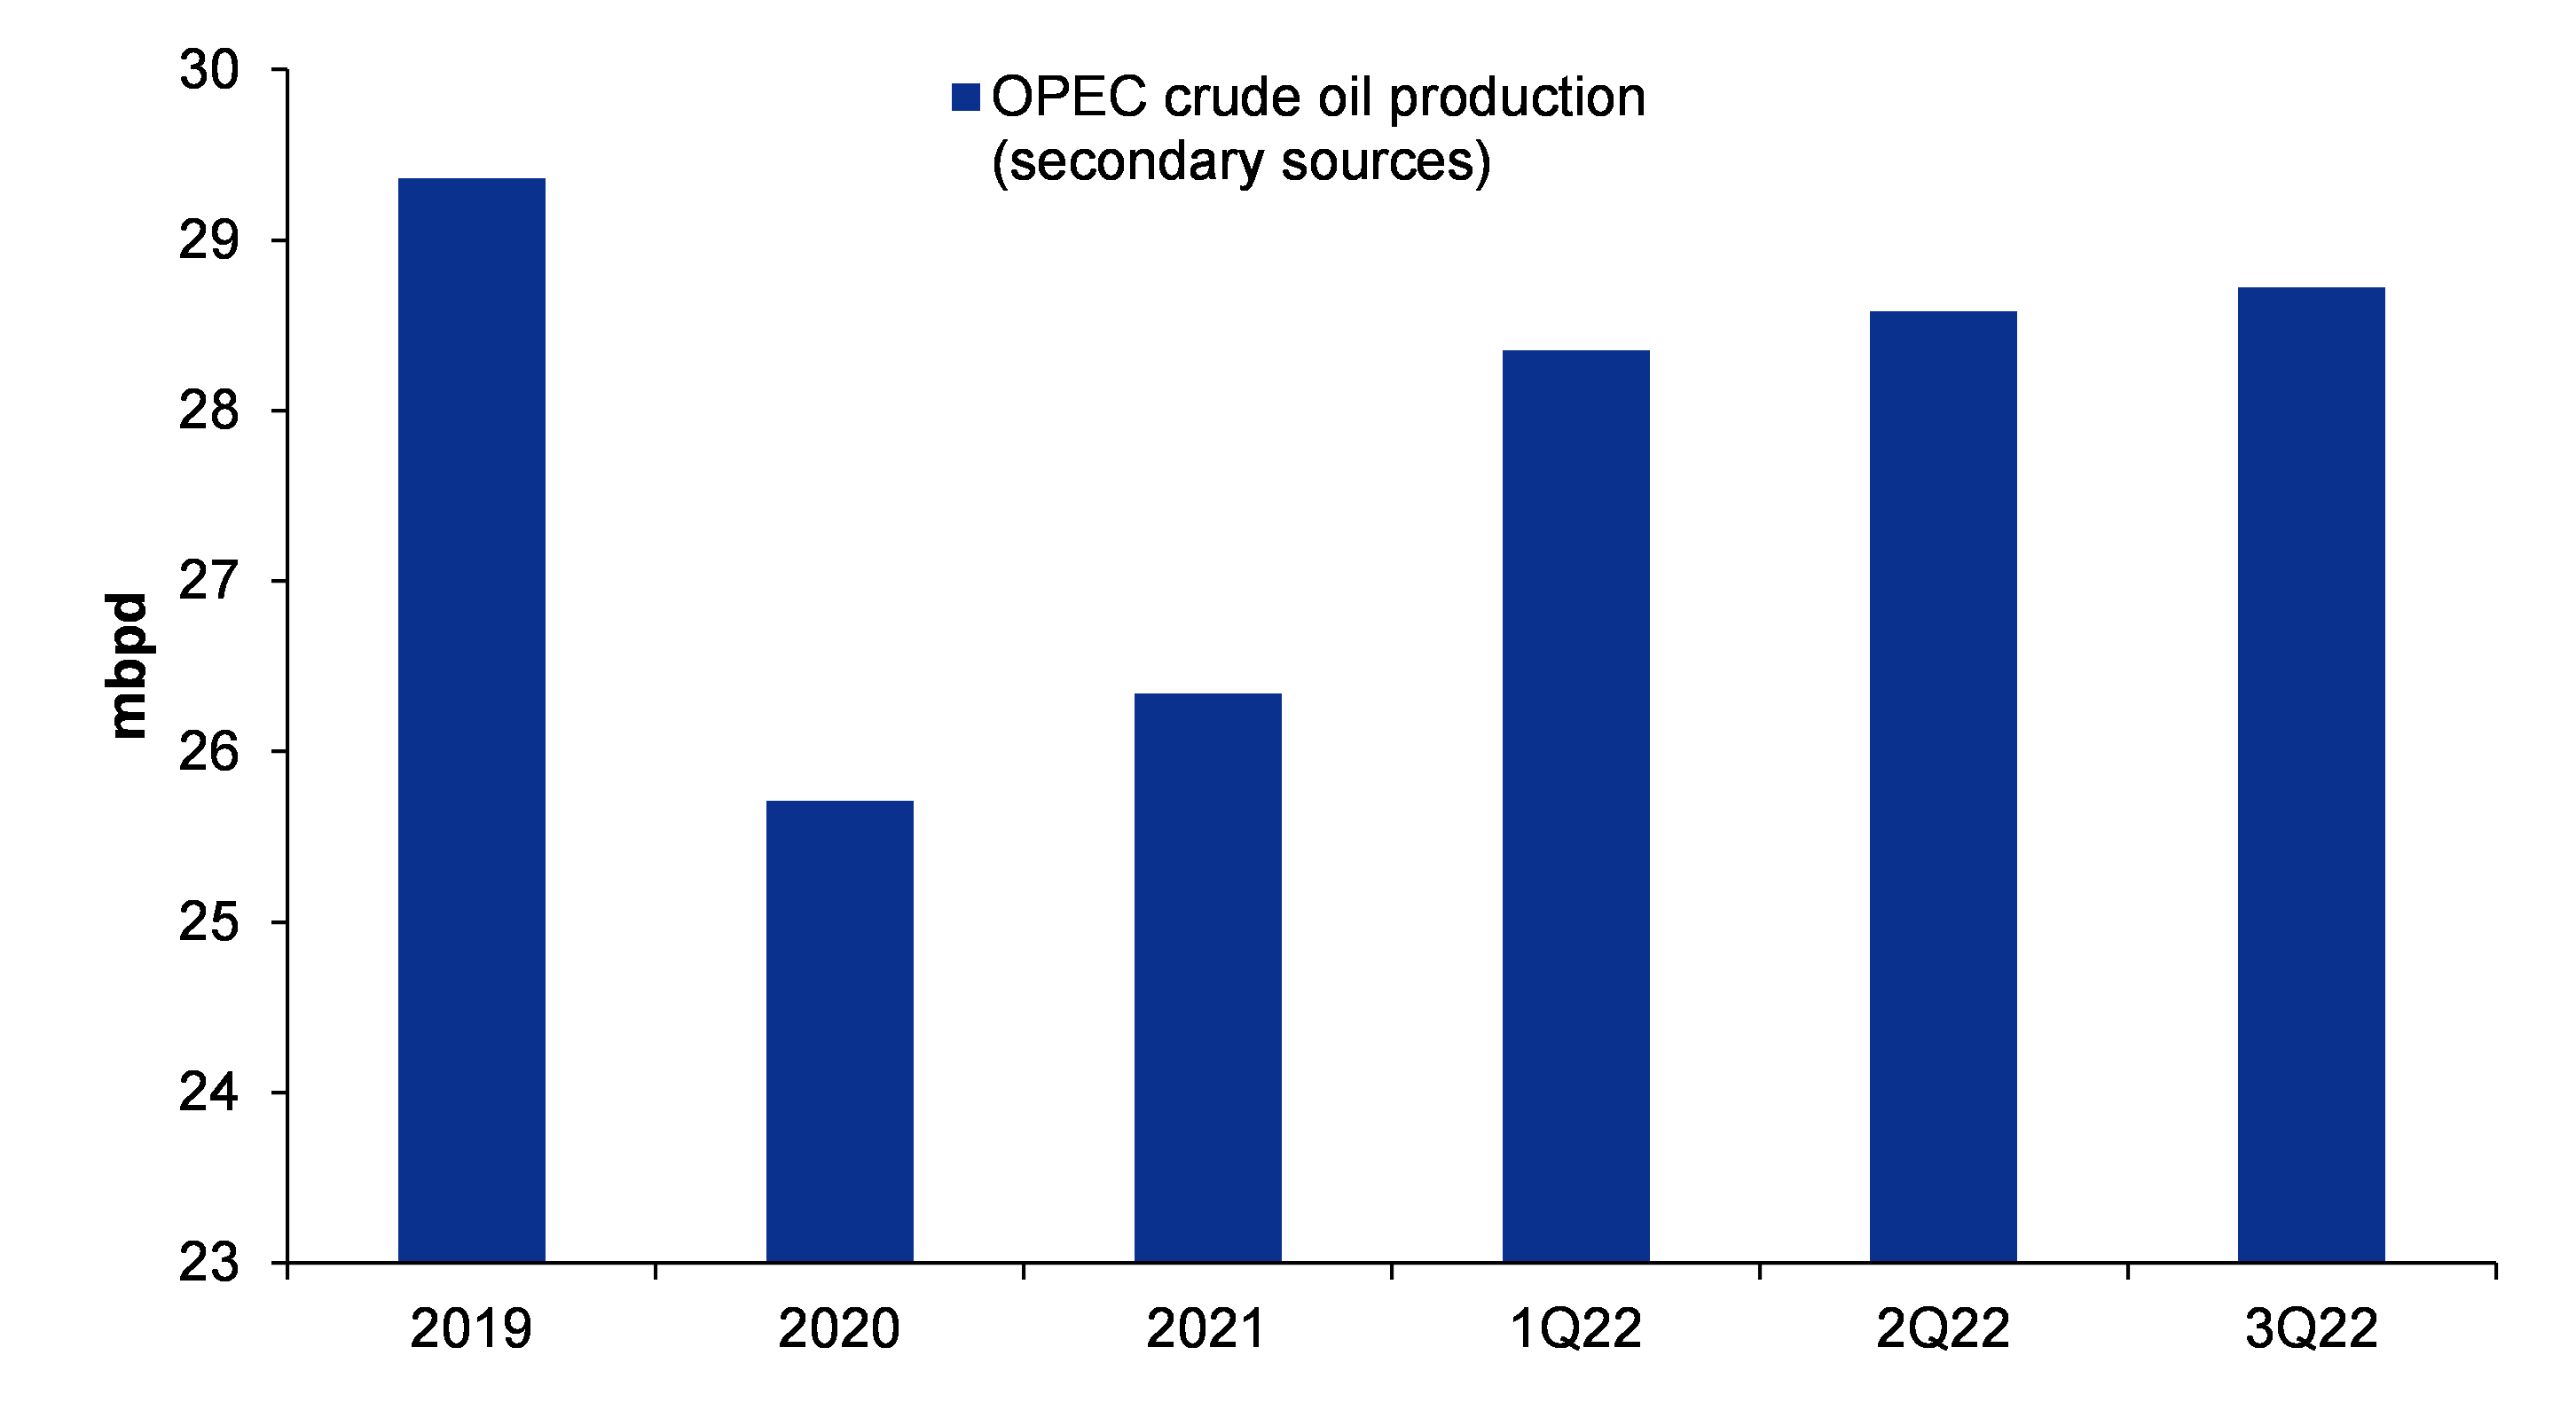
OPEC production to show a QoQ increase in 3QCY22F

Figure 10: OPEC production is likely to increase to 28.75mbpd during 3QCY22F, which will exert pressure on crude oil prices

SOURCE: COMPANY REPORTS, INCRED RESEARCH


In the long run, Aramco to show a deficit in production

Figure 11: Current investment in oil is not sufficient to keep the production at current level, forget increase in production

SOURCE: ARAMCO INVESTOR PRESENTATION, INCRED RESEARCH

World appears to be totally dependent on OPEC to make investment  and raise production

It appears the western world believes that it’s the Middle East region’s responsibility to raise production and cater to their demand. This line of assumption is not subscribed by one of the largest oil producing countries in the world i.e. Saudi Arabia (https://www.reuters.com/world/middle-east/saudi-crown-prince-says-unrealistic-energy-policies-will-lead-inflation-2022-07-16/)

Can global oil reserves be continuously drained for next two years and keep prices in control? Unlikely

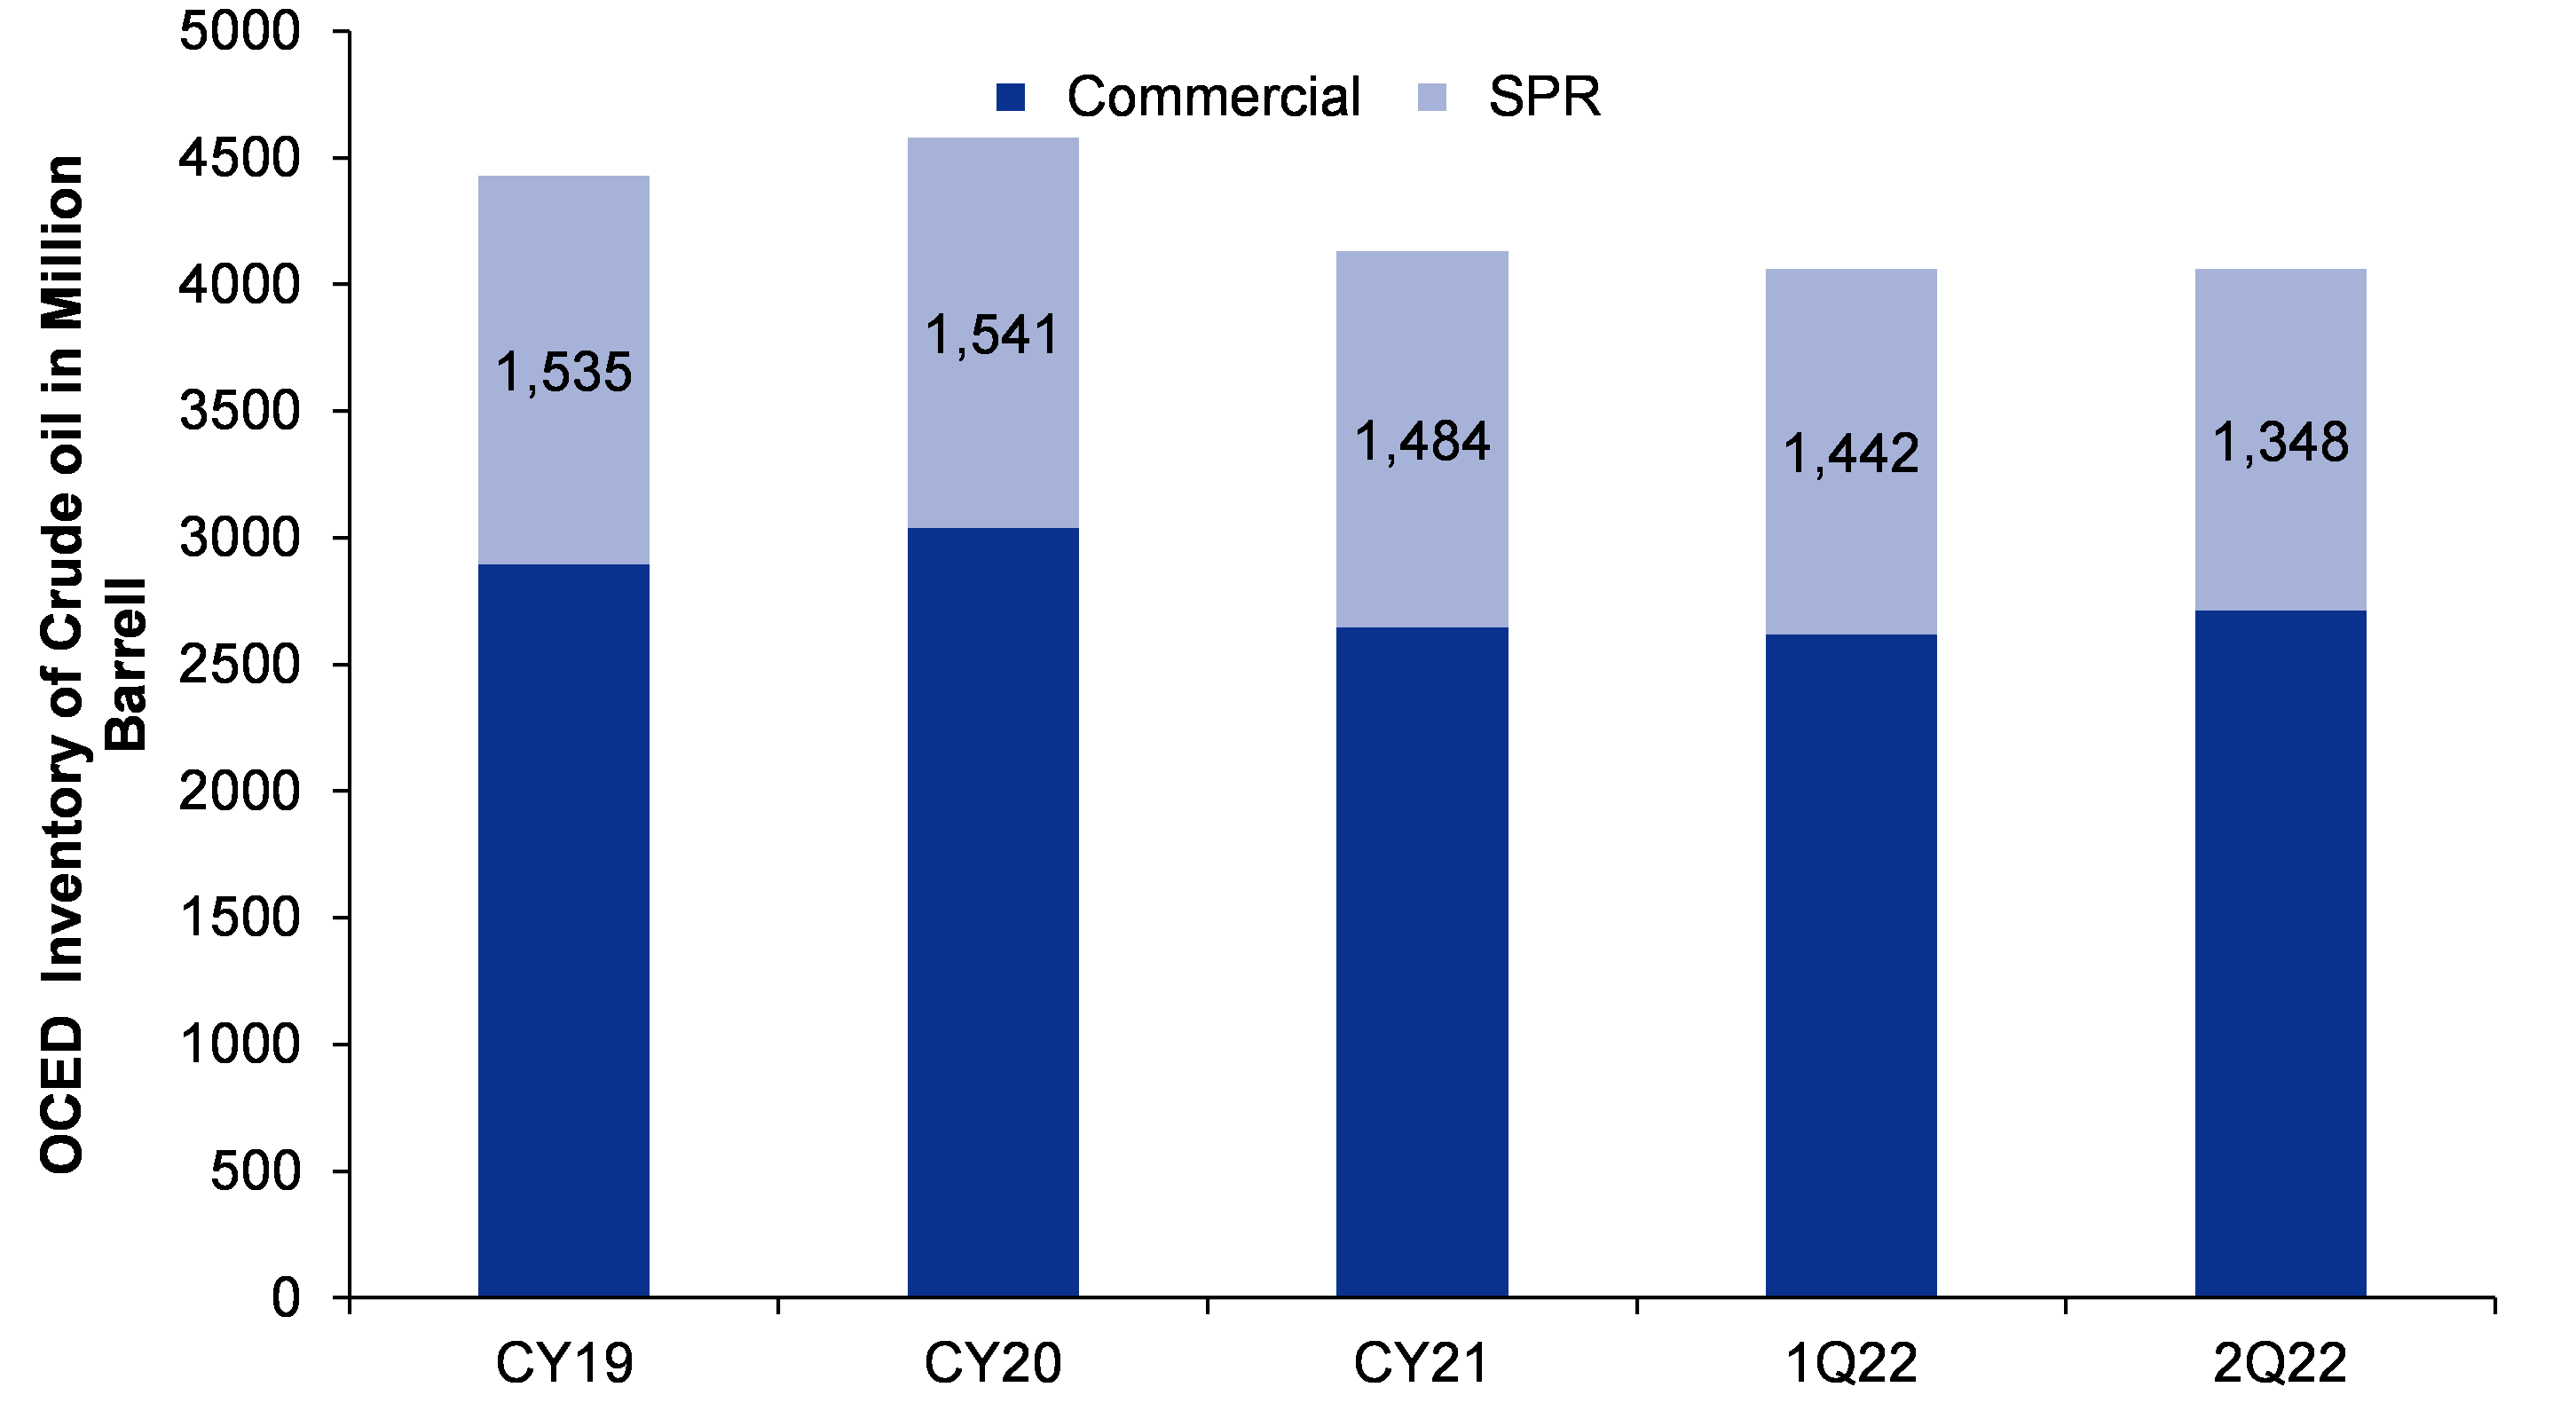
Keeping strategic petroleum reserves (SPR) is an insurance for any nation or a group of nations. The threat perception can keep changing over the course of time and one can take a decision to reduce SPR. Historically, it’s the western world which has kept a significant SPR. Given the current scenario, it’s very difficult to envisage a scenario where western or OECD (Organisation for Economic Co-operation and Development) countries will relinquish this insurance policy.

Figure 12: Over last two years, SPR of OECD nations has come down by 200mbbl and as of now, they are barely covered for 30 days

SOURCE: COMPANY REPORTS, INCRED RESEARCH

Only hope for oil inflation to go down is recession and that too a protracted one, but that  doesn’t look likely

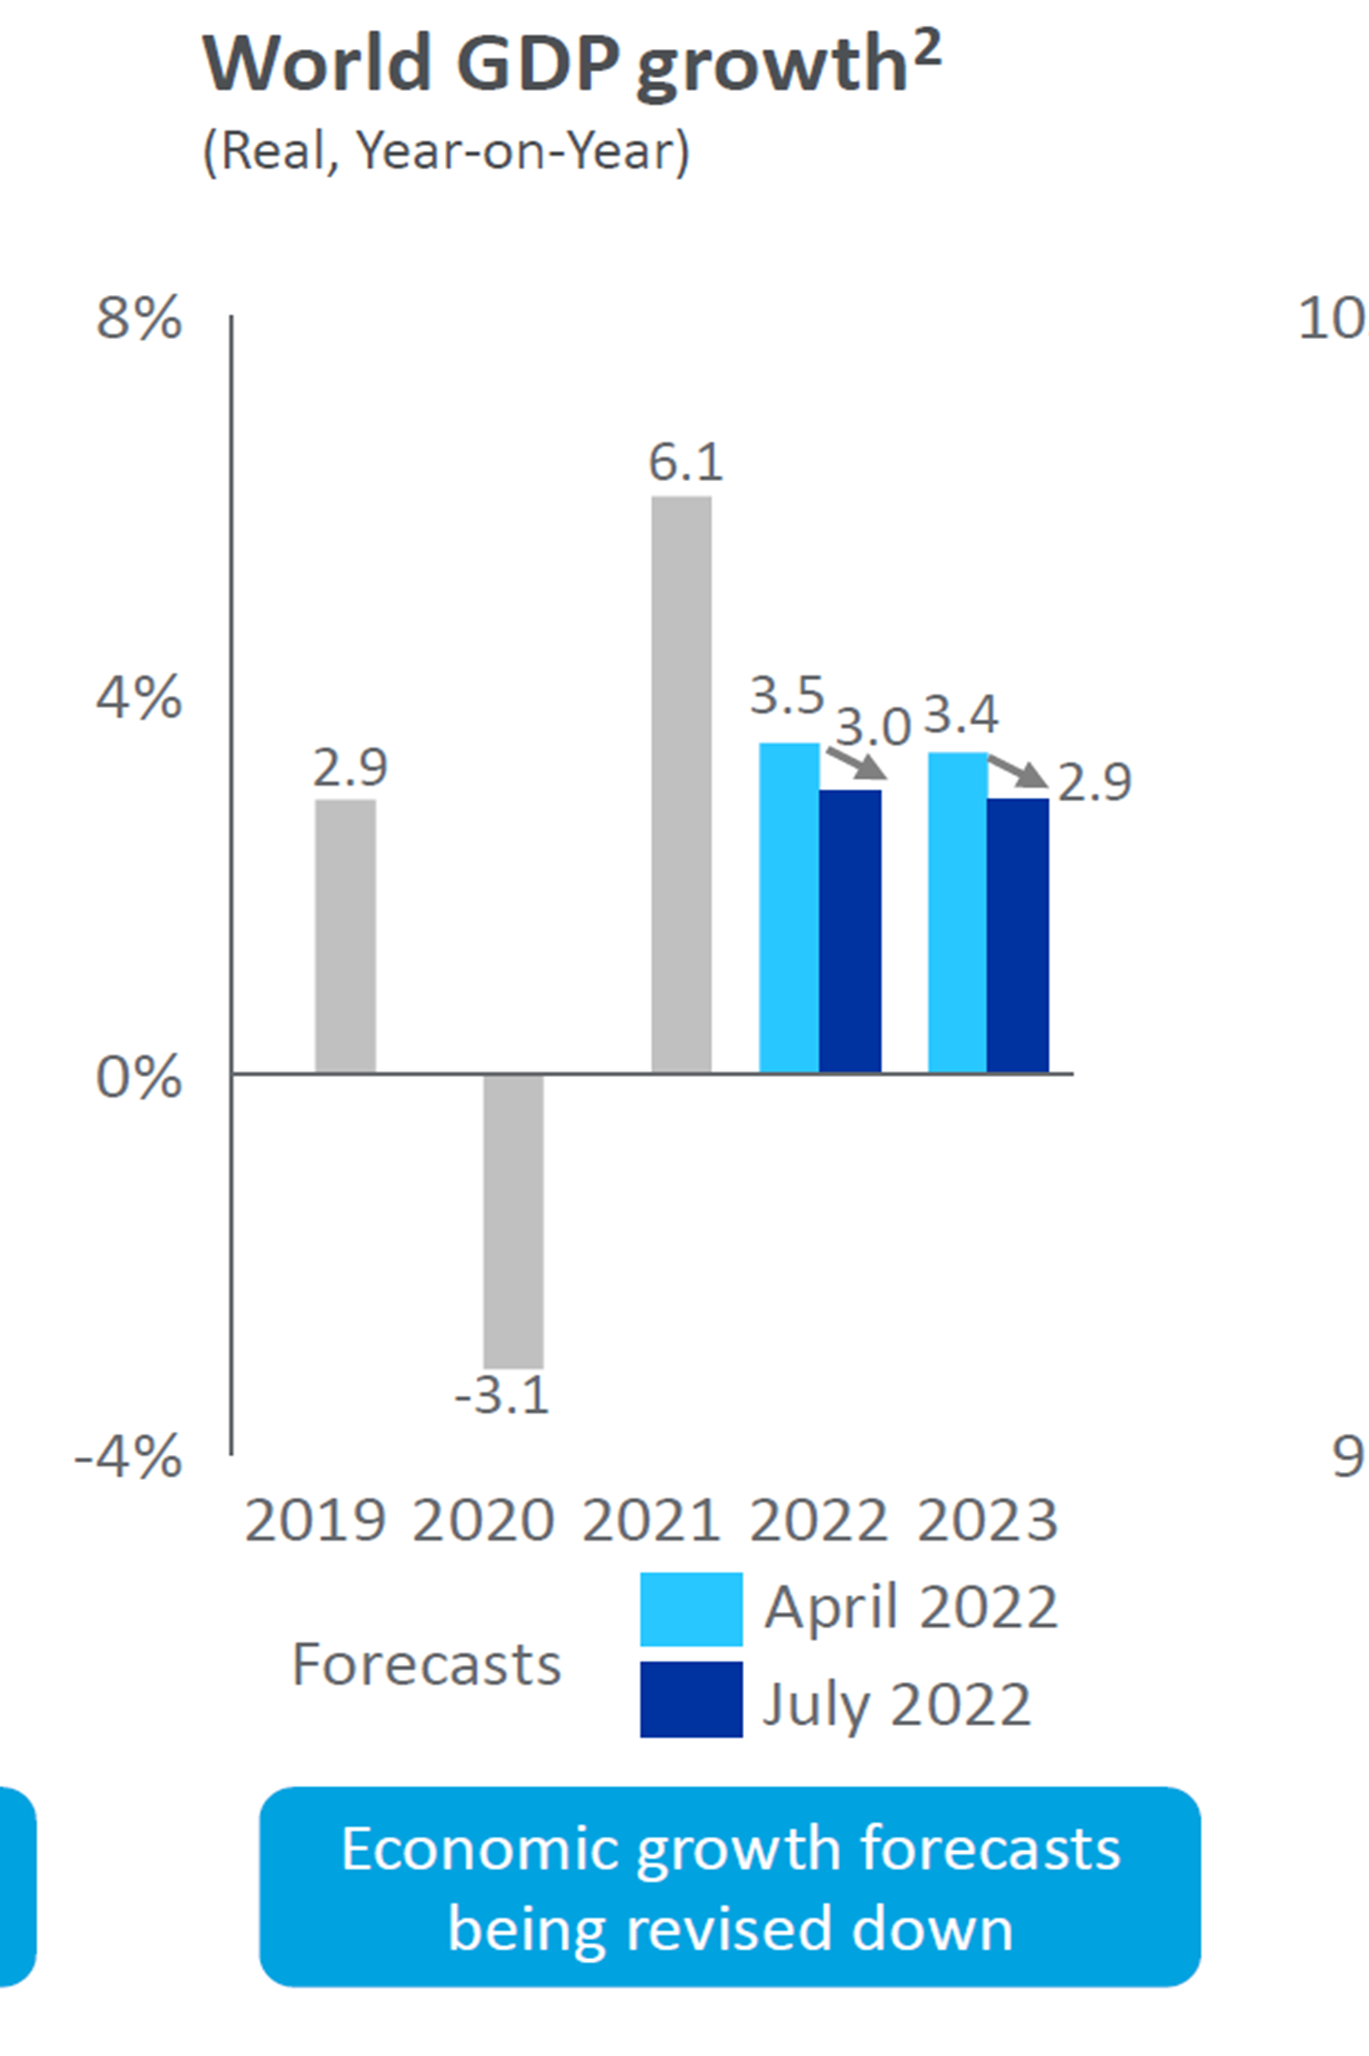
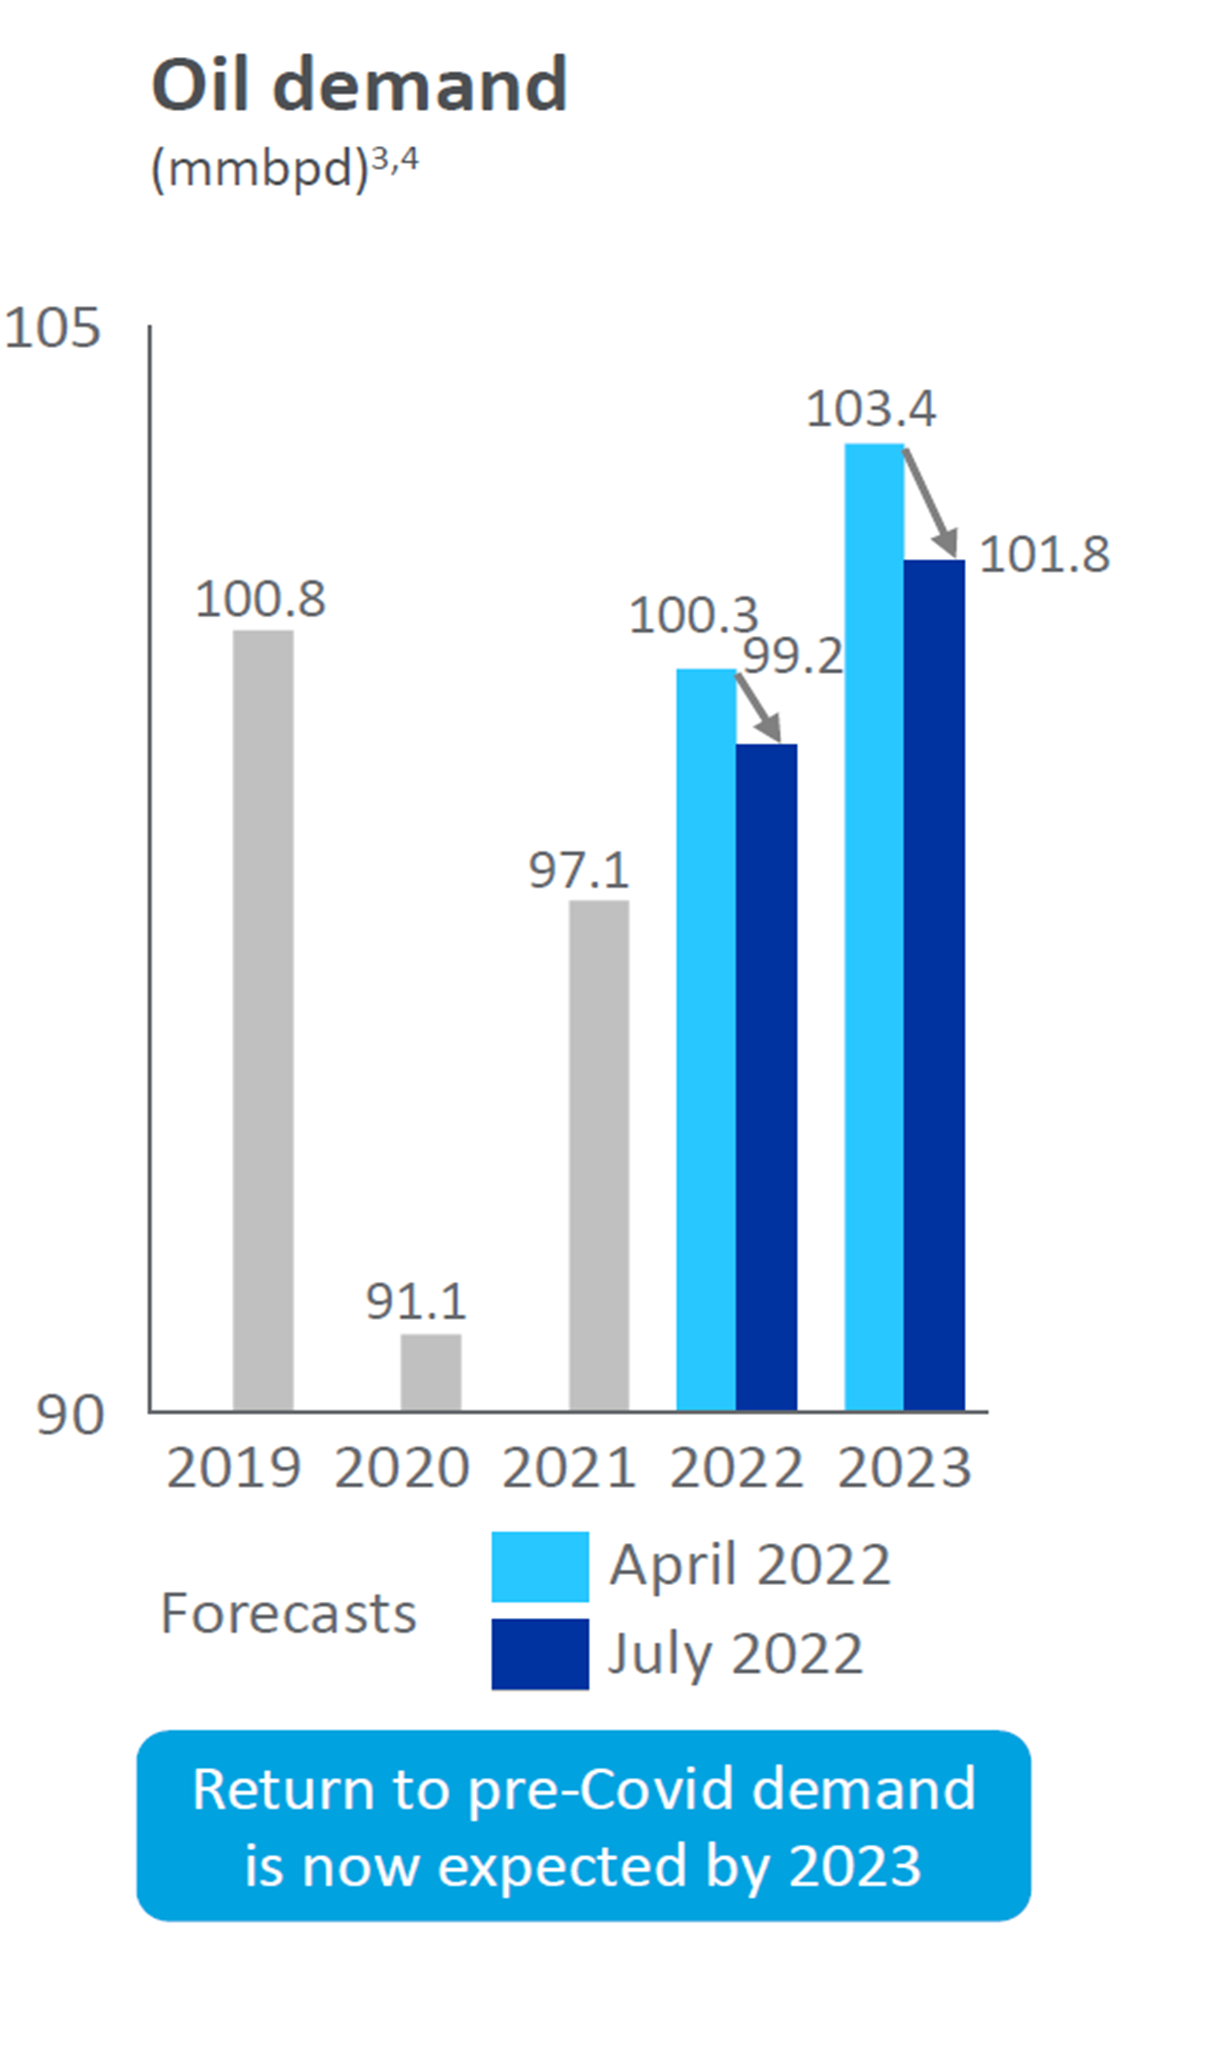
If one believes the current forecasts, then by 2023F we will reach 102mbbl global oil demand and by 2025F we may reach 103-104mbbl.

Figure 13: While global GDP is likely to grow at a slower pace, it’s nowhere near recession

SOURCE: ARMACO PRESENTATION, INCRED RESEARCH

Figure 14: Global oil demand is likely to touch 102mbbl by 2023F

SOURCE: ARMACO PRESENTATION, INCRED RESEARCH

What is the optimal strategic oil reserve for USA and its allies? It must be higher than 25 days currently

SPR must be seen as an insurance policy against unforeseen scenarios. So, what is the optimal level depends upon the perception of safety. The new risk to OECD countries emanates from joint action of China and Russia. Given the status of USA and Europe refiners, our worst-case analysis indicates that even a weeklong blockade by Djibouti naval base of China can create chaos in USA. To be future proof, they need much higher reserves. Please note that Chinese exports have dipped suddenly and so, may be China is preparing for the worst.


USA is not self sufficient in oil even if it produces 15mbpd of WTI crude

USA refiners cannot process only WTI crude oil and so they need heavy sour crude. That’s why USA imports ~7mbpd of crude oil.

Figure 15: USA’s crude oil imports have remained ~7mbpd

SOURCE: INCRED RESEARCH, COMPANY REPORTS

SPR inventory has 40% heavy sour crude and as of now, its good for 26 days only

As per regulations, SPR inventory should have 40% of sour crude i.e. crude which is imported from the Middle East countries. As at end-Jul 2022, overall SPR inventory had 176mbbl sour crude, which is good enough for 26 days of imports.

If sour crude imports to USA are blocked, can USA still be self- sufficient? No, it won’t. USA needs to change its total refinery complex, which can take several decades

While it’s true that USA is increasing production of light sweet crude oil, but most refineries connected to the production sites are built to handle heavy sour crude oil. USA need new refineries and new pipelines to be built to process the light crude oil, but that will take several years.

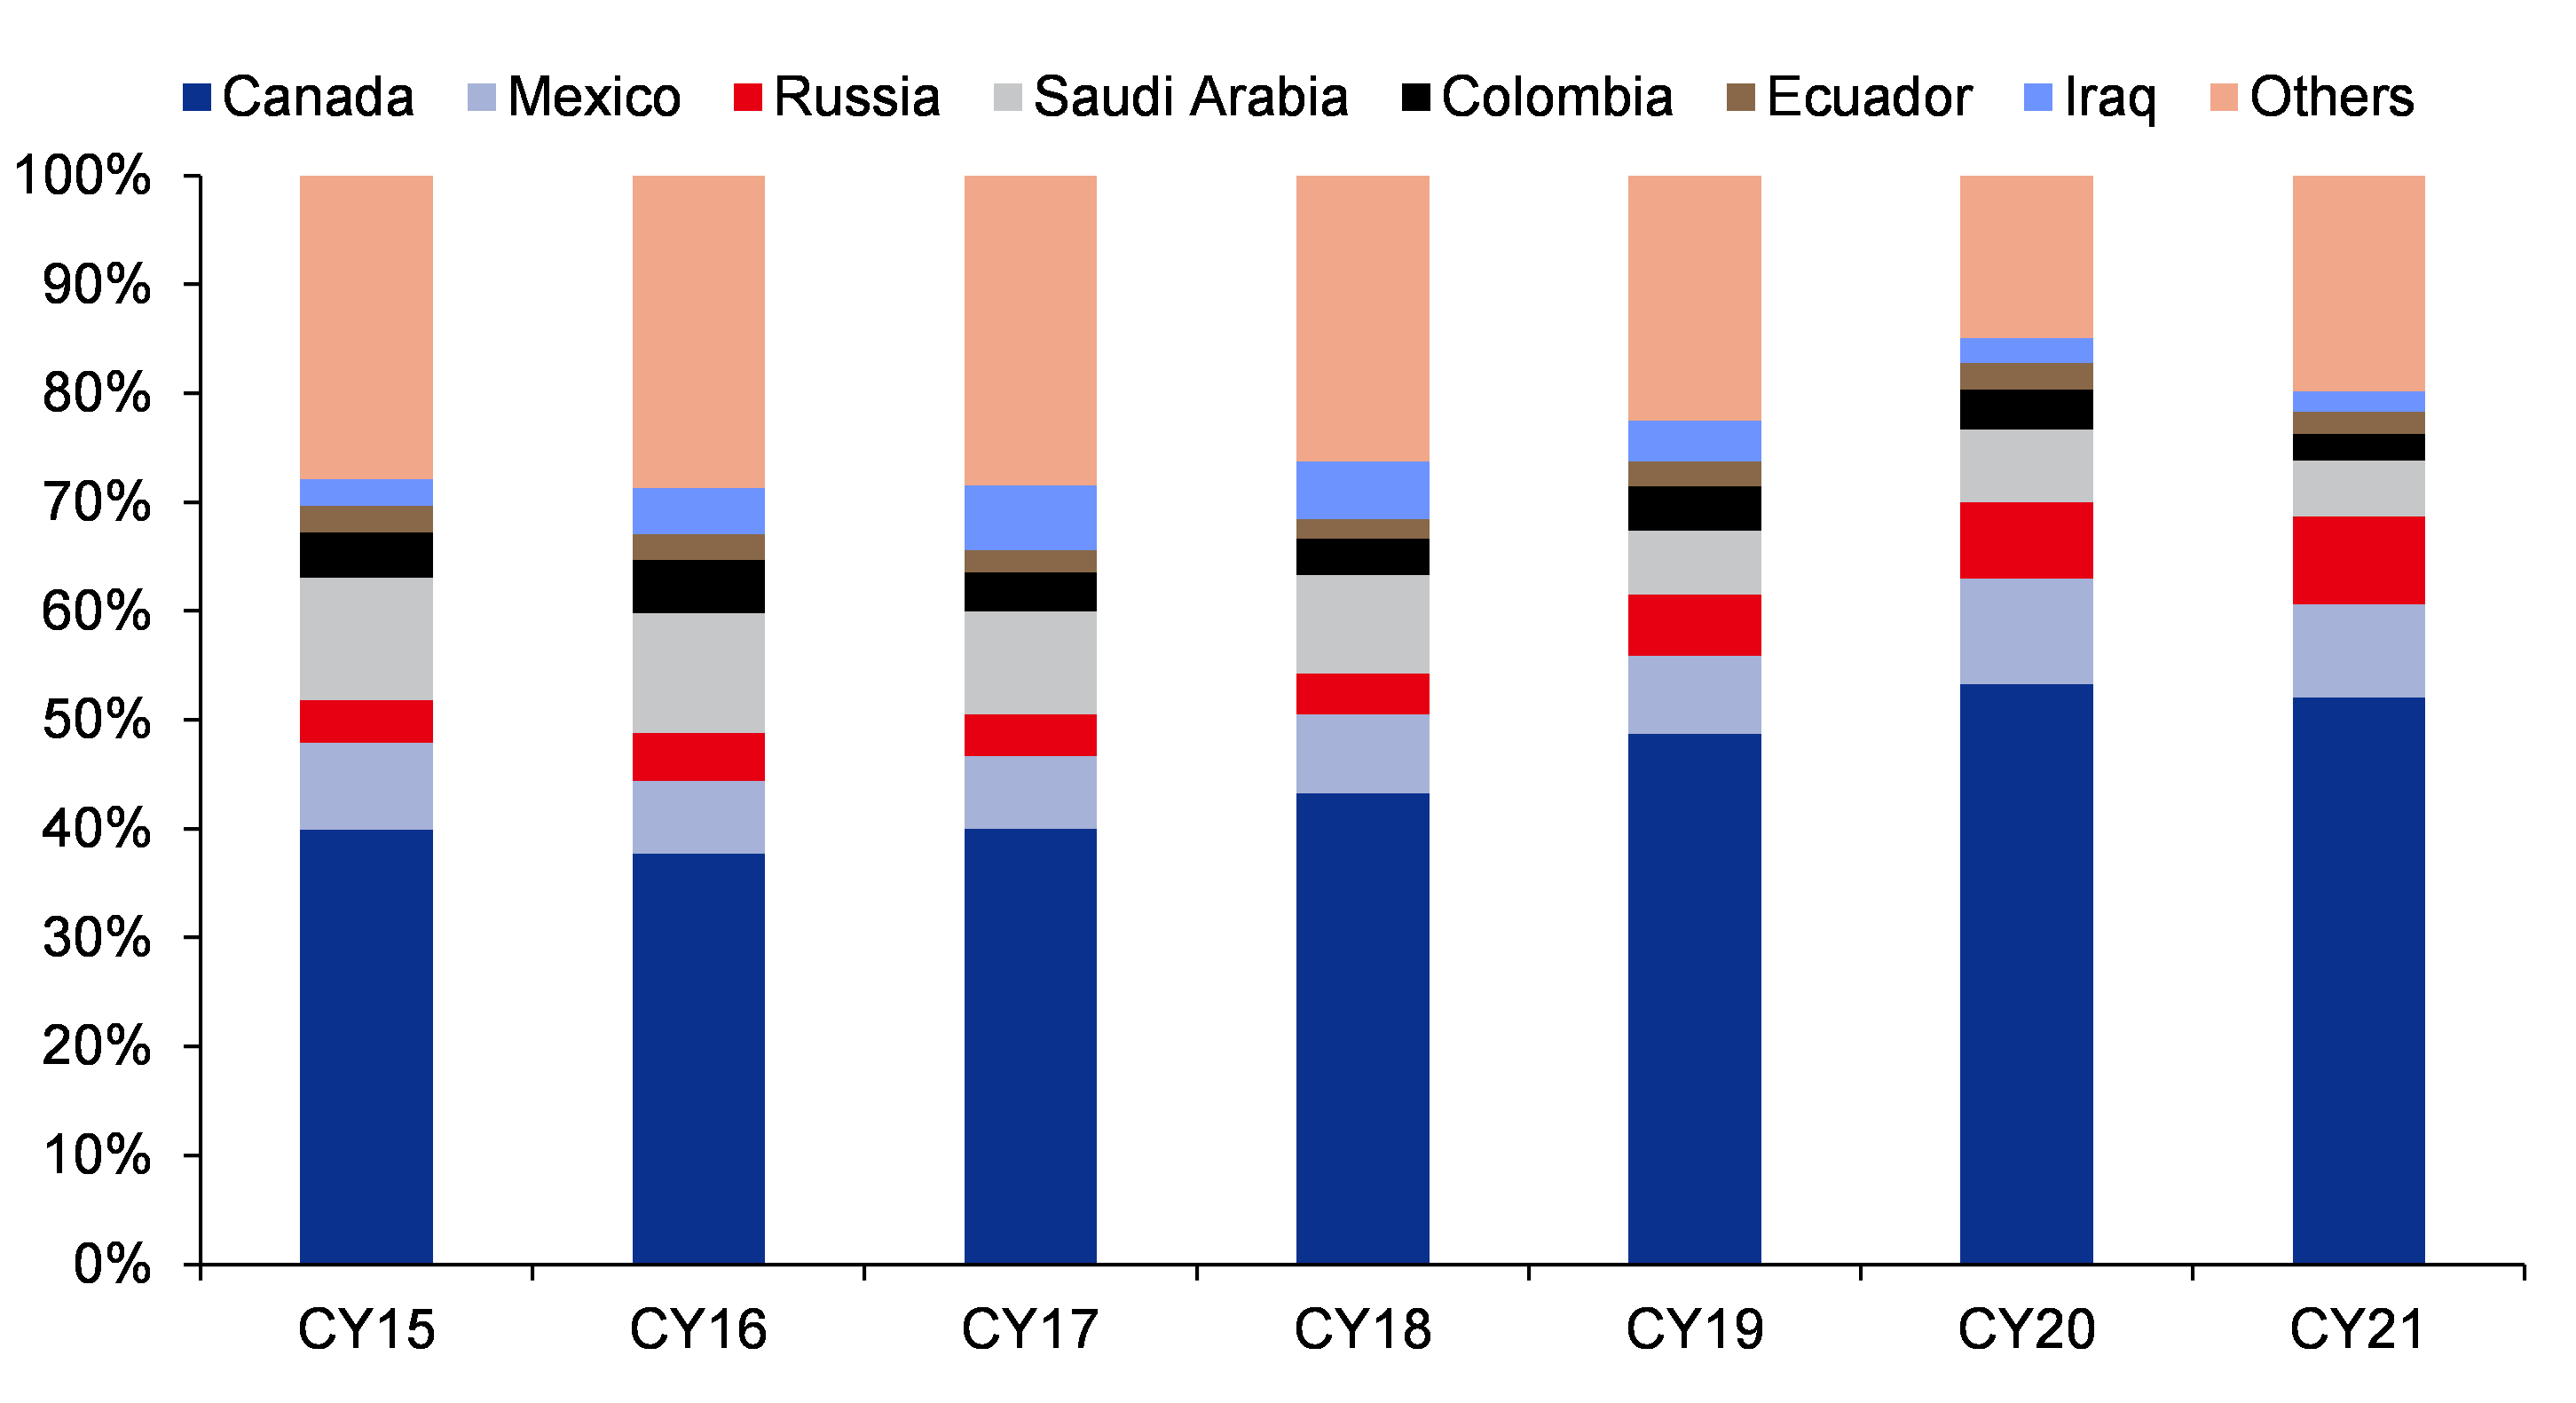
But USA has hedged its risks well as most of its crude oil imports are from Canada

Figure 16: USA imports almost 50% of its crude oil requirement from Canada and a very low percentage comes from the Middle East and Persian Gulf

SOURCE: INCRED RESEARCH, COMPANY REPORTS

But what about other European countries?

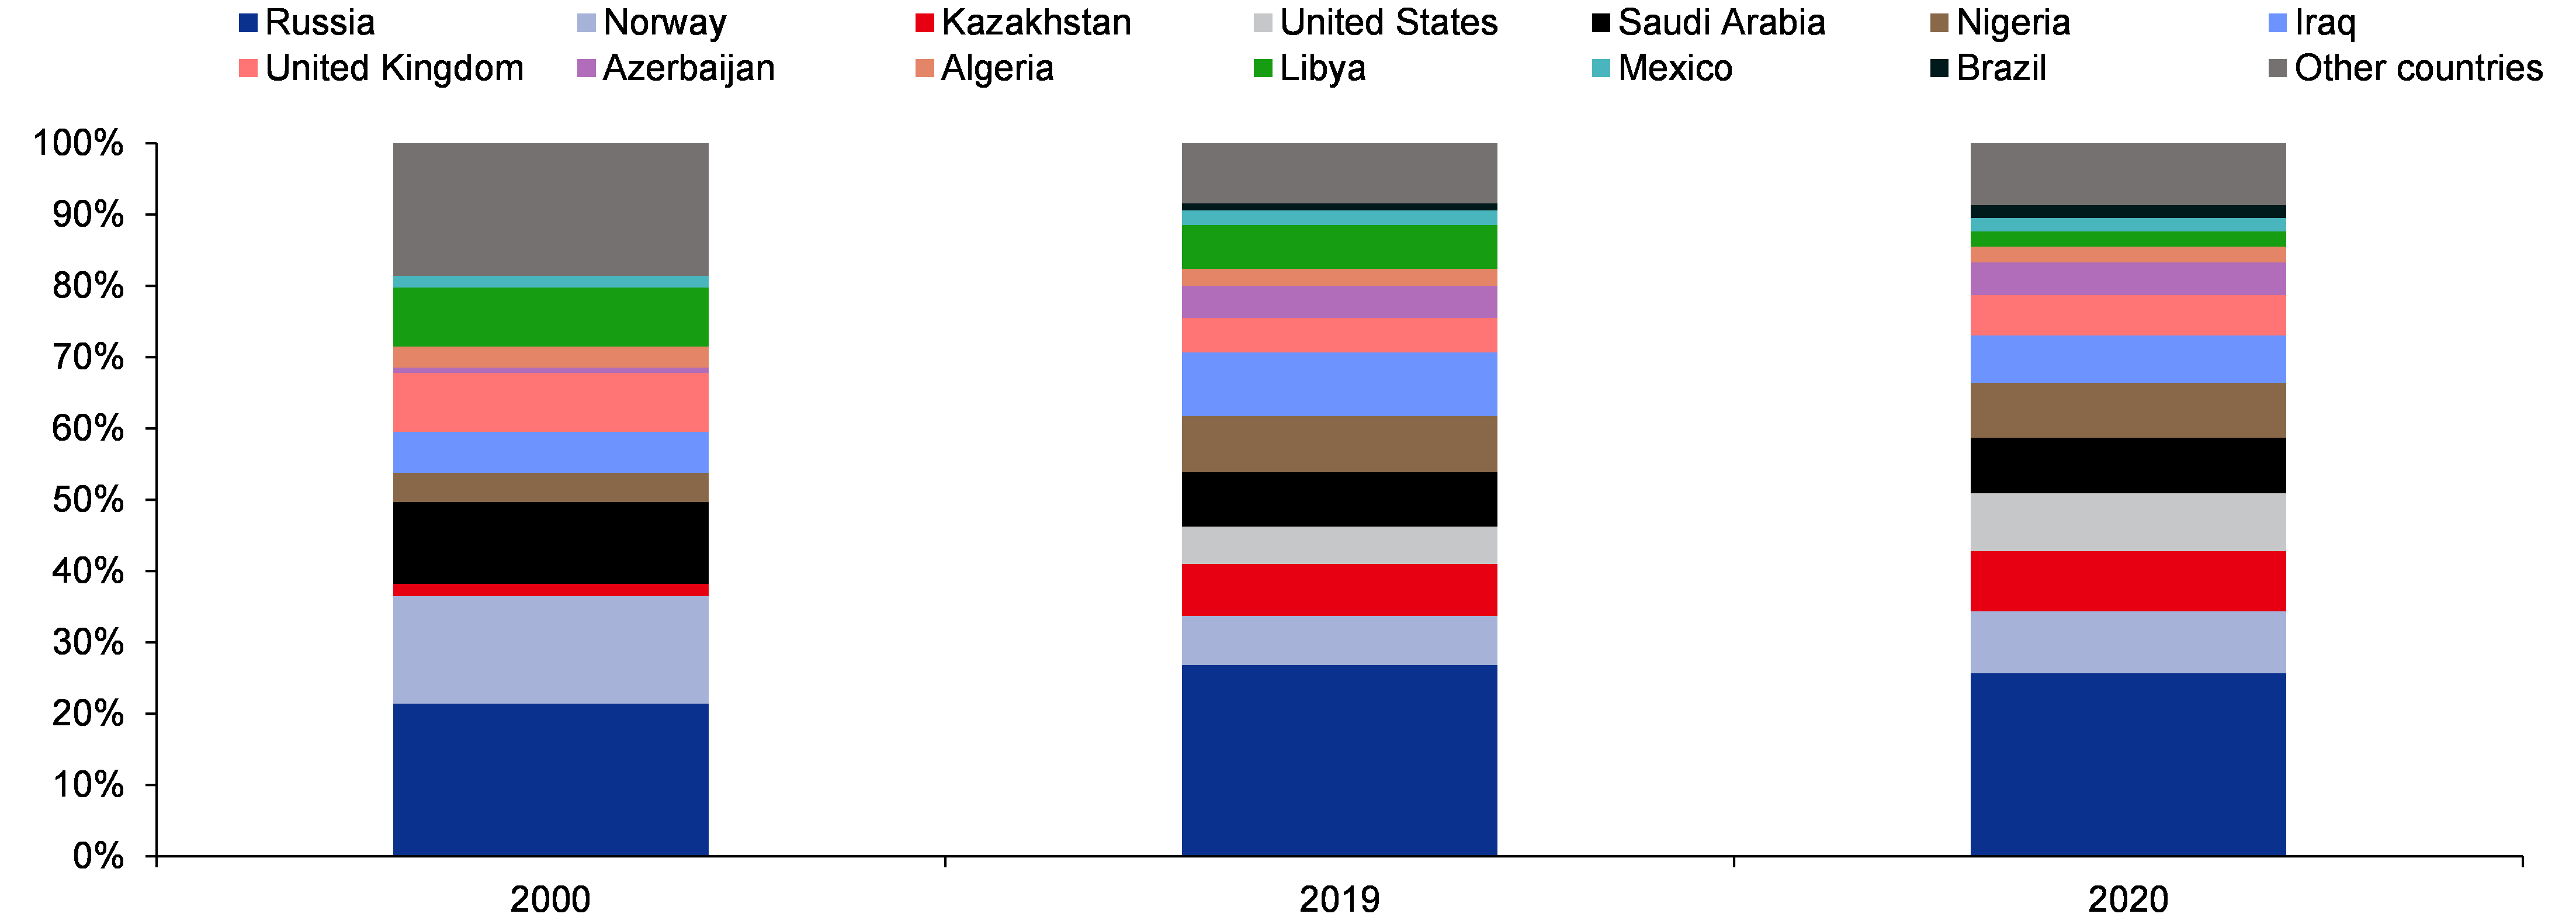
Figure 17: As Russian crude oil remains out of bounds for them, they will be heavily dependent on the Middle East countries to meet their requirement

SOURCE: COMPANY REPORTS, INCRED RESEARCH

Europe has higher SPR compared to USA but after Russian crisis, things have changed and dependence on the Middle East is much higher

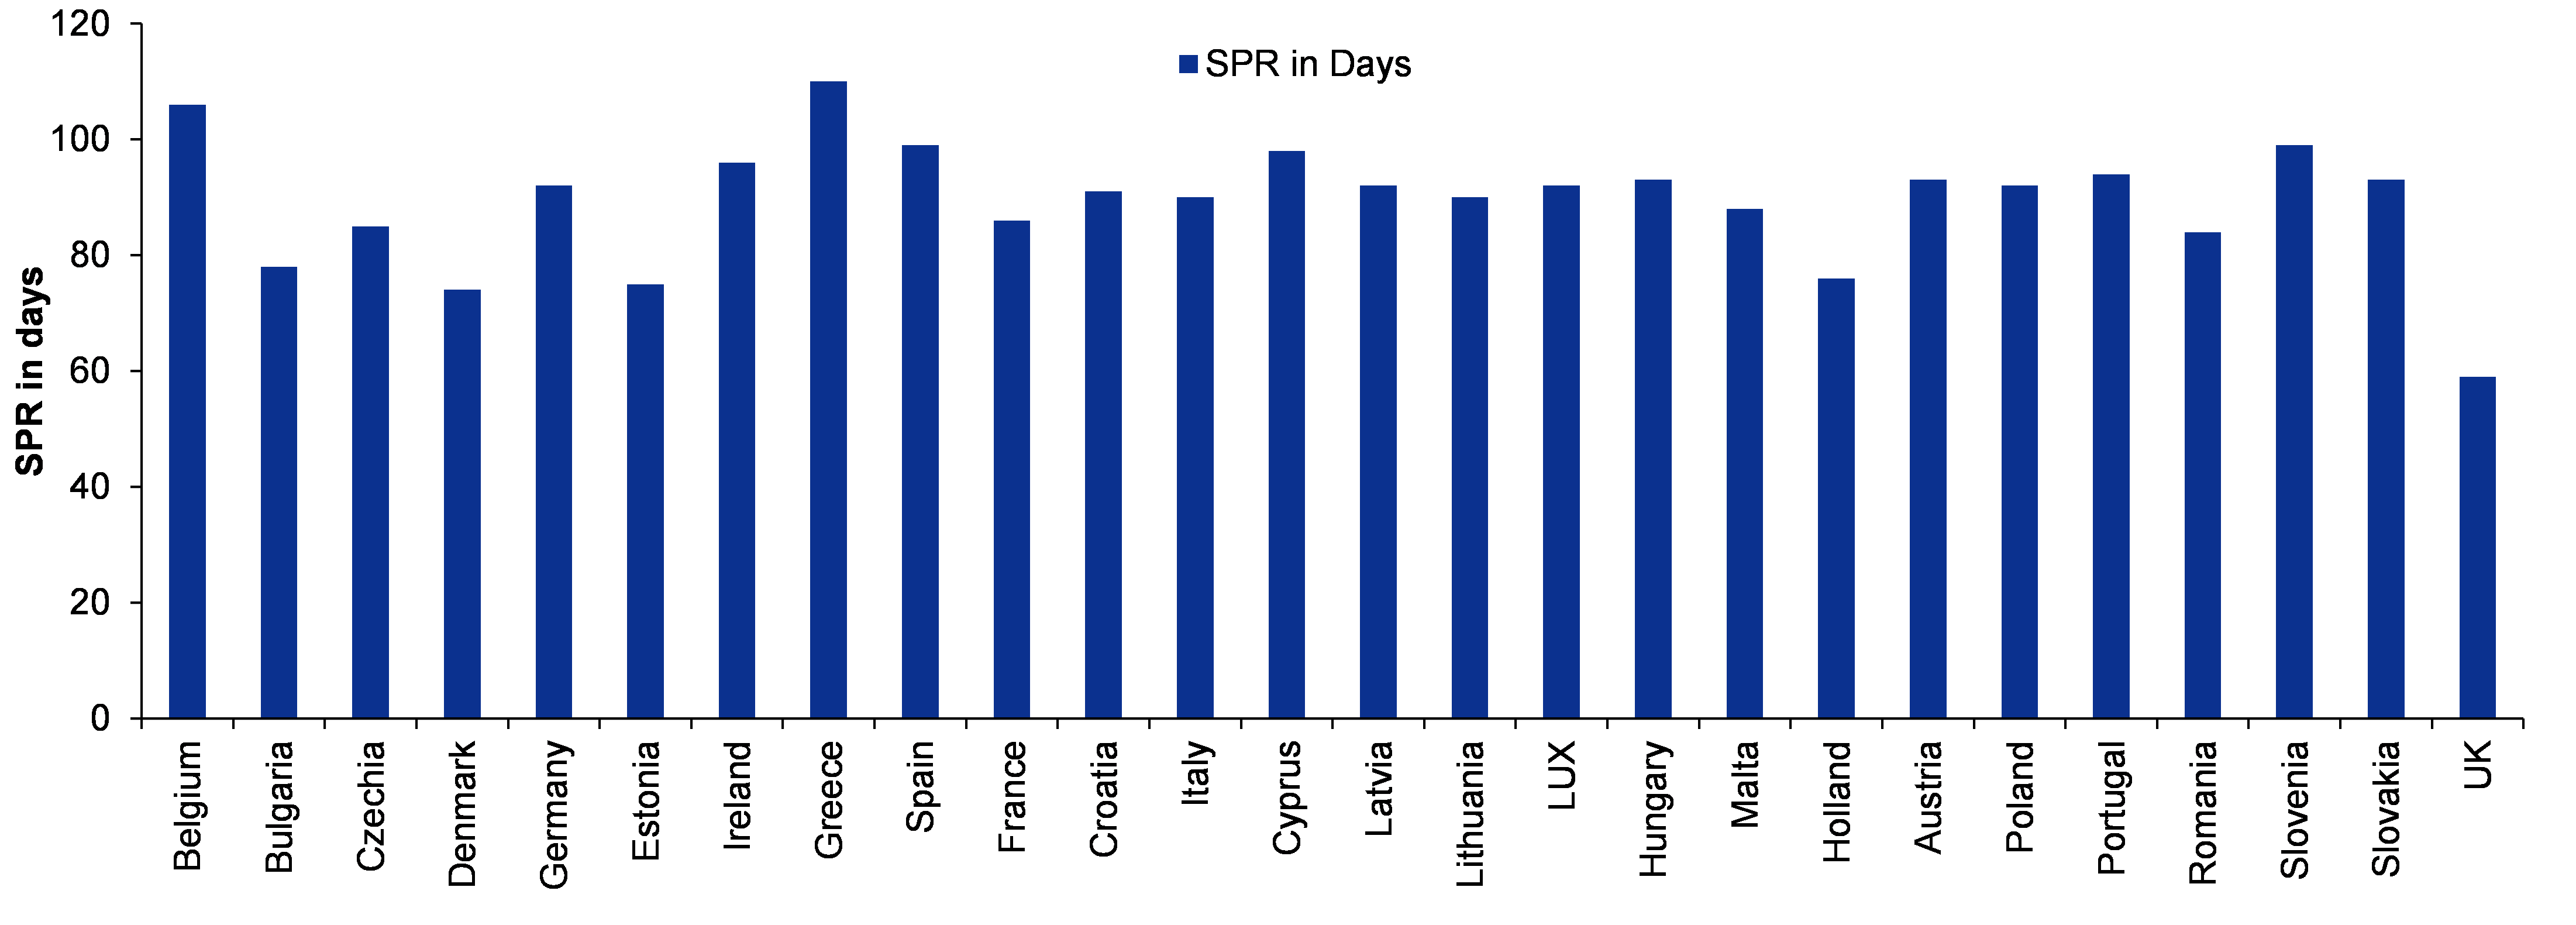
Figure 18: As per OECD guidelines, these countries are mandated to keep 90 days of SPR but at the end of 2019, the scenario was different

SOURCE: INCRED RESEARCH, COMPANY REPORTS


The predicament of Europe is an opportunity for China

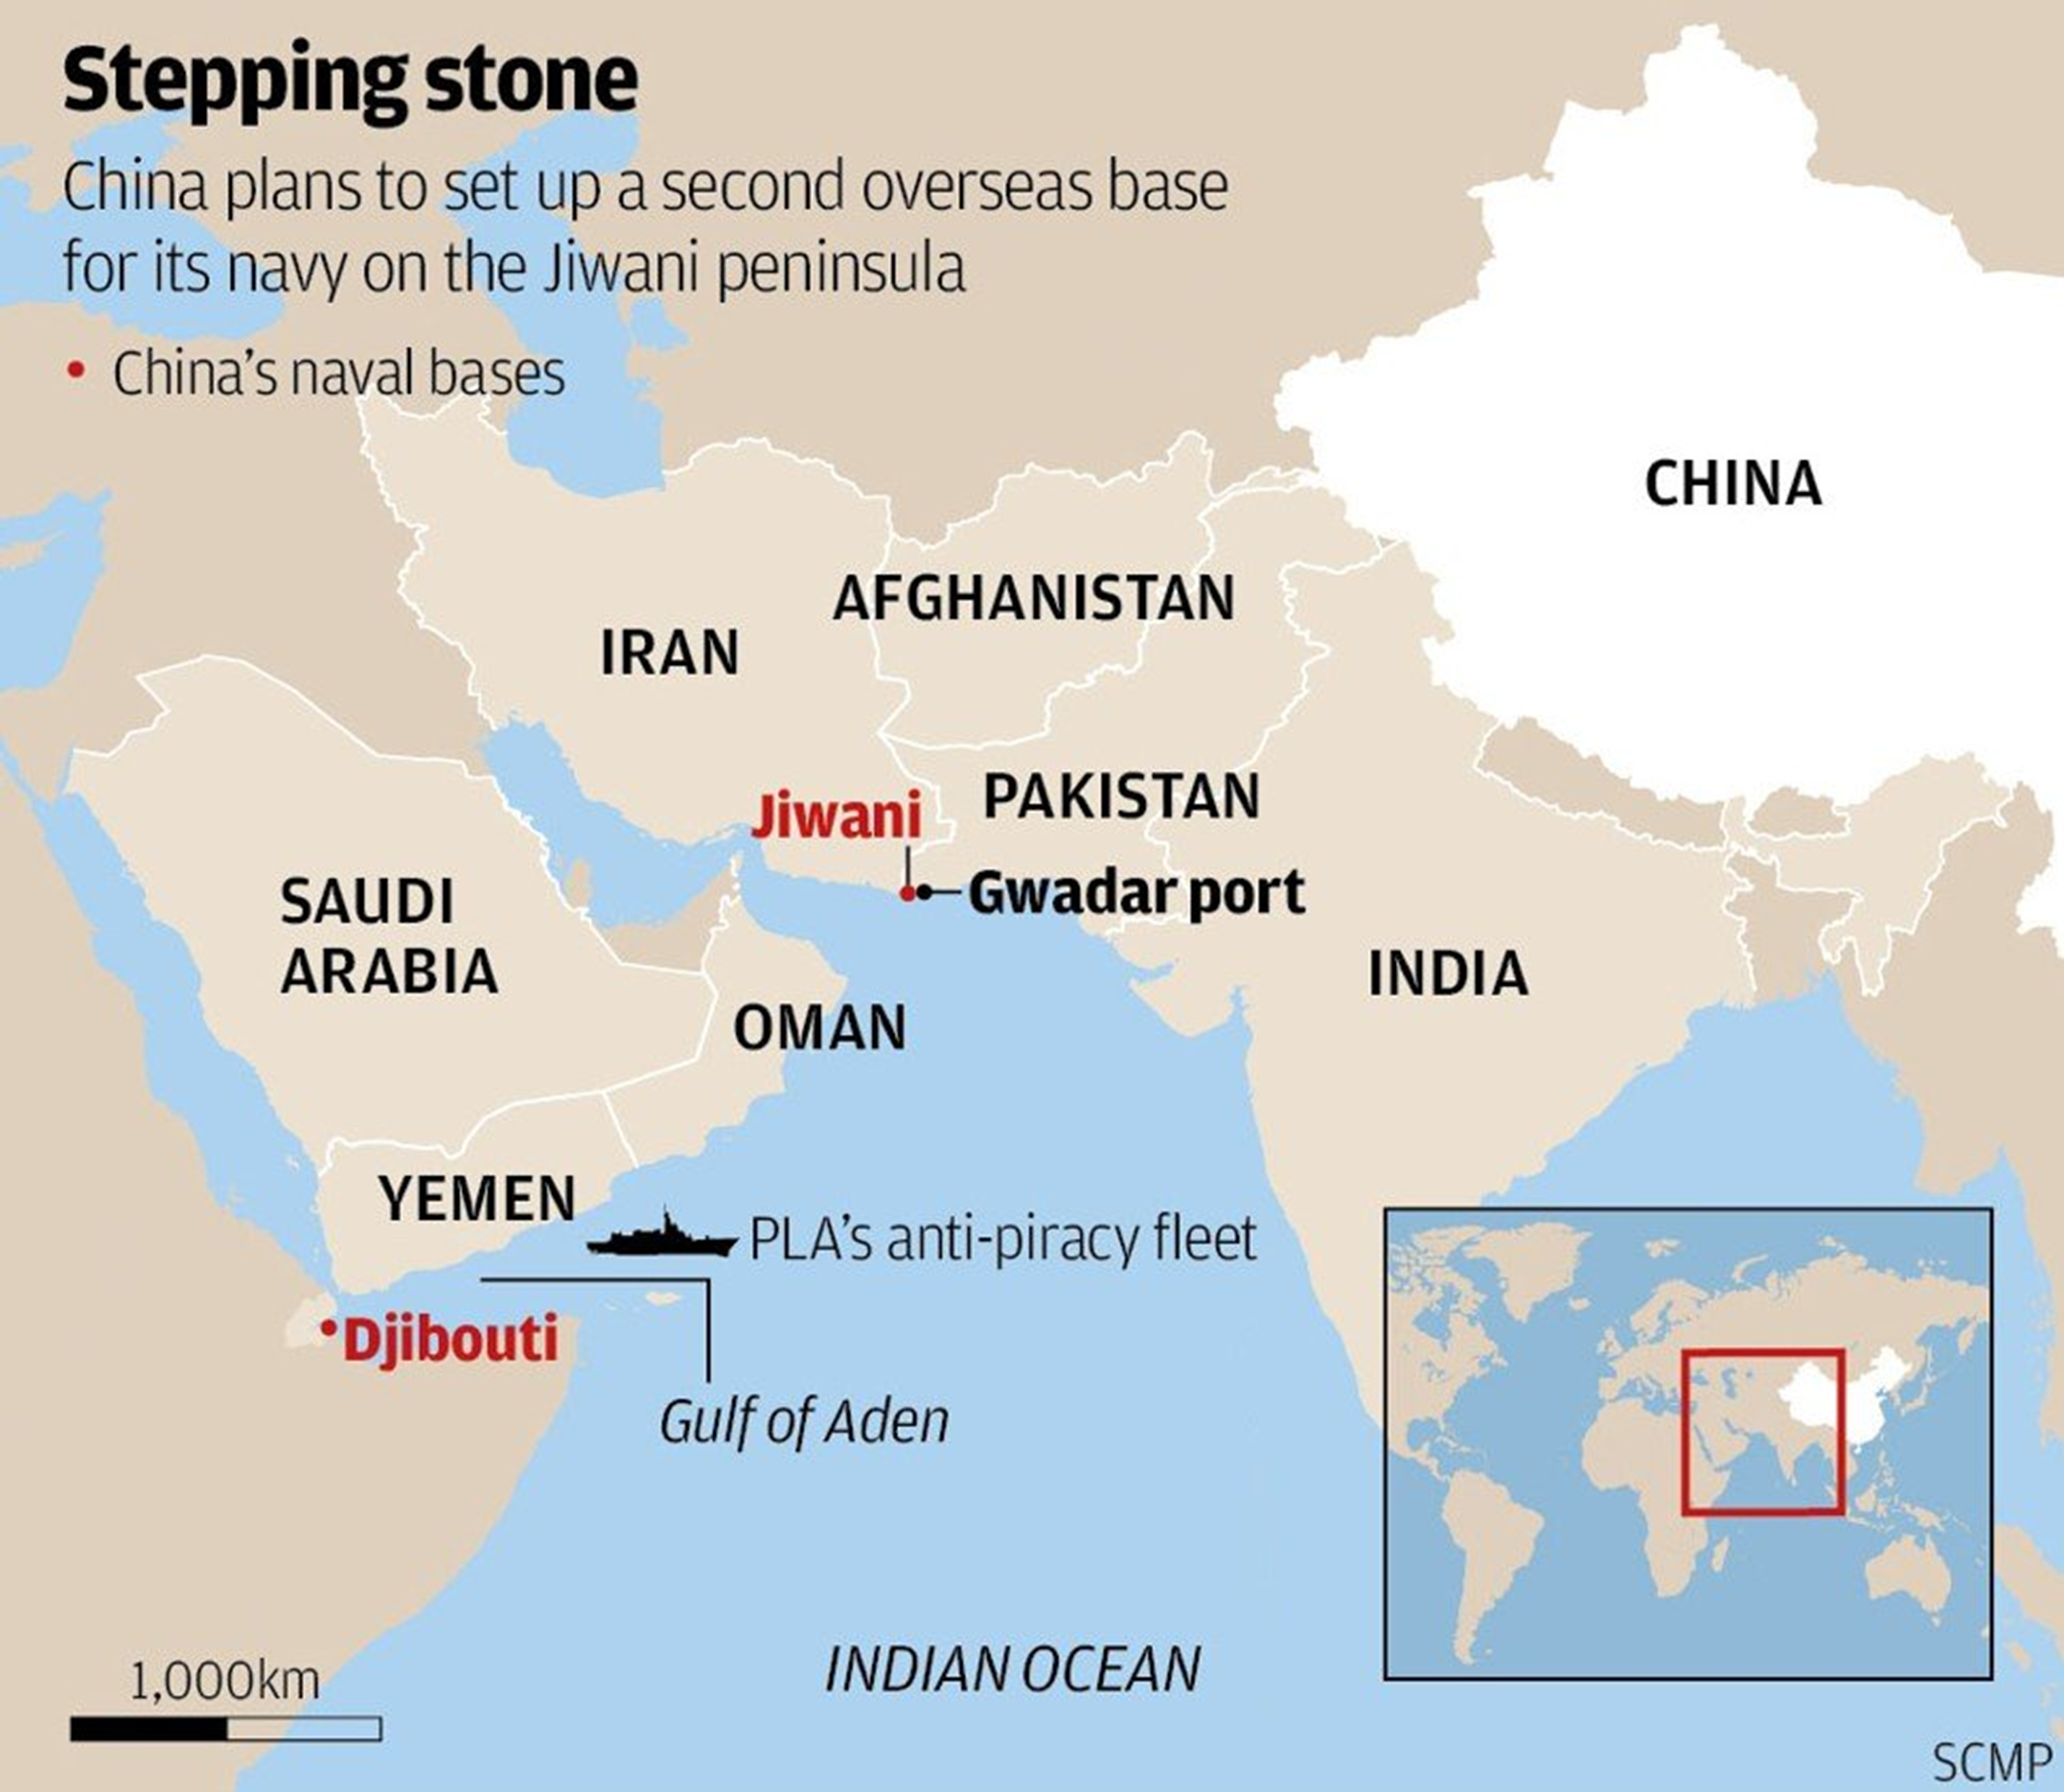
Figure 19: Chinese strategic positioning in Djibouti and Gwadar gives it an excellent position to disrupt the crude oil traffic to both USA and Europe

SOURCE: HTTPS://WWW.WORLDATLAS.COM/GULFS/GULF-OF-ADEN.HTML

Can China antagonize Saudi Arabia in its quest for harming USA and its allies? Disruption in trade flow is likely but not complete antagonization

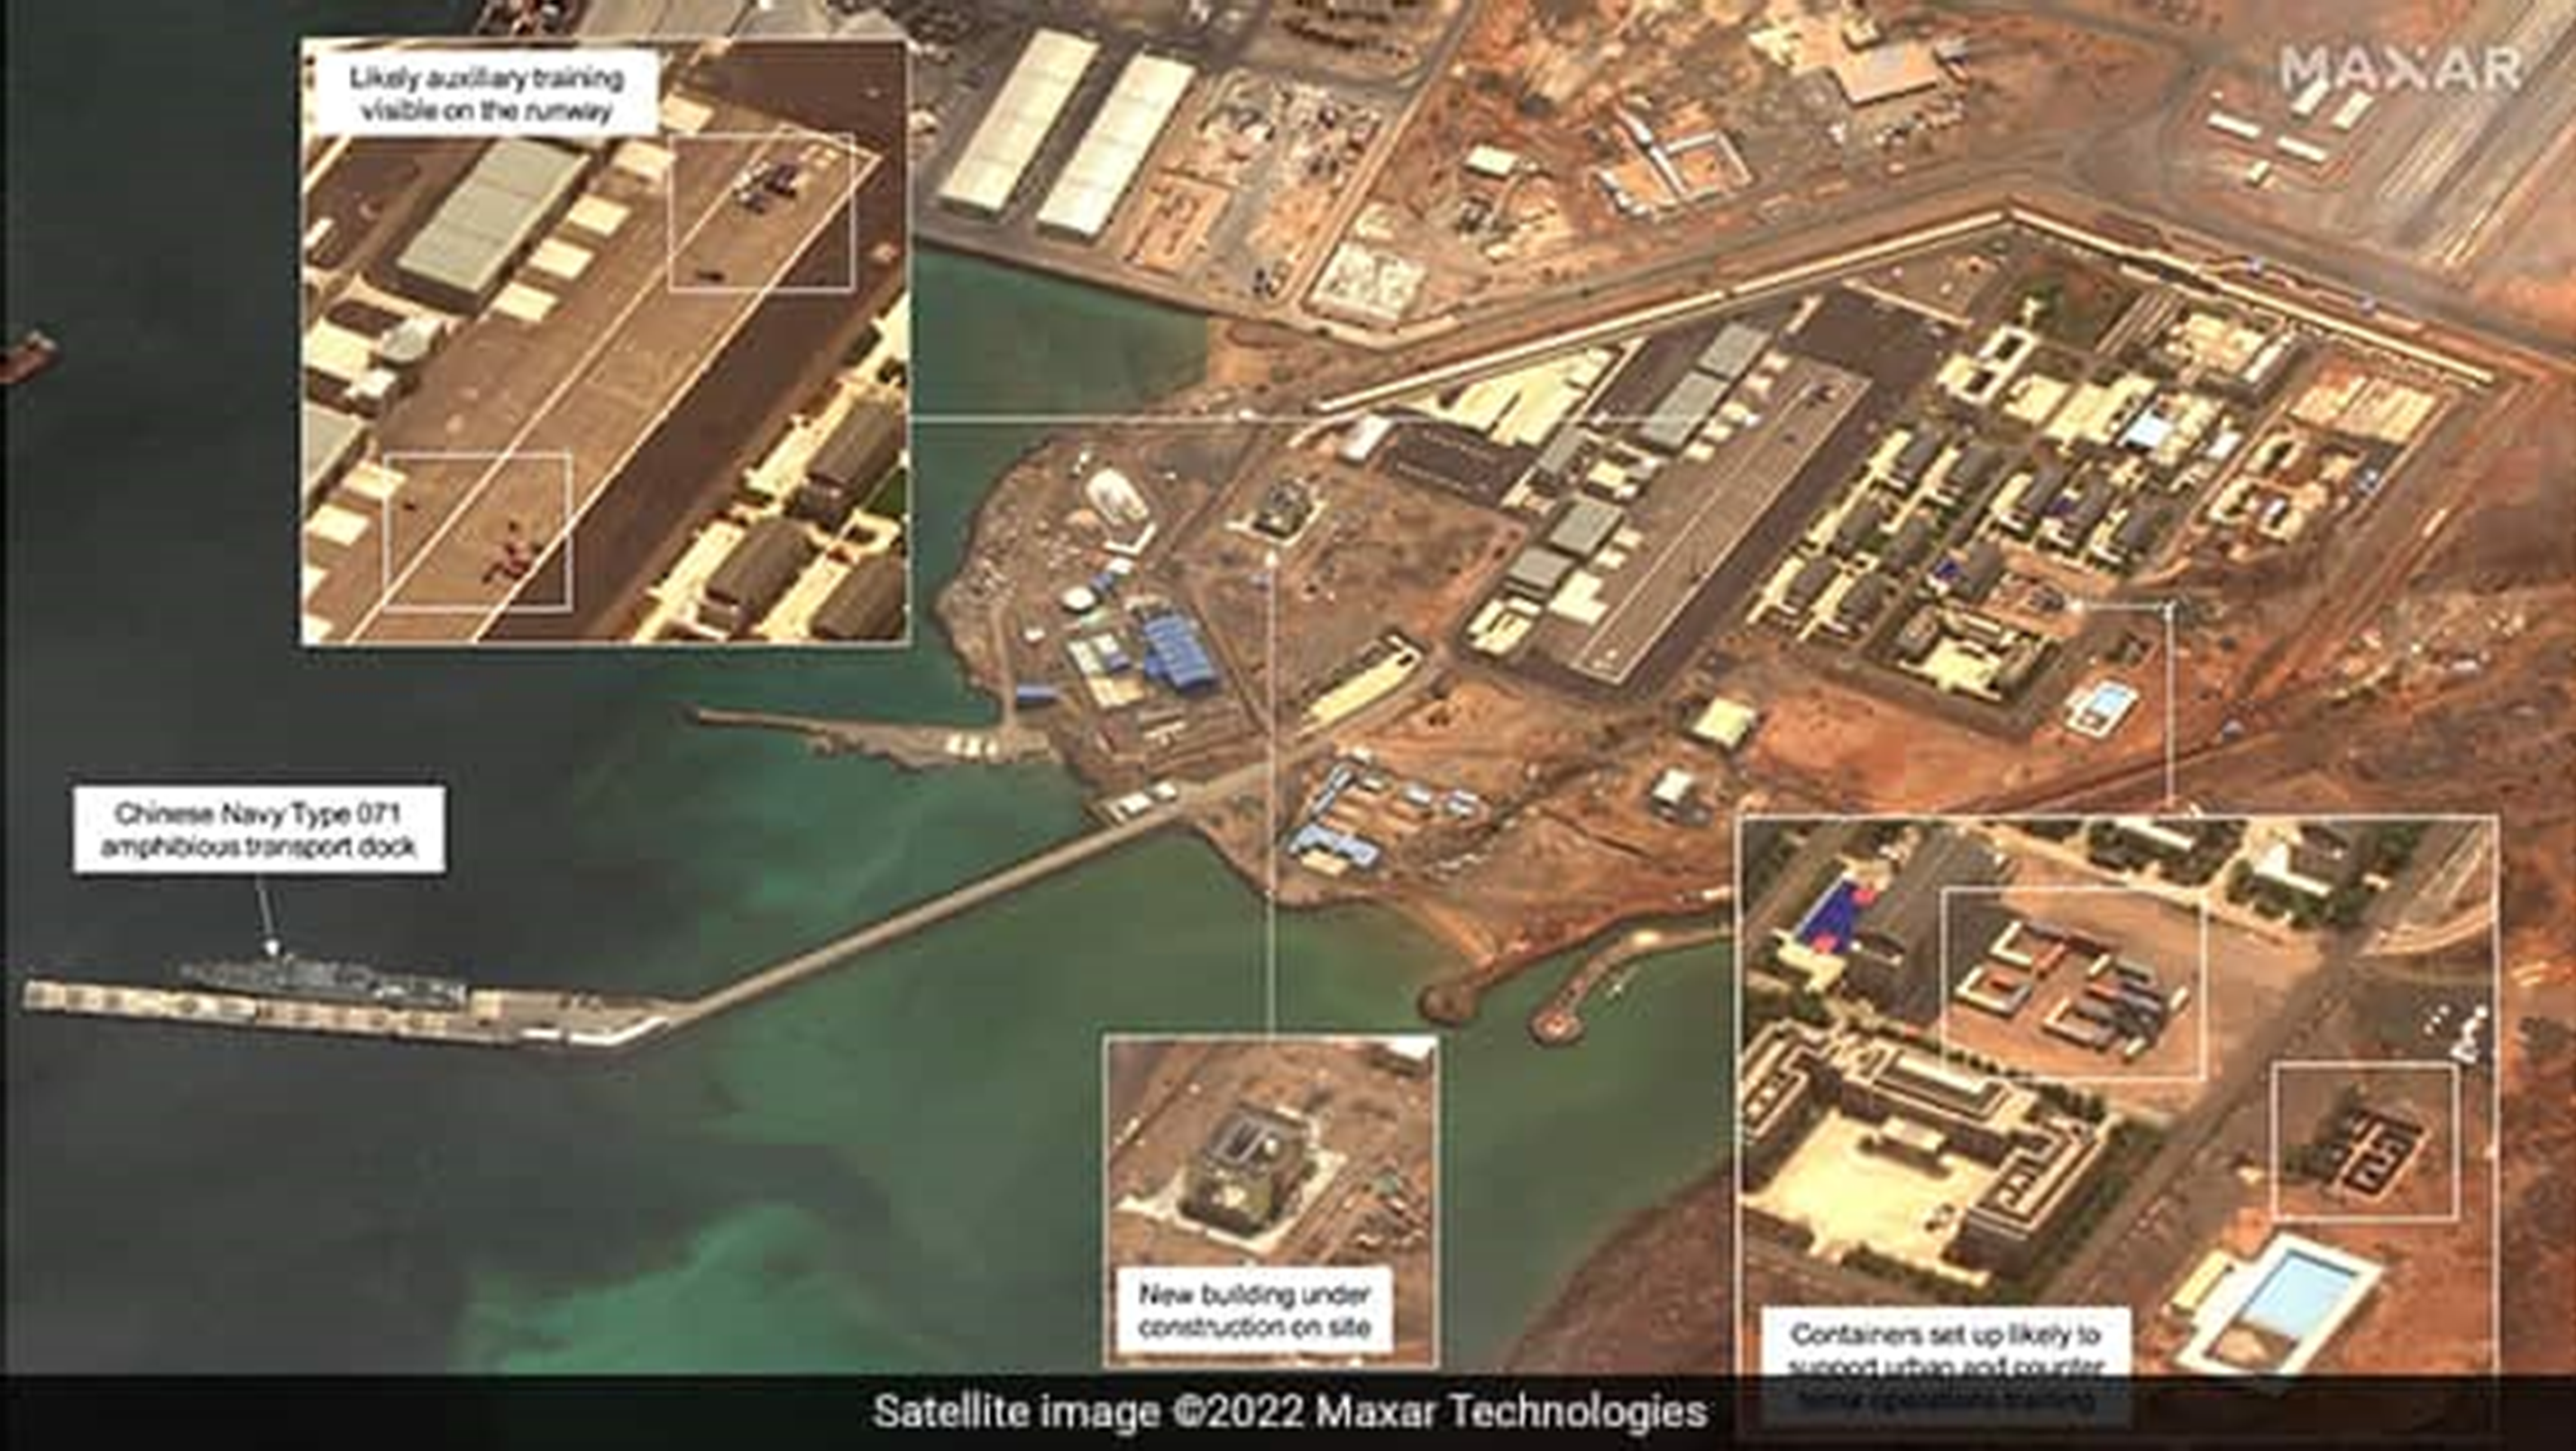
China can possibly disrupt the traffic which will lead to a big scare in Europe. To create that panic/civil unrest in Europe, China need not attach OPEC tankers but only engage in a pseudo war, like it does in South China Sea. The naval bases in Djibouti and Gwadar are sufficiently developed now  and can handle even carrier battle groups (link for news on Djibouti: https://www.ndtv.com/world-news/chinas-indian-ocean-base-in-djibouti-fully-operational-warship-docked-in-satellite-pics-3264696)

Figure 20: Chinese naval base in Djibouti is highly developed, and in the words of some naval experts “has been fortified to withstand multiple direct assault”

SOURCE: HTTPS://WWW.NDTV.COM/WORLD-NEWS/CHINAS-INDIAN-OCEAN-BASE-IN-DJIBOUTI-FULLY-OPERATIONAL-WARSHIP-DOCKED-IN-SATELLITE-PICS-3264696


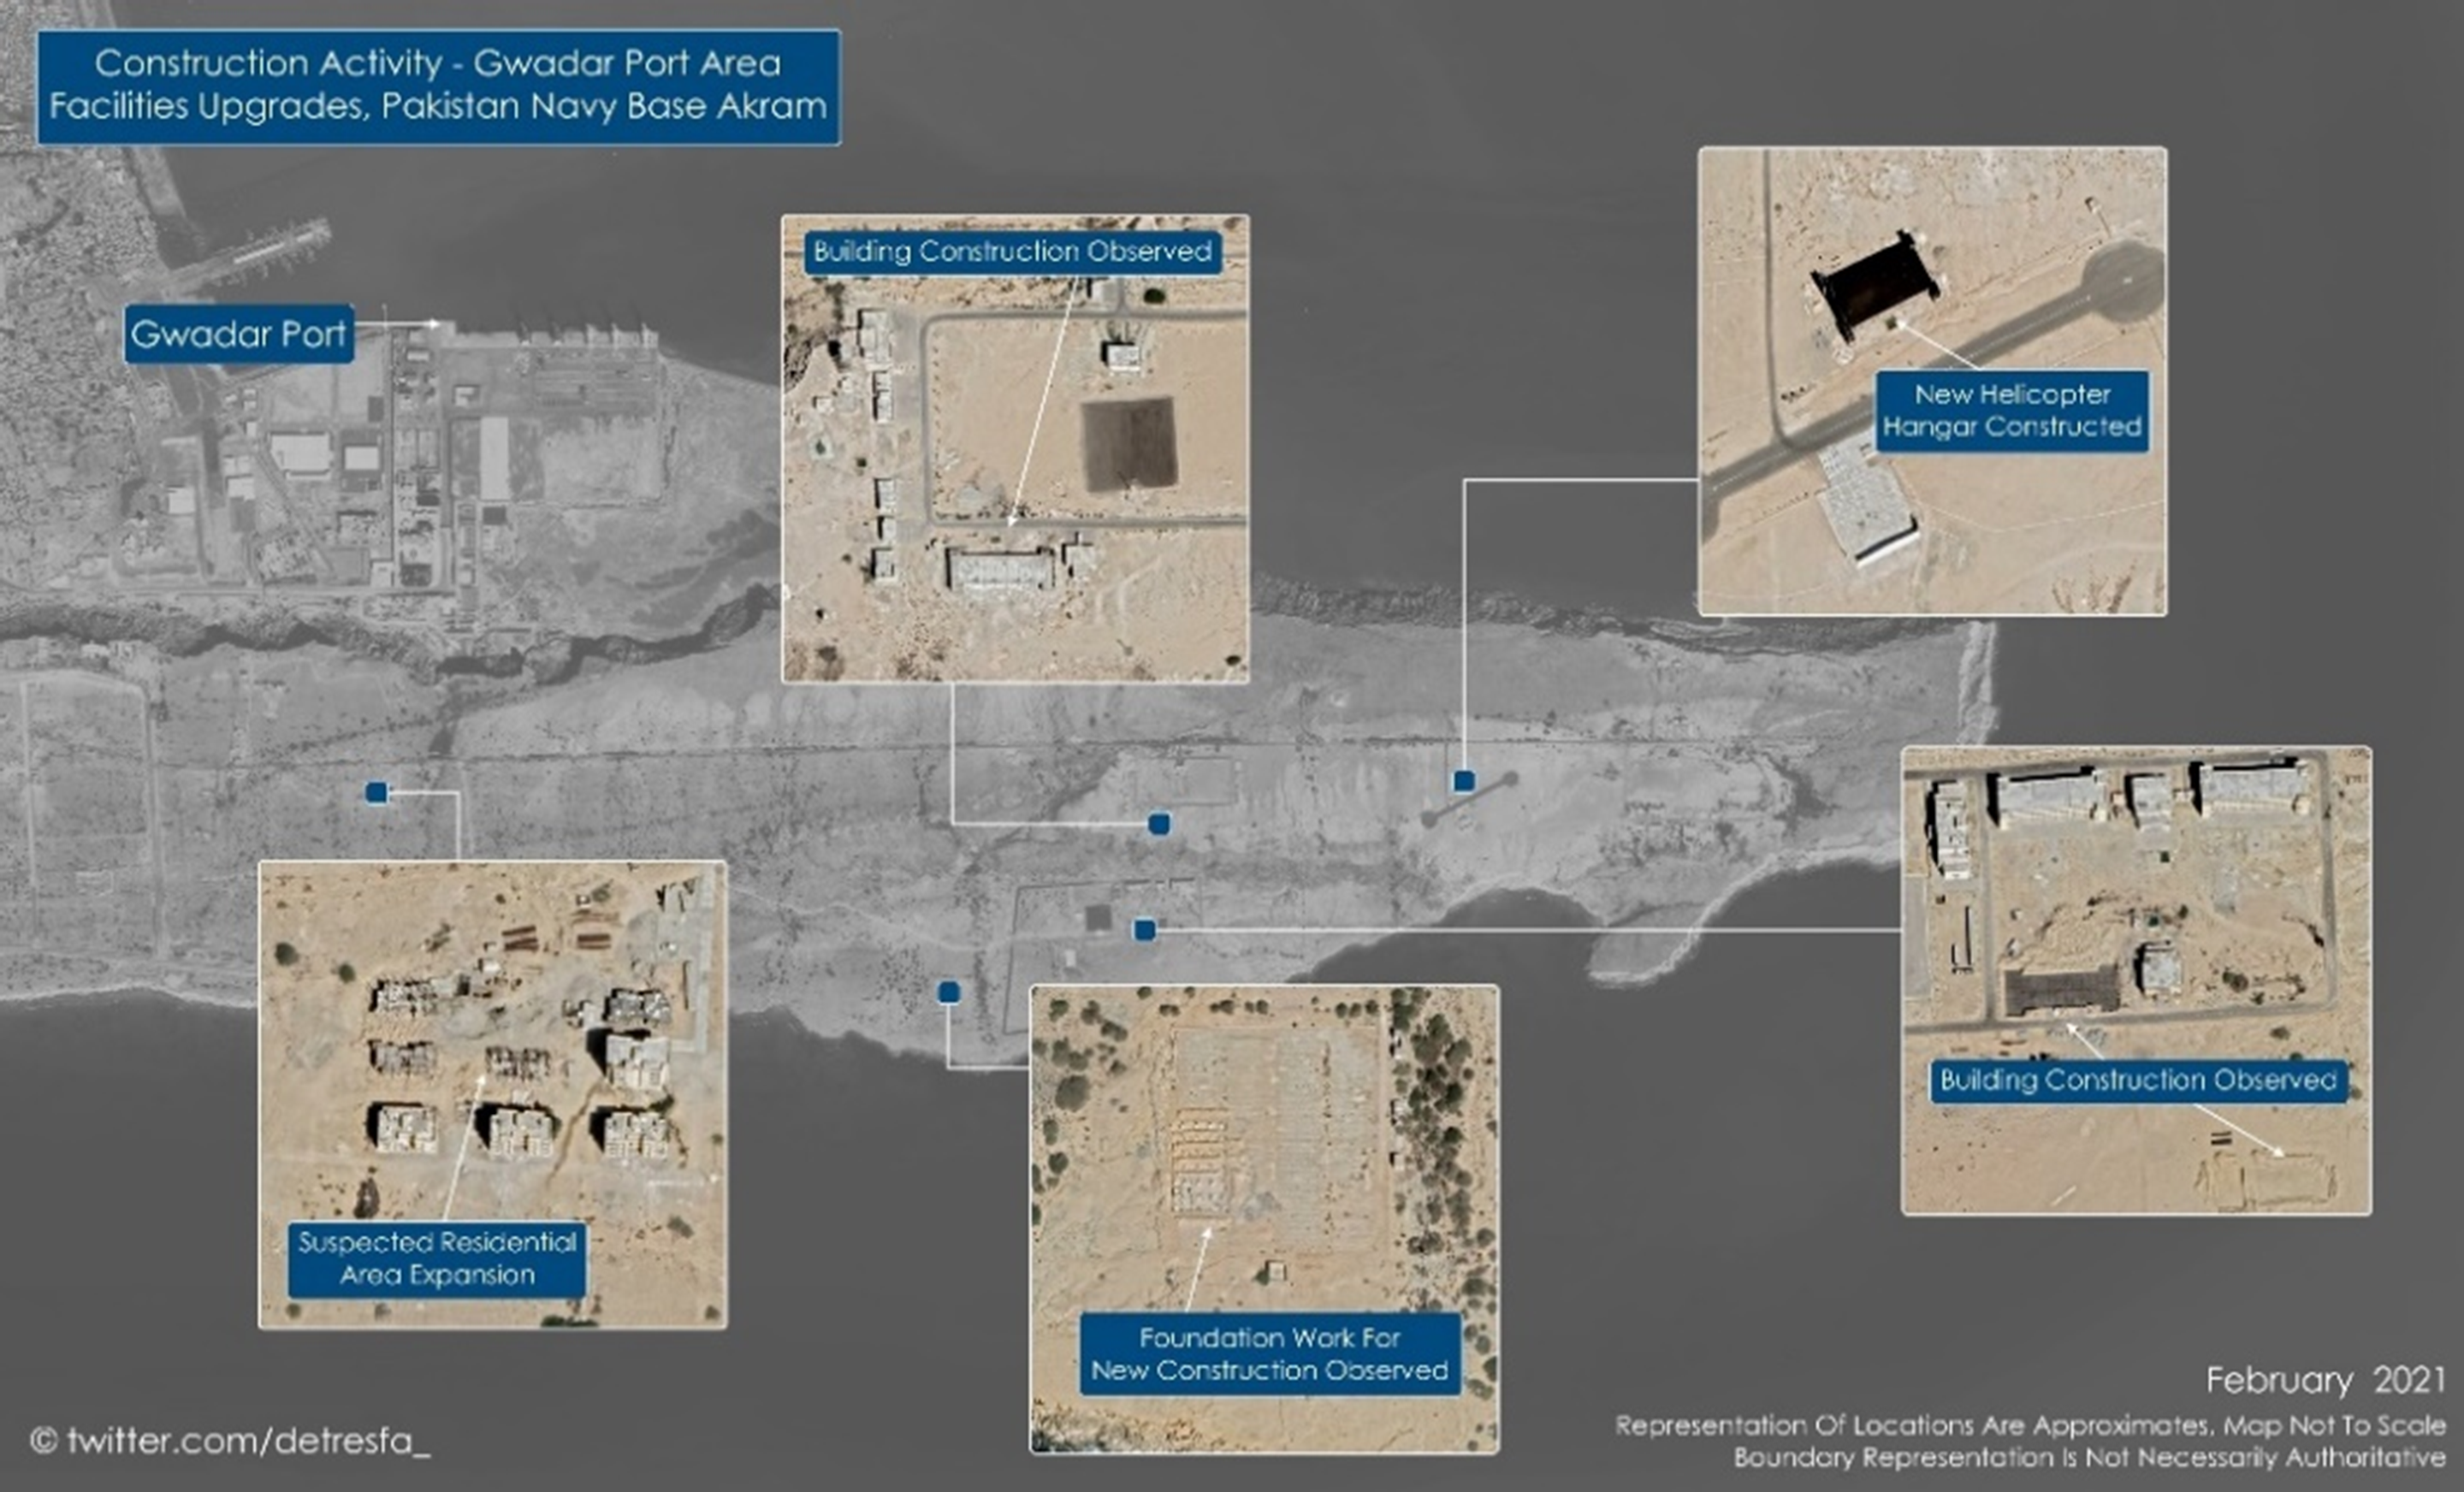
Figure 21: Pakistan navy is building/has built considerable naval capacity at Gwadar; please note China (“an all-weather friend” pf Pakistan) can always use it against the perceived common enemy

SOURCE: HTTPS://TWITTER.COM/DETRESFA_/STATUS/1372480420021821441/PHOTO/1

China may be preparing for such eventuality

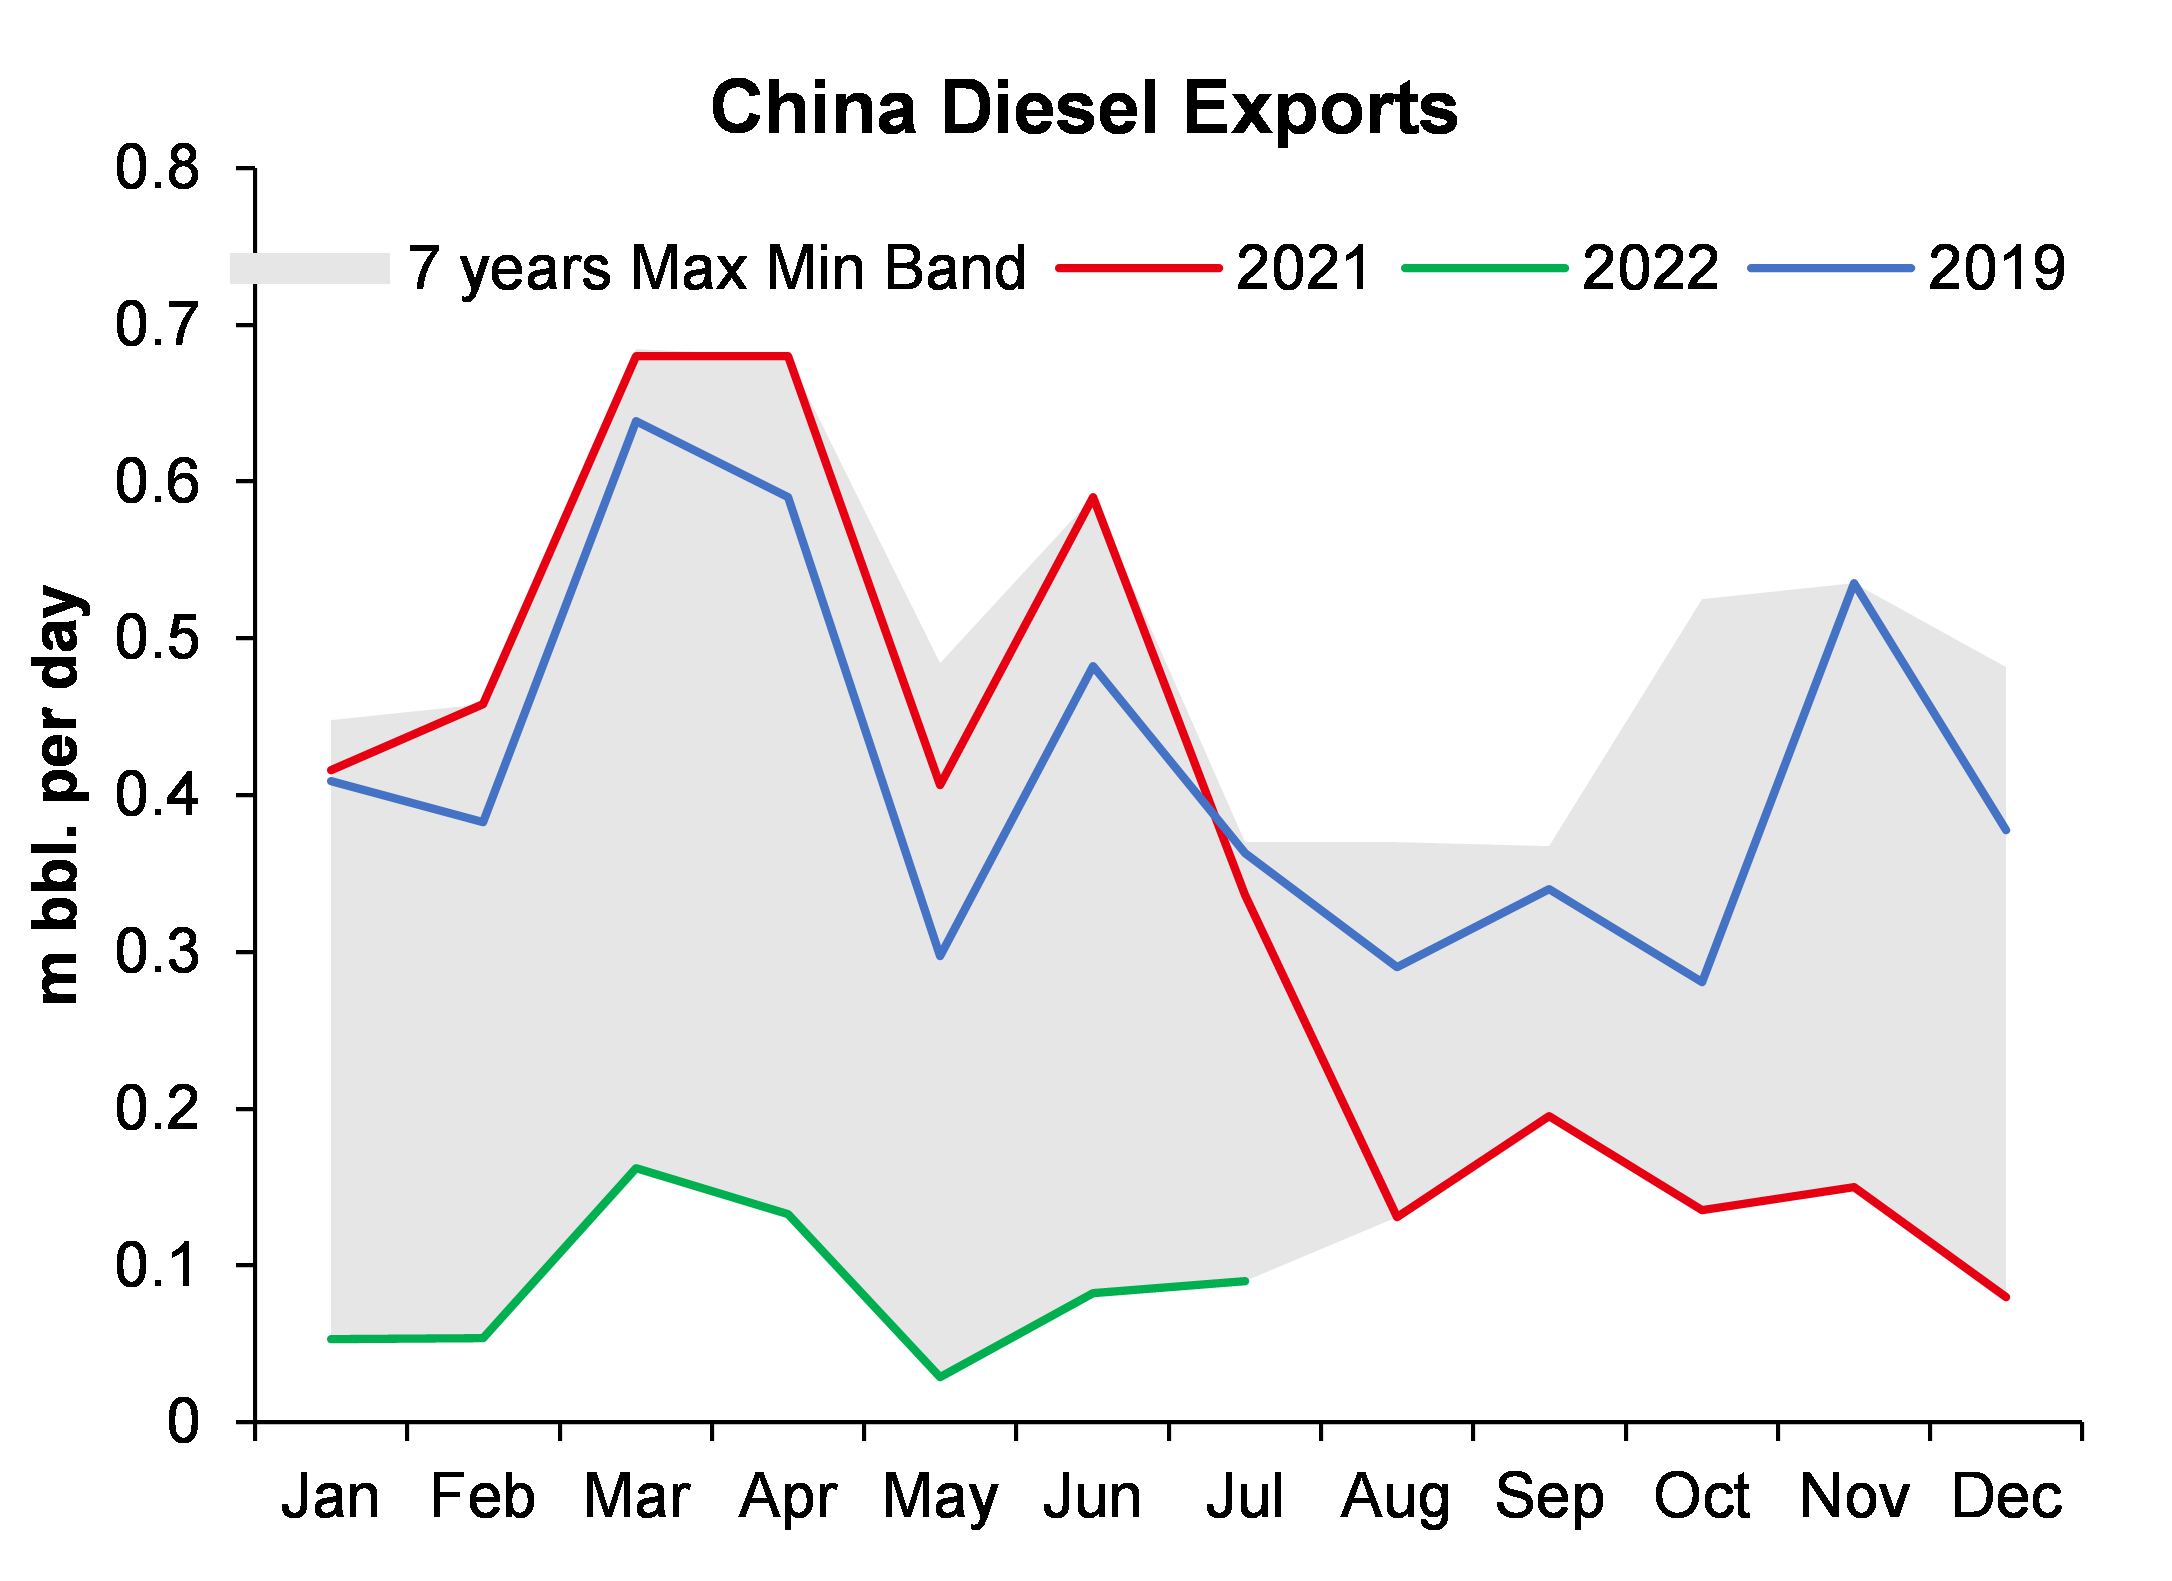
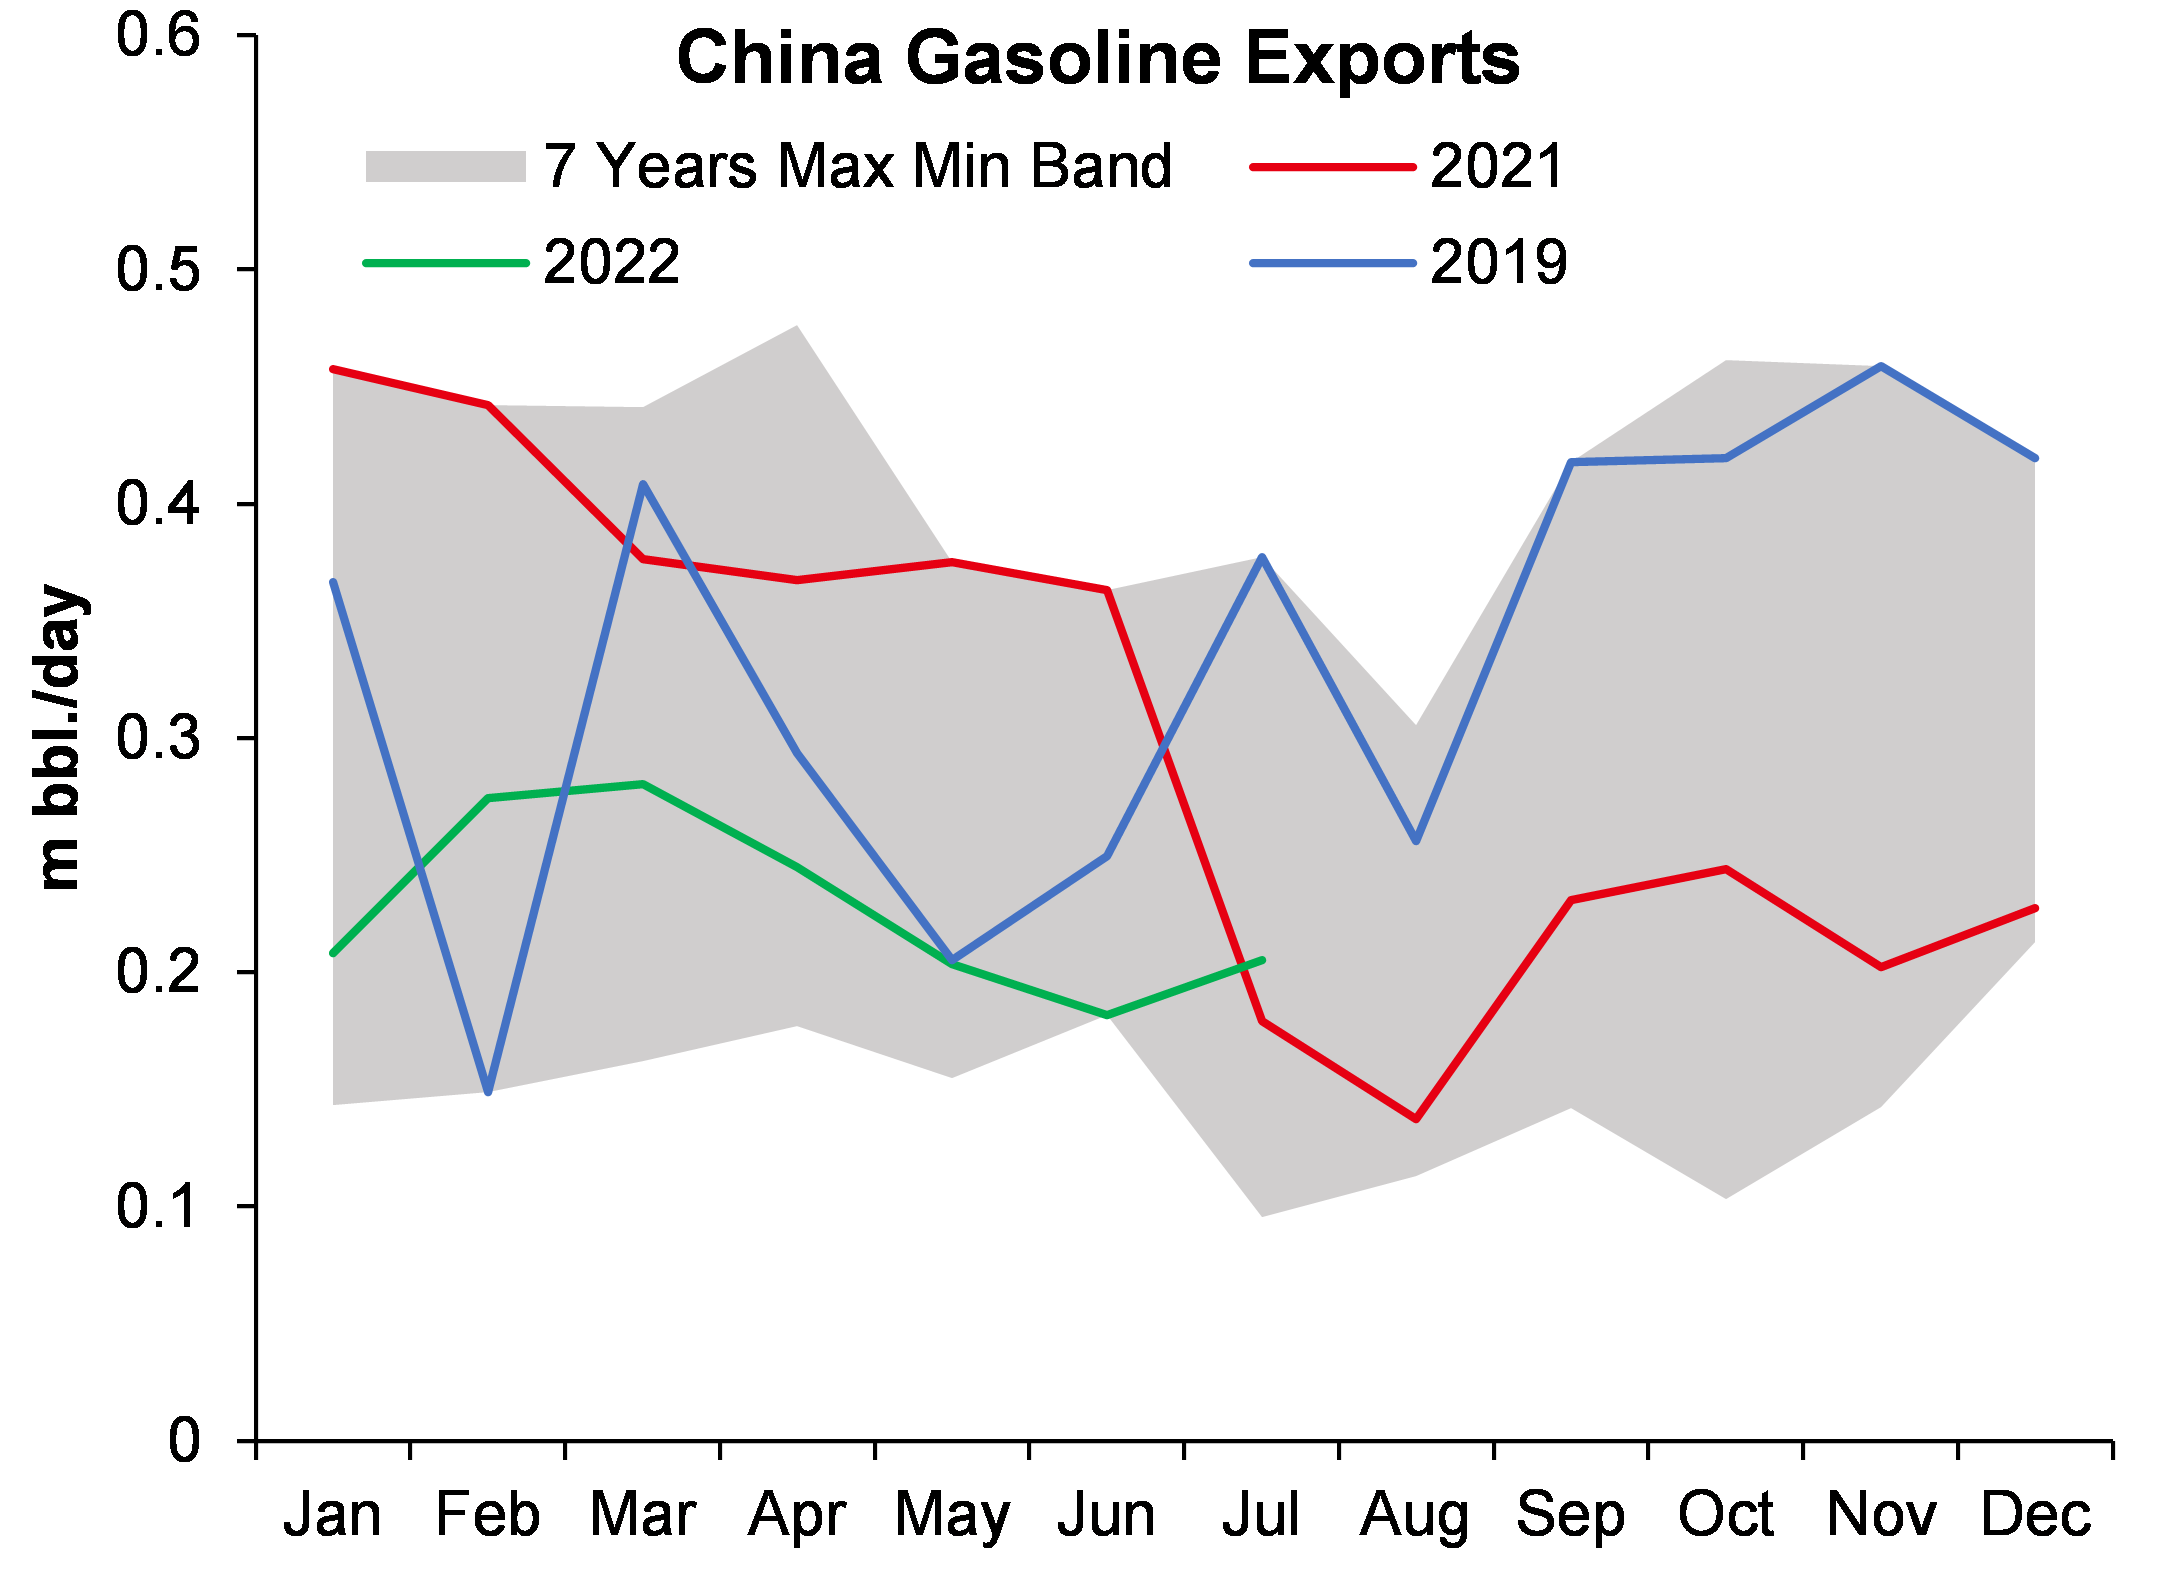
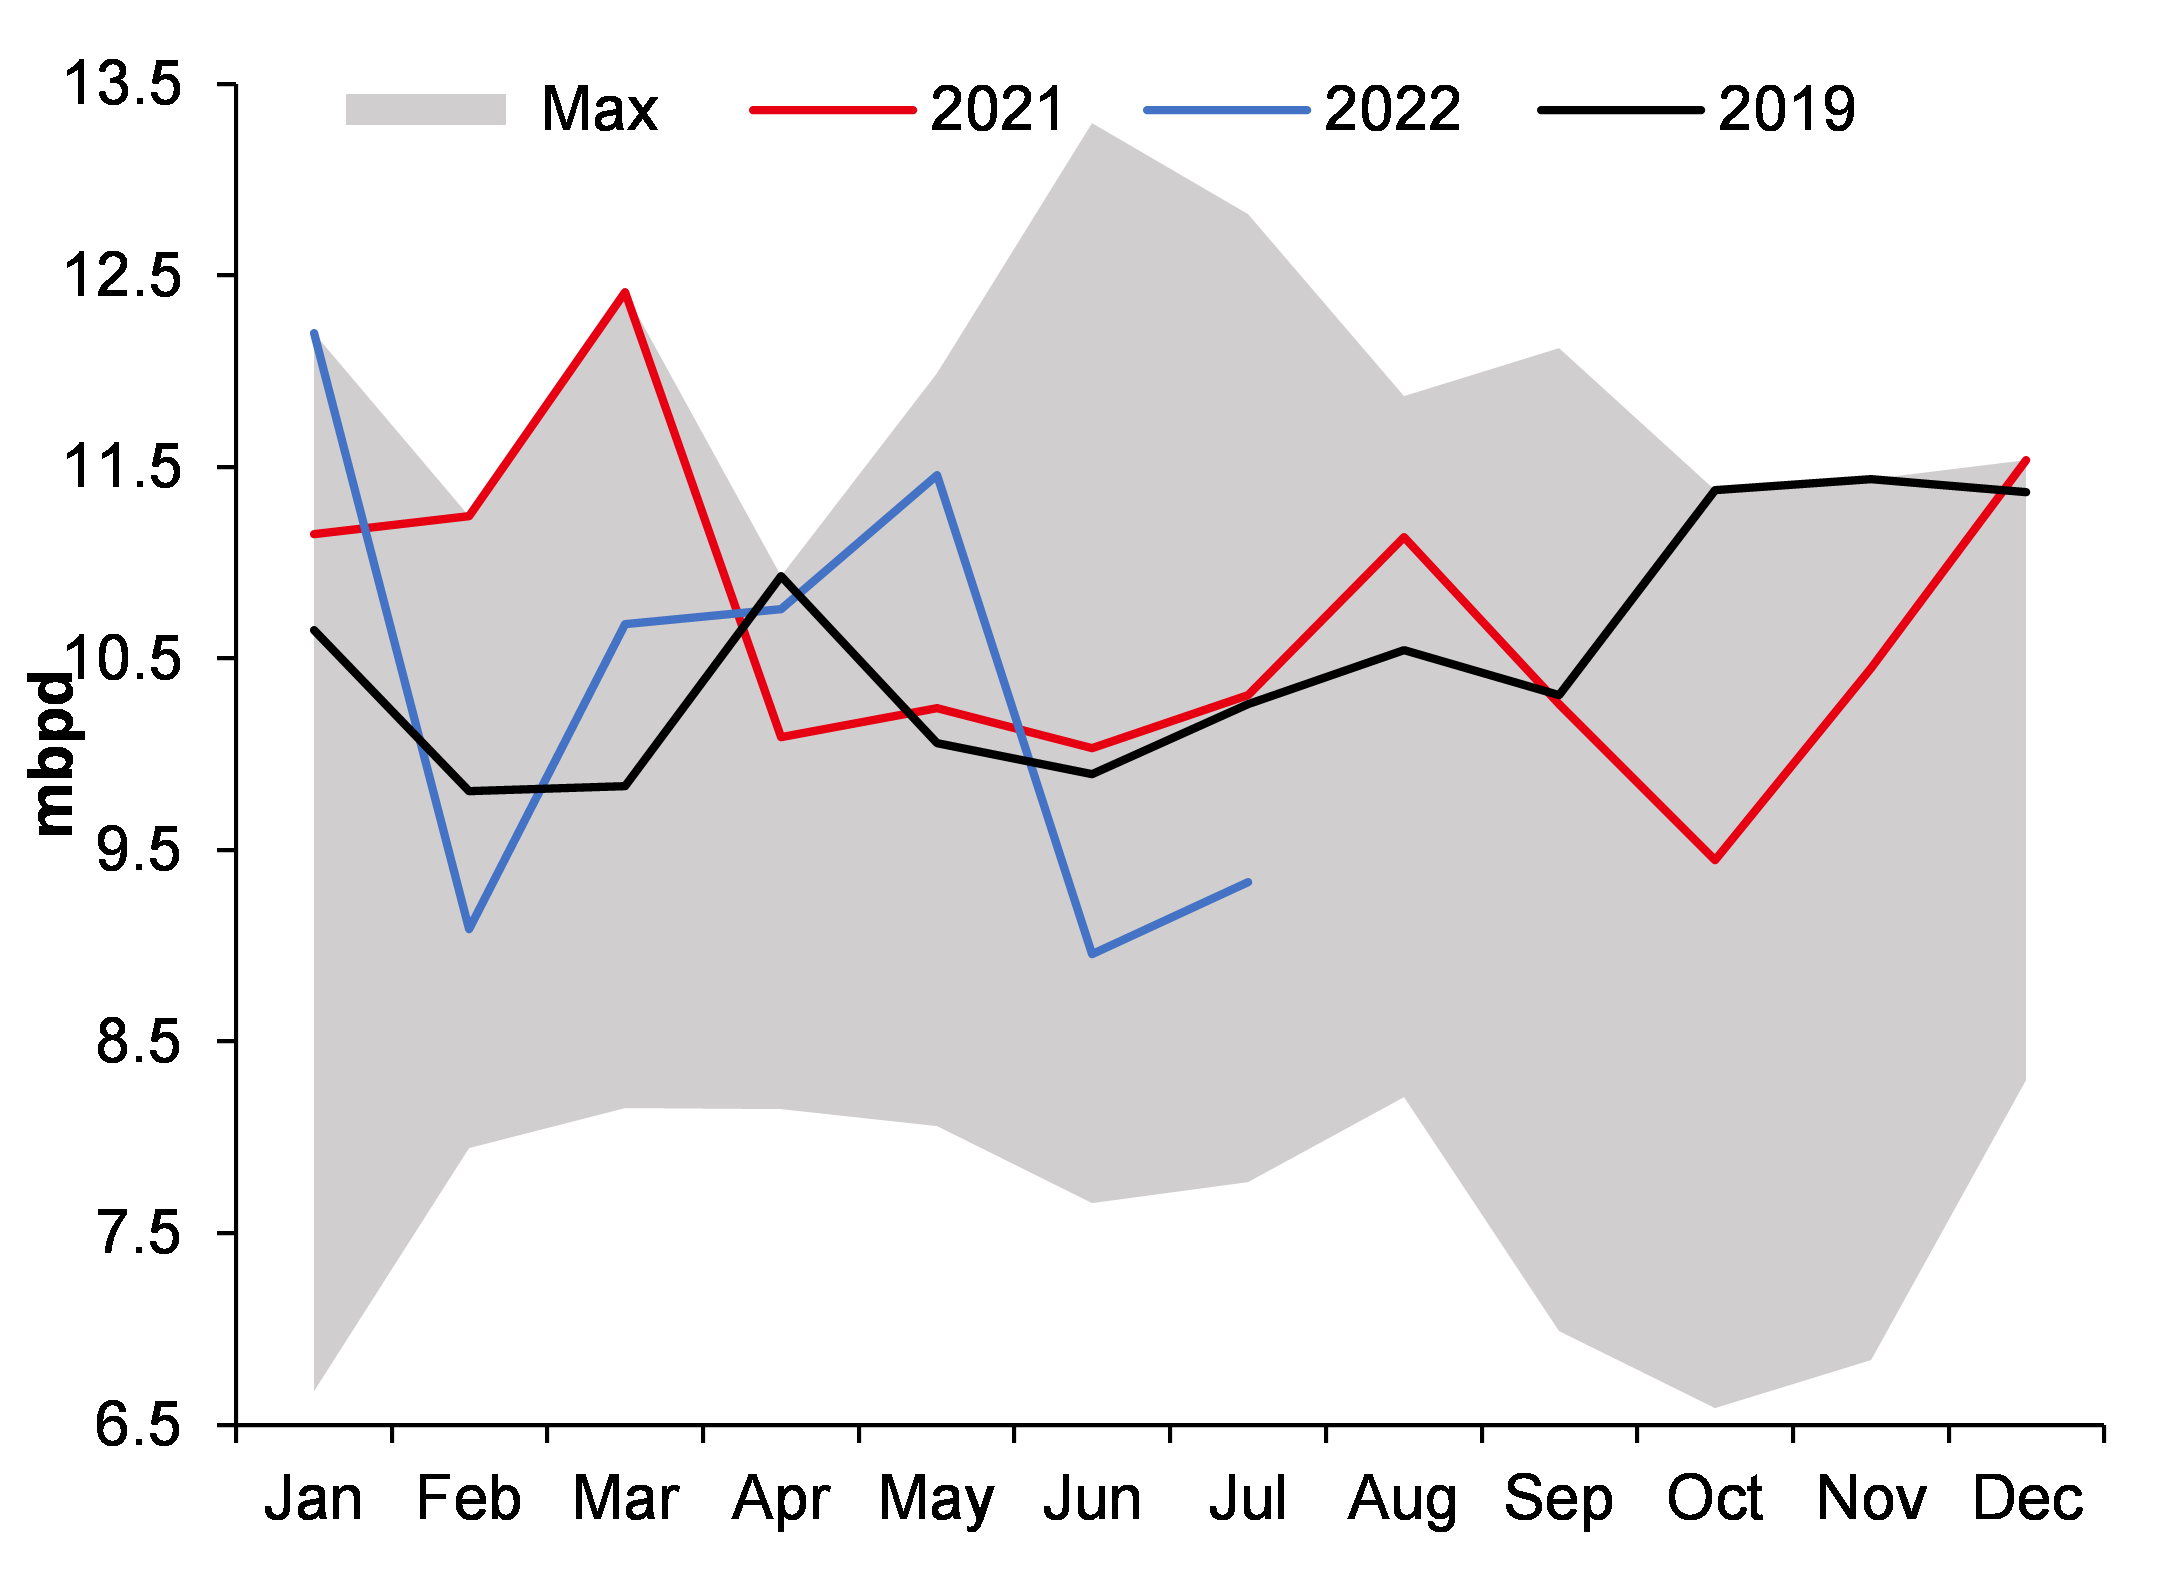
It appears China is building inventory of diesel and gasoline because its imports of crude oil have not come down, although exports of diesel and gasoline have declined.

Figure 22: China’s diesel exports have touched a seven-year low consistently over last 12 months

SOURCE: INCRED RESEARCH, COMPANY REPORTS

Figure 23: Although gasoline is not at a seven-year bottom, it is also near multi-year low

SOURCE: INCRED RESEARCH, COMPANY REPORTS


Figure 24: Chinese crude oil imports haven’t come down significantly

SOURCE: INCRED RESEARCH, COMPANY REPORTS

Figure 25: Its crude oil production is at multi-year high

SOURCE: INCRED RESEARCH, COMPANY REPORTS

In this regard, we don’t know for how long USA can keep releasing SPR. Probably, not for long

We don’t think, given the inherent dangers, USA can keep releasing SPR inventory for long. USA’s foreign policy and strategic interests are linked with Europe, but USA has done many irrational and illogical things in the past. Their definition of security can be entirely different than our Oriental mindset and hence, they may keep releasing SPR. However, even in a most risky case, USA may not prefer to go below a week of SPR.

What is the oil sweet spot for OPEC? It’s higher than US$80-85/bbl

While OPEC countries are diversifying their revenue, crude oil remains the major revenue contributor for them. The fiscal and current account neutral crude oil price for OPEC countries ranges between US$60-88/bbl.  However, this price doesn’t leave any scope big scope for investment in oil assets. Please remember that most oil companies in OPEC countries are national assets and hence, they will toe the line of the rulers of those countries.


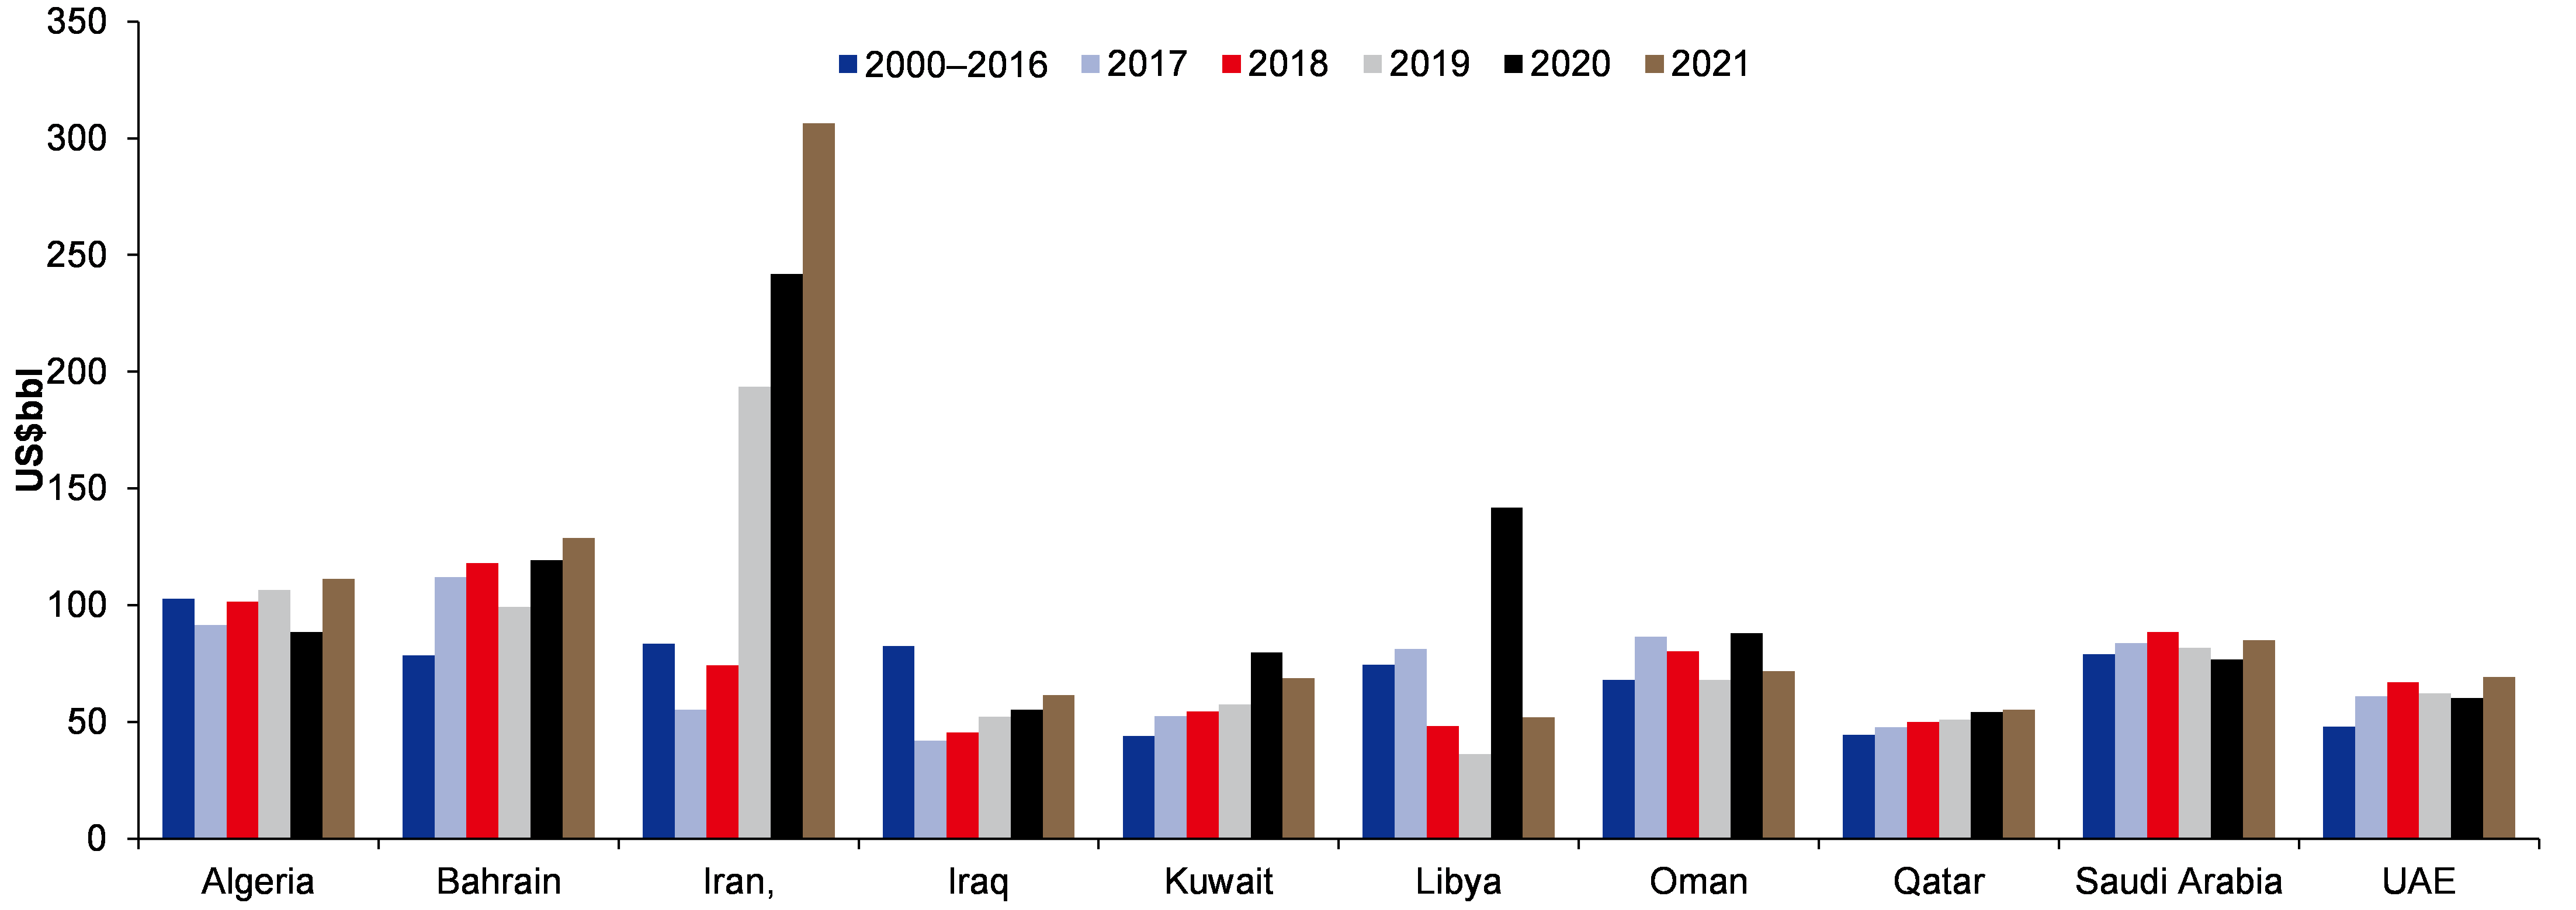
Fiscal breakeven crude oil price for OPEC countries remains around US$85/bbl

Figure 26: Major OPEC countries have fiscal breakeven crude oil price of US$80-85/bbl

SOURCE: INCRED RESEARCH, IMF

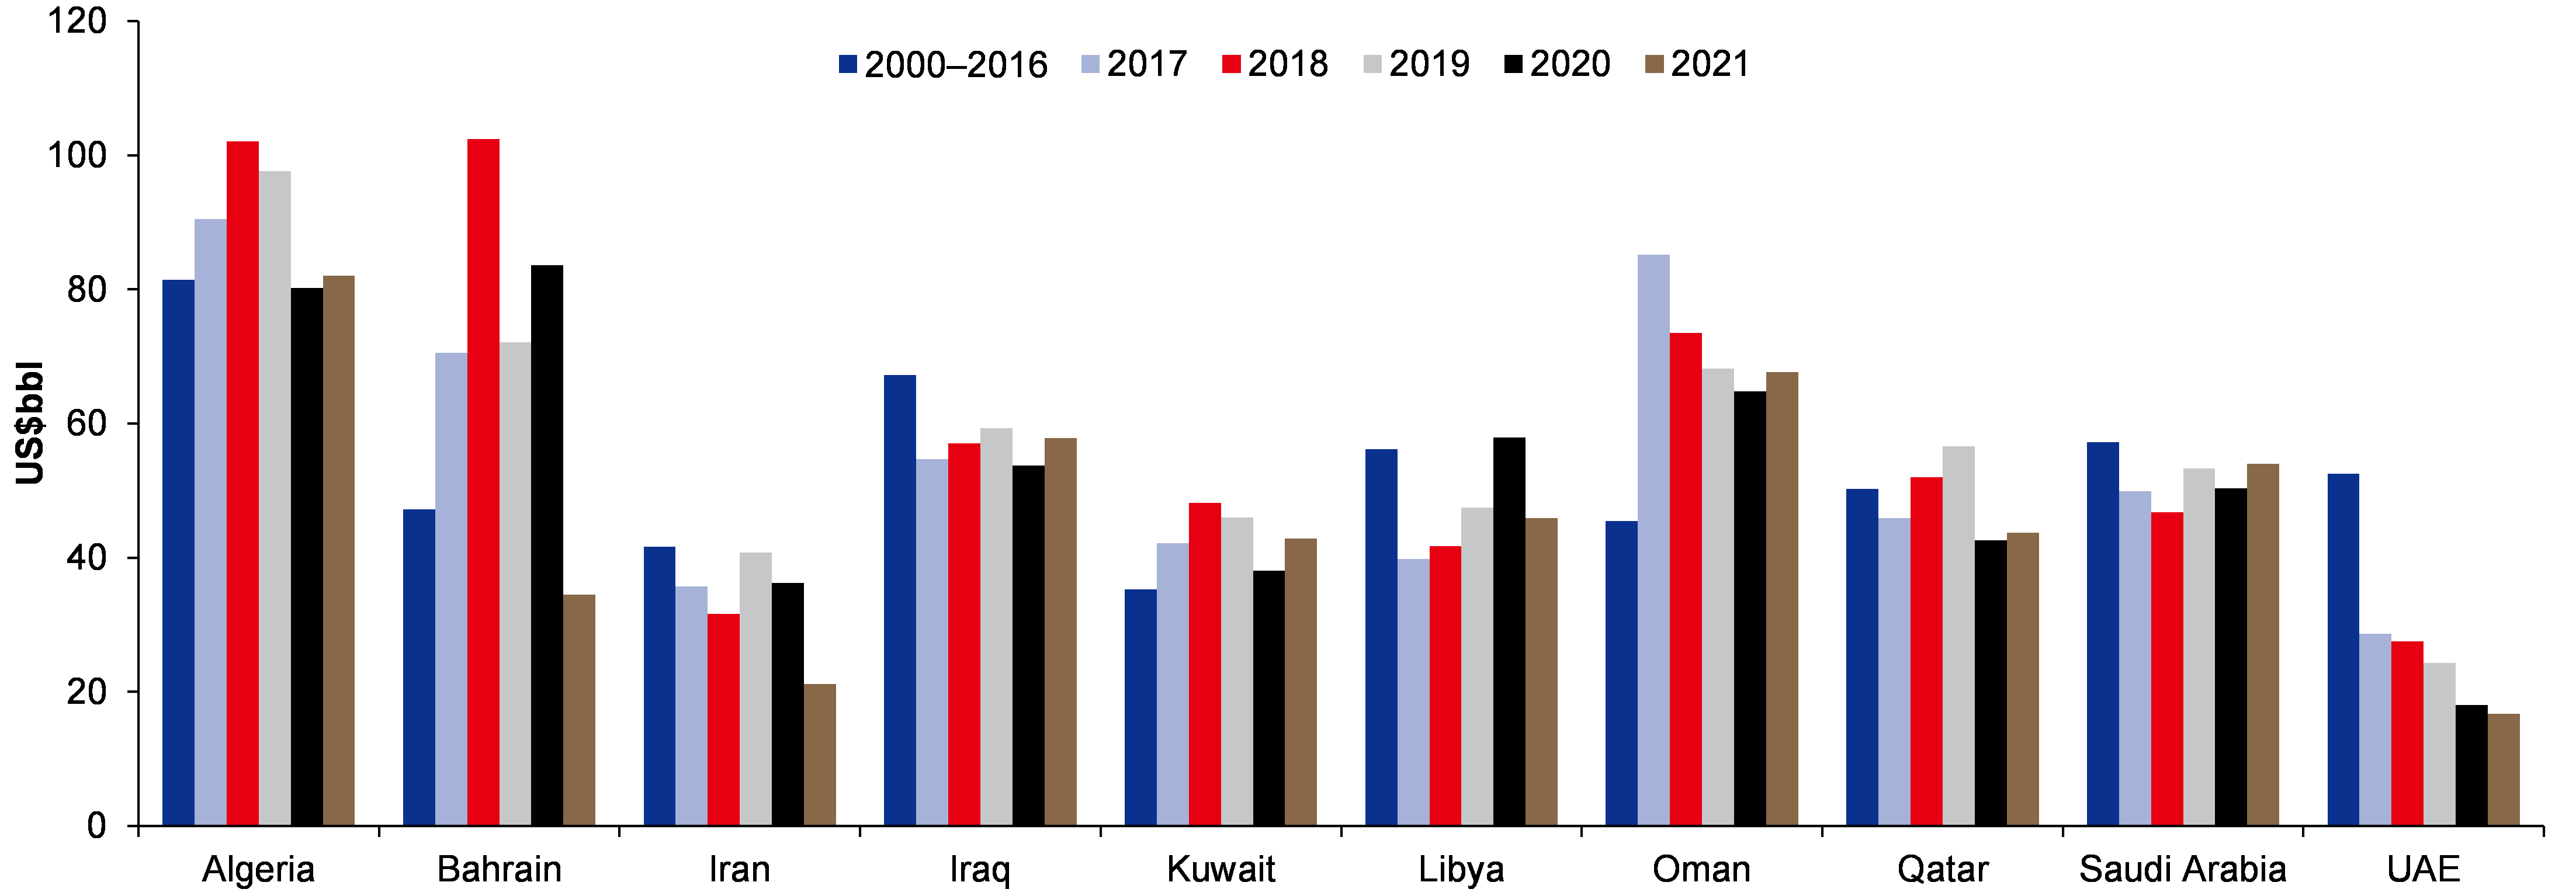
Current account breakeven crude oil price for OPEC countries remains around US$60-65/bbl

Figure 27: Current account breakeven crude oil price is around US$60-65 for major OPEC countries

SOURCE: INCRED RESEARCH, IMF

The reader might wonder that with the currency pegged to US$, why leaders will bother about external breakeven prices? Our answer is that they will worry as otherwise there will be rampaging inflation and the risk of another Arab Spring.

Will OPEC countries invest in oil capacity if crude oil price falls to US$80/bbl? No, they won’t and oil bear market will remain very shortlived

Most OPEC nations are investing heavily in alternate sources of revenue to remove their reliance on crude oil. Saudi Arabia and the UAE are taking the lead in that direction and, in fact, there have been some remarkable changes in Saudi Arabia’s policies in the recent past (women rights, foreigners working in Saudi Arabia, etc.).


​India

ADD (no change)

Consensus ratings*:

Buy 19

Hold 7

Sell 3


Current price:

Rs134

Target price:

p

Rs221

Previous target:

Rs200

Up/downside:

64.9%

InCred Research / Consensus:

30.6%


Reuters:


Bloomberg:

ONGC IN

Market cap:

US$23,172m


Rs1,682,612m

Average daily turnover:

US$65.7m


Rs4768.5m

Current shares o/s:

12,580.1m

Free float:

39.6%

*Source: Bloomberg


Source: Bloomberg

Price performance

1M

3M

12M

Absolute (%)

1.0

(13.8)

19.7

Relative (%)

(4.1)

(21.0)

13.5

Major shareholders

% held

Government of India

60.4

LIC

10.4

Indian Oil Corporation

7.8


Analyst(s)

Satish KUMAR

T (91) 22 4161 1562

E satish.kumar@incredcapital.com

Abbas PUNJANI

T (91) 22 4161 1562

E abbas.punjani@incredcapital.com


Analyst(s)

Satish KUMAR

T (91) 22 4161 1562

E satish.kumar@incredcapital.com

Abbas PUNJANI

T (91) 22 4161 1562

E abbas.punjani@incredcapital.com


Oil & Natural Gas

Punished too much for GoI’s policy flip-flop

ONGC is one of the most undervalued energy stocks in the Indian energy sector. Government policy uncertainty has led to a severe derating of the stock.

Recent government actions have meant that ONGC can make US$65-70/bbl realization, and we build in US$65/bbl in our earnings estimates.

ONGC is one of the most undervalued energy stocks in the Indian energy sector. Government policy uncertainty has led to a severe derating of the stock.

Recent government actions have meant that ONGC can make US$65-70/bbl realization, and we build in US$65/bbl in our earnings estimates.

The stock trades at 3.6x FY23F EPS with a dividend yield of 9%. With long-term crude oil prices to remain in an uptrend, ONGC is an attractive value pick.  Retain Add rating.

Brent crude oil prices unlikely to fall below US$80-85/bbl

Geopolitics, lack of investment in oil assets, dwindling strategic petroleum reserves (SPR) as well as the Organization of the Petroleum Exporting Countries or OPEC’s own financial condition indicates that Brent crude oil prices are unlikely to remain below US$80-85 for a long time. Hence, the odds are in favour of ONGC. Media frenzy and unwarranted investor activism has led to a steep decline in investment in oil assets. Companies are delivering fat dividends, but not investing enough. In fact, Saudi Arabia’s oil major Aramco in its 1HCY22 presentation said that given the current rate of investments, global crude oil production capacity can decline to ~95mbbl by 2025F. There isn’t going to be any revolution in clean energy by that time and hence, crude oil prices will rise. In between, there can be many factors like release of SPR, US President Joe Biden’s statements and what not, but the trajectory for crude oil is up from this level.

ONGC presents an attractive opportunity to play crude oil Bull cycle

While government policy will always remain an overhang and hence the full value of the stock may never be realized, recent/past events indicate that government is happy letting ONGC make around US$65-70/bbl.  ONGC is investing in oil exploration but to be on the conservative side, we have valued only the proven reserves of the state-owned company. Any fresh discoveries in oil or gas will be a further positive. We have built in 22.91mt /23.48 and 23.08mt oil and condensate production in our FY23F/24F/25F earnings estimates, respectively.

Reiterate Add rating on the stock

Oil & Natural Gas

Punished too much for GoI’s policy flip-flop

■   ONGC is one of the most undervalued energy stocks in the Indian energy sector. Government policy uncertainty has led to a severe derating of the stock.

■   Recent government actions have meant that ONGC can make US$65-70/bbl realization, and we build in US$65/bbl in our earnings estimates.

■   The stock trades at 3.6x FY23F EPS with a dividend yield of 9%. With long-term crude oil prices to remain in an uptrend, ONGC is an attractive value pick. Retain Add rating.

Brent crude oil prices unlikely to fall below US$80-85/bbl

Geopolitics, lack of investment in oil assets, dwindling strategic petroleum reserves (SPR) as well as the Organization of the Petroleum Exporting Countries or OPEC’s own financial condition indicates that Brent crude oil prices are unlikely to remain below US$80-85 for a long time. Hence, the odds are in favour of ONGC. Media frenzy and unwarranted investor activism has led to a steep decline in investment in oil assets. Companies are delivering fat dividends, but not investing enough. In fact, Saudi Arabia’s oil major Aramco in its 1HCY22 presentation said that given the current rate of investments, global crude oil production capacity can decline to ~95mbbl by 2025F. There isn’t going to be any revolution in clean energy by that time and hence, crude oil prices will rise. In between, there can be many factors like release of SPR, US President Joe Biden’s statements and what not, but the trajectory for crude oil is up from this level.

ONGC presents an attractive opportunity to play crude oil Bull cycle

While government policy will always remain an overhang and hence the full value of the stock may never be realized, recent/past events indicate that government is happy letting ONGC make around US$65-70/bbl.  ONGC is investing in oil exploration but to be on the conservative side, we have valued only the proven reserves of the state-owned company. Any fresh discoveries in oil or gas will be a further positive. We have built in 22.91mt /23.48 and 23.08mt oil and condensate production in our FY23F/24F/25F earnings estimates, respectively.

Reiterate Add rating on the stock

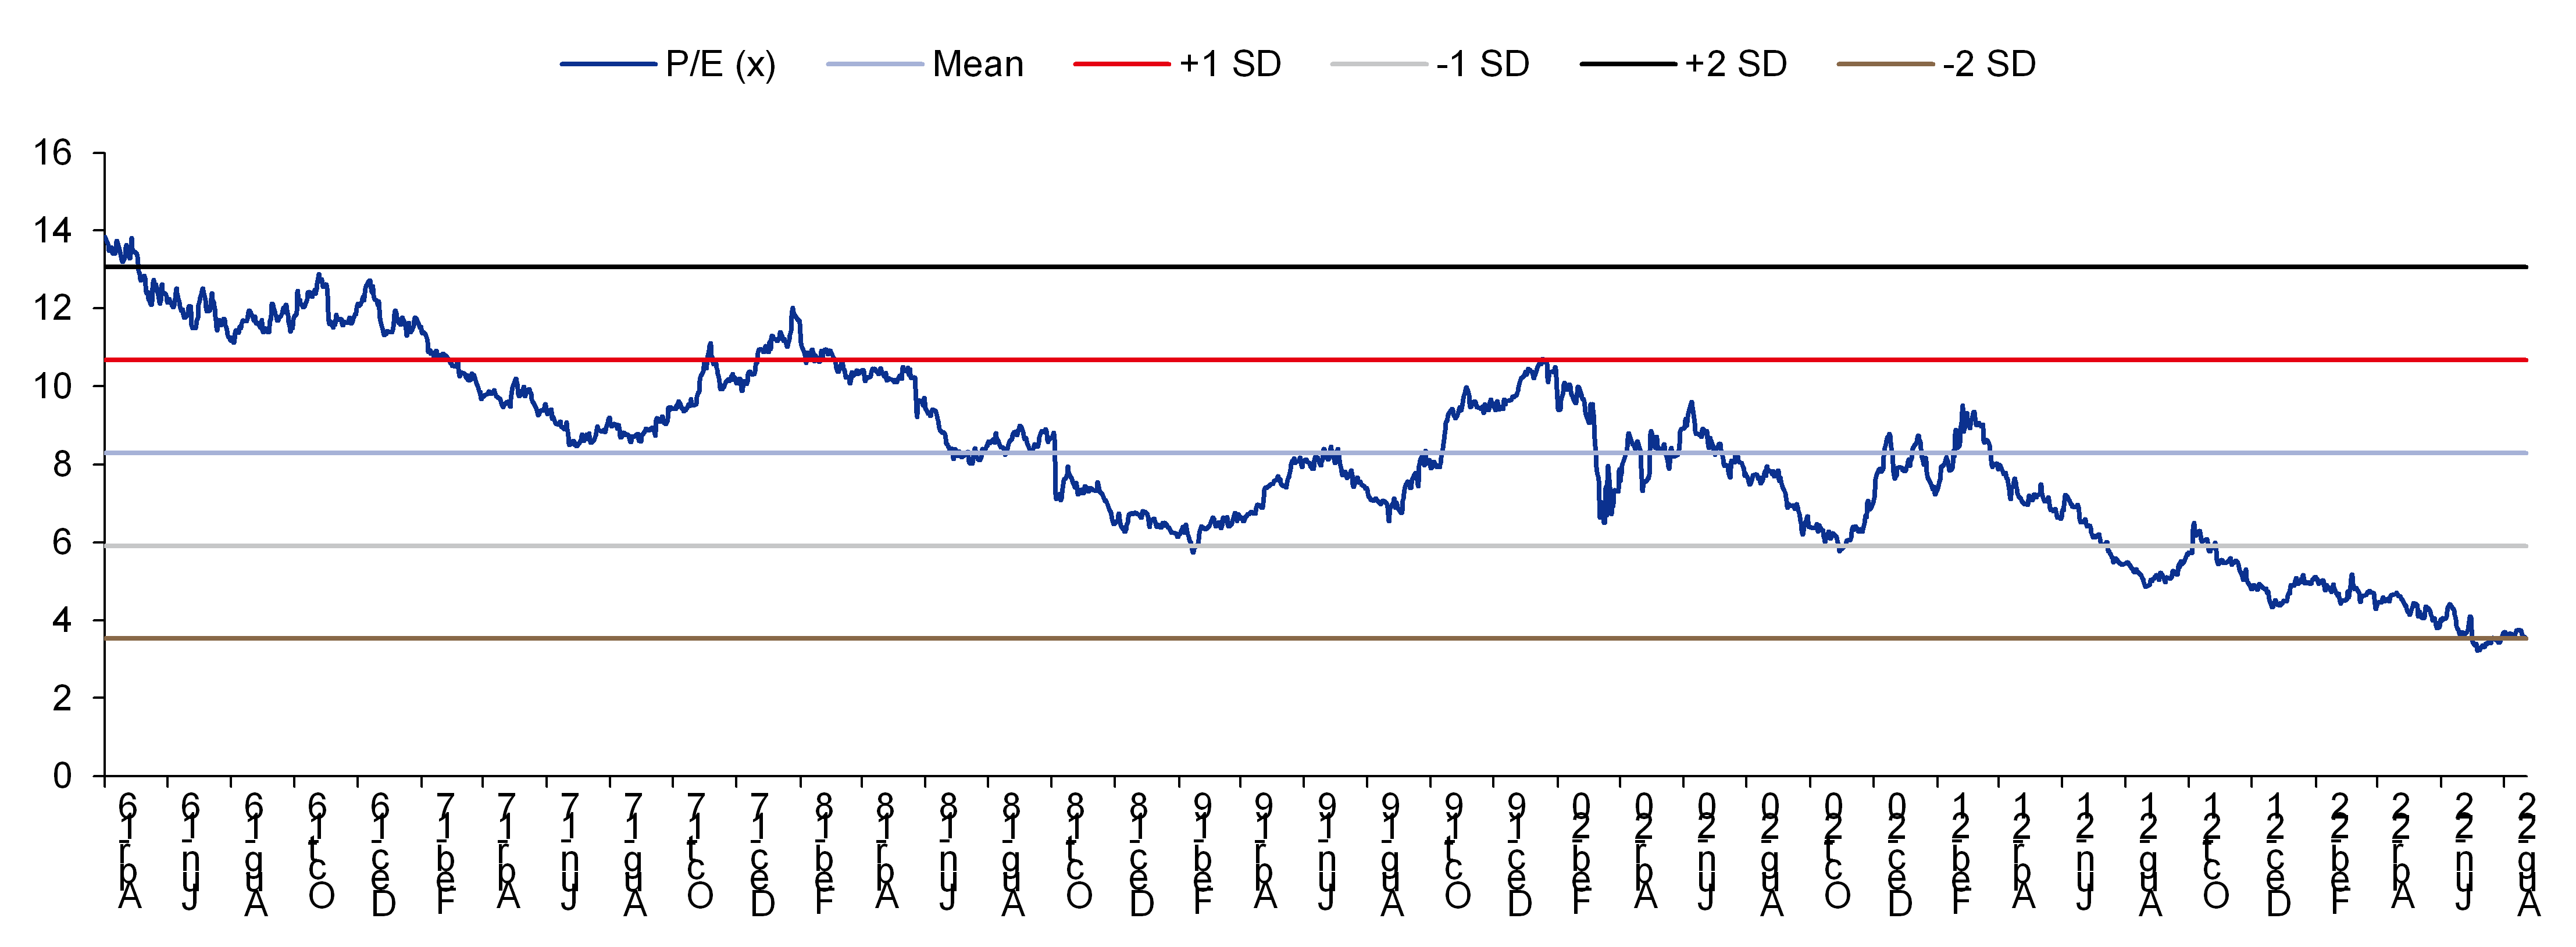
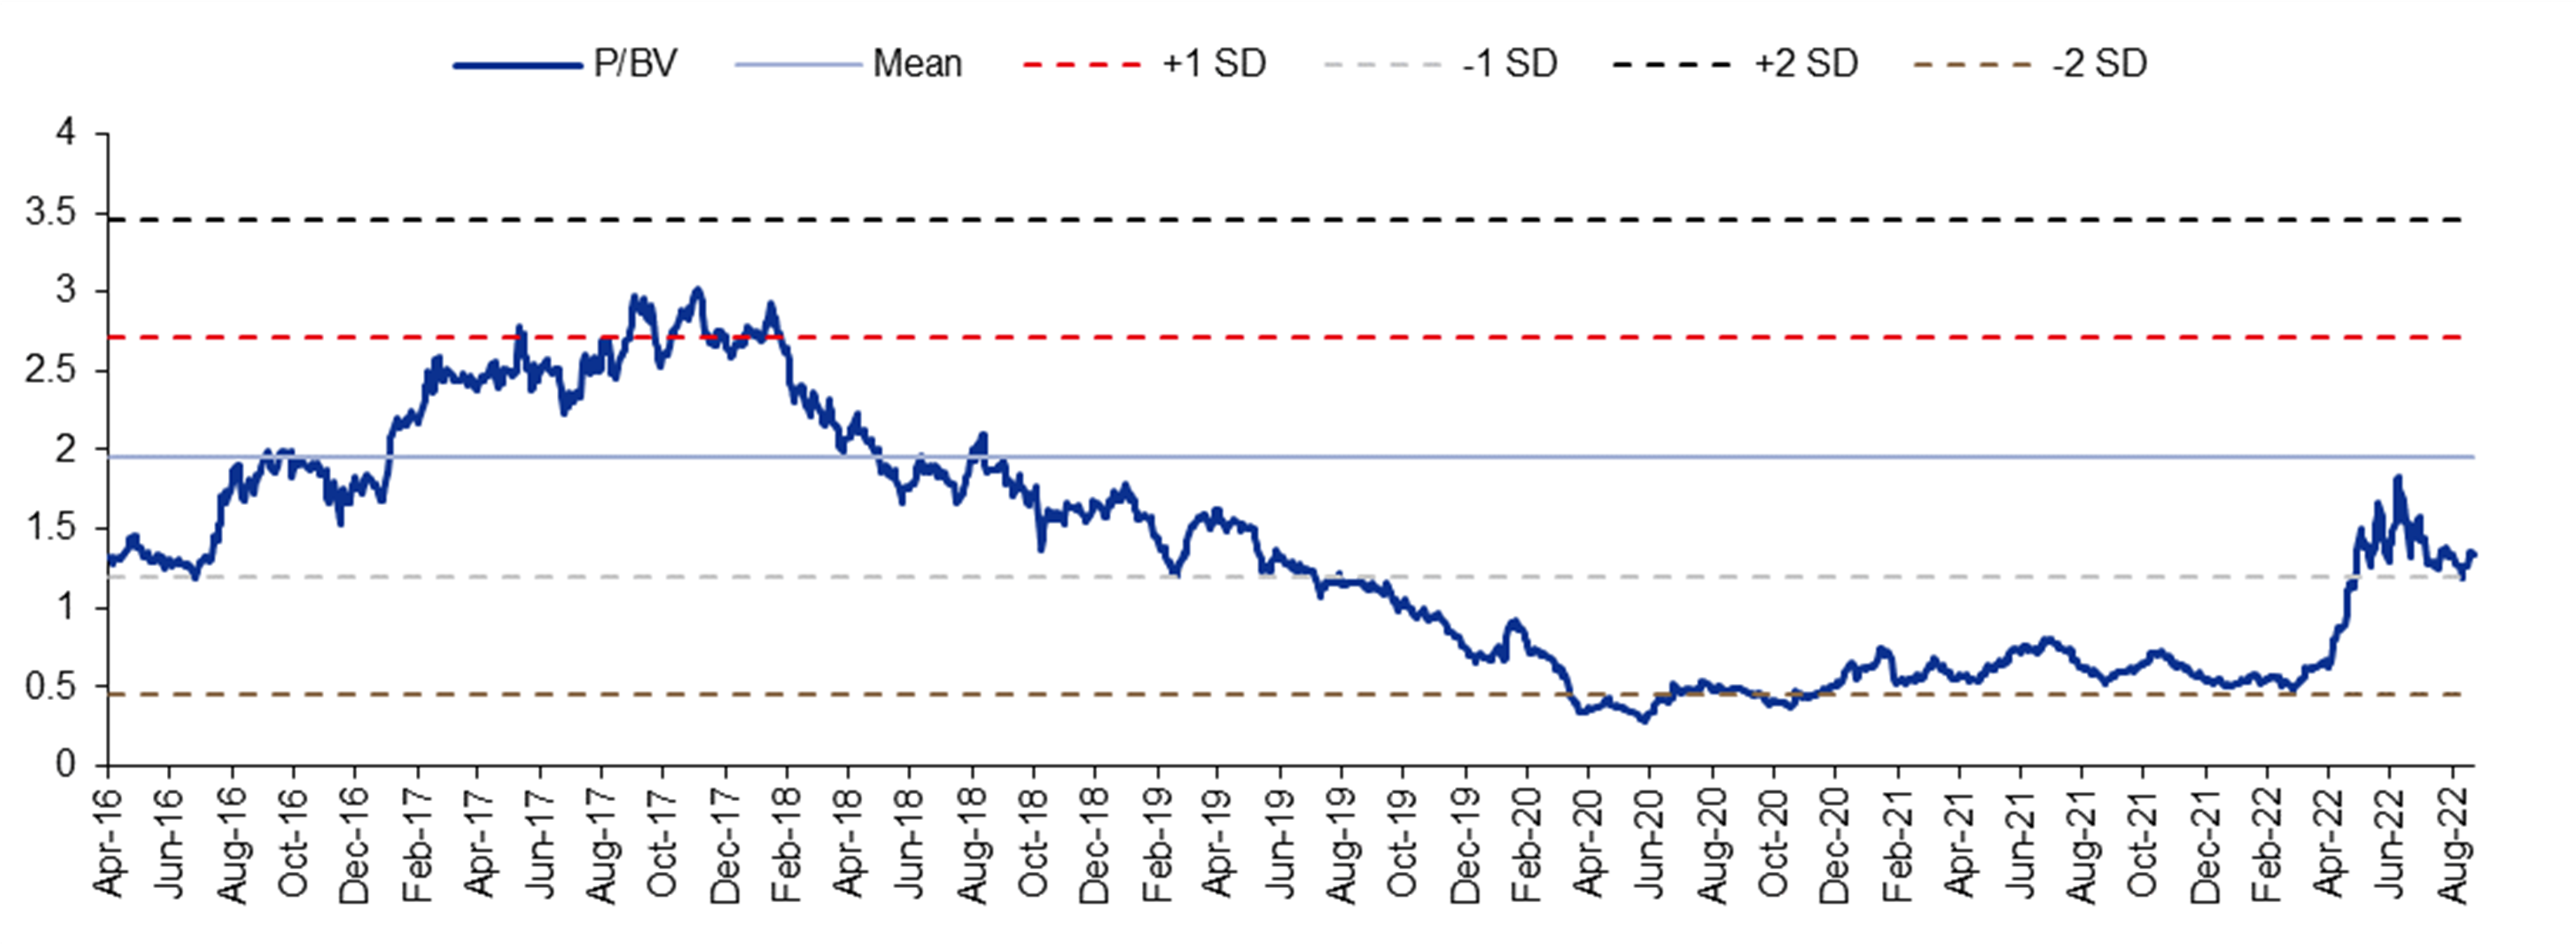
We reiterate Add rating on ONGC with a new target price of Rs221 (from Rs200 earlier). We have used the following assumptions to value the stock: 1) We have incorporated the Government of India or GoI’s recent policy of oil windfall tax by factoring in realization of US$65/bbl, although the long-term trend for crude oil indicates that it will be above US$100/bbl. 2) We have valued only proven reserves and have assumed that the same will get exhausted by 2036F. 3) Joint ventures have come out with robust earnings for consecutive two quarters with a gross refining margin or GRM of +US$20/bbl. ONGC is an attractive value pick with a) a dividend yield of around 9%, and b) one-year forward P/E currently trading at 3.5x FY23F against the historical average of 8.3x. Downside risk to our estimates and target price is the complete collapse of crude oil price to below US$60/bbl.

Financial Summary   

Mar-21A

Mar-22A

Mar-23F

Mar-24F

Mar-25F

Revenue (Rsm)

3,040,010

5,317,619

4,814,722

4,577,294

4,558,231

Operating EBITDA (Rsm)

494,661

798,737

909,291

904,903

887,840

Net Profit (Rsm)

162,488

475,266

463,351

452,085

485,672

Core EPS (Rs)

12.9

36.8

35.9

38.6

Core EPS Growth

49.0%

192.5%

(2.5%)

(2.4%)

7.4%

FD Core P/E (x)

10.36

3.54

3.63

3.72

3.46

DPS (Rs)

3.6

14.0

12.0

10.0

10.0

Dividend Yield

2.69%

10.47%

8.97%

7.48%

7.48%

EV/EBITDA (x)

4.70

2.51

2.18

1.97

1.26

P/FCFE (x)

(210.63)

5.86

11.26

6.66

(4.18)

Net Gearing

49.7%

24.4%

30.2%

22.4%

11.8%

P/BV (x)

0.76

0.47

0.58

0.52

0.51

ROE

7.6%

16.3%

14.2%

14.8%

15.0%

% Change In Core EPS Estimates


17.85%

41.42%


InCred Research/Consensus EPS (x)


Financial Summary   

Mar-21A

Mar-22A

Mar-23F

Mar-24F

Mar-25F

Revenue (Rsm)

3,040,010

5,317,619

4,814,722

4,577,294

4,558,231

Operating EBITDA (Rsm)

494,661

798,737

909,291

904,903

887,840

Net Profit (Rsm)

162,488

475,266

463,351

452,085

485,672

Core EPS (Rs)

12.9

37.8

36.8

35.9

38.6

Core EPS Growth

49.0%

192.5%

(2.5%)

(2.4%)

7.4%

FD Core P/E (x)

10.36

3.54

3.63

3.72

3.46

DPS (Rs)

3.6

14.0

12.0

10.0

10.0

Dividend Yield

2.69%

10.47%

8.97%

7.48%

7.48%

EV/EBITDA (x)

4.70

2.51

2.18

1.97

1.26

P/FCFE (x)

(210.63)

5.86

11.26

6.66

(4.18)

Net Gearing

49.7%

24.4%

30.2%

22.4%

11.8%

P/BV (x)

0.76

0.47

0.58

0.52

0.51

ROE

7.6%

16.3%

14.2%

14.8%

15.0%

% Change In Core EPS Estimates


17.85%

41.42%


InCred Research/Consensus EPS (x)


SOURCES: INCRED RESEARCH, COMPANY REPORTS

Punished too much for GoI’s policy flip-flop

ONGC’s oil production to remain steady

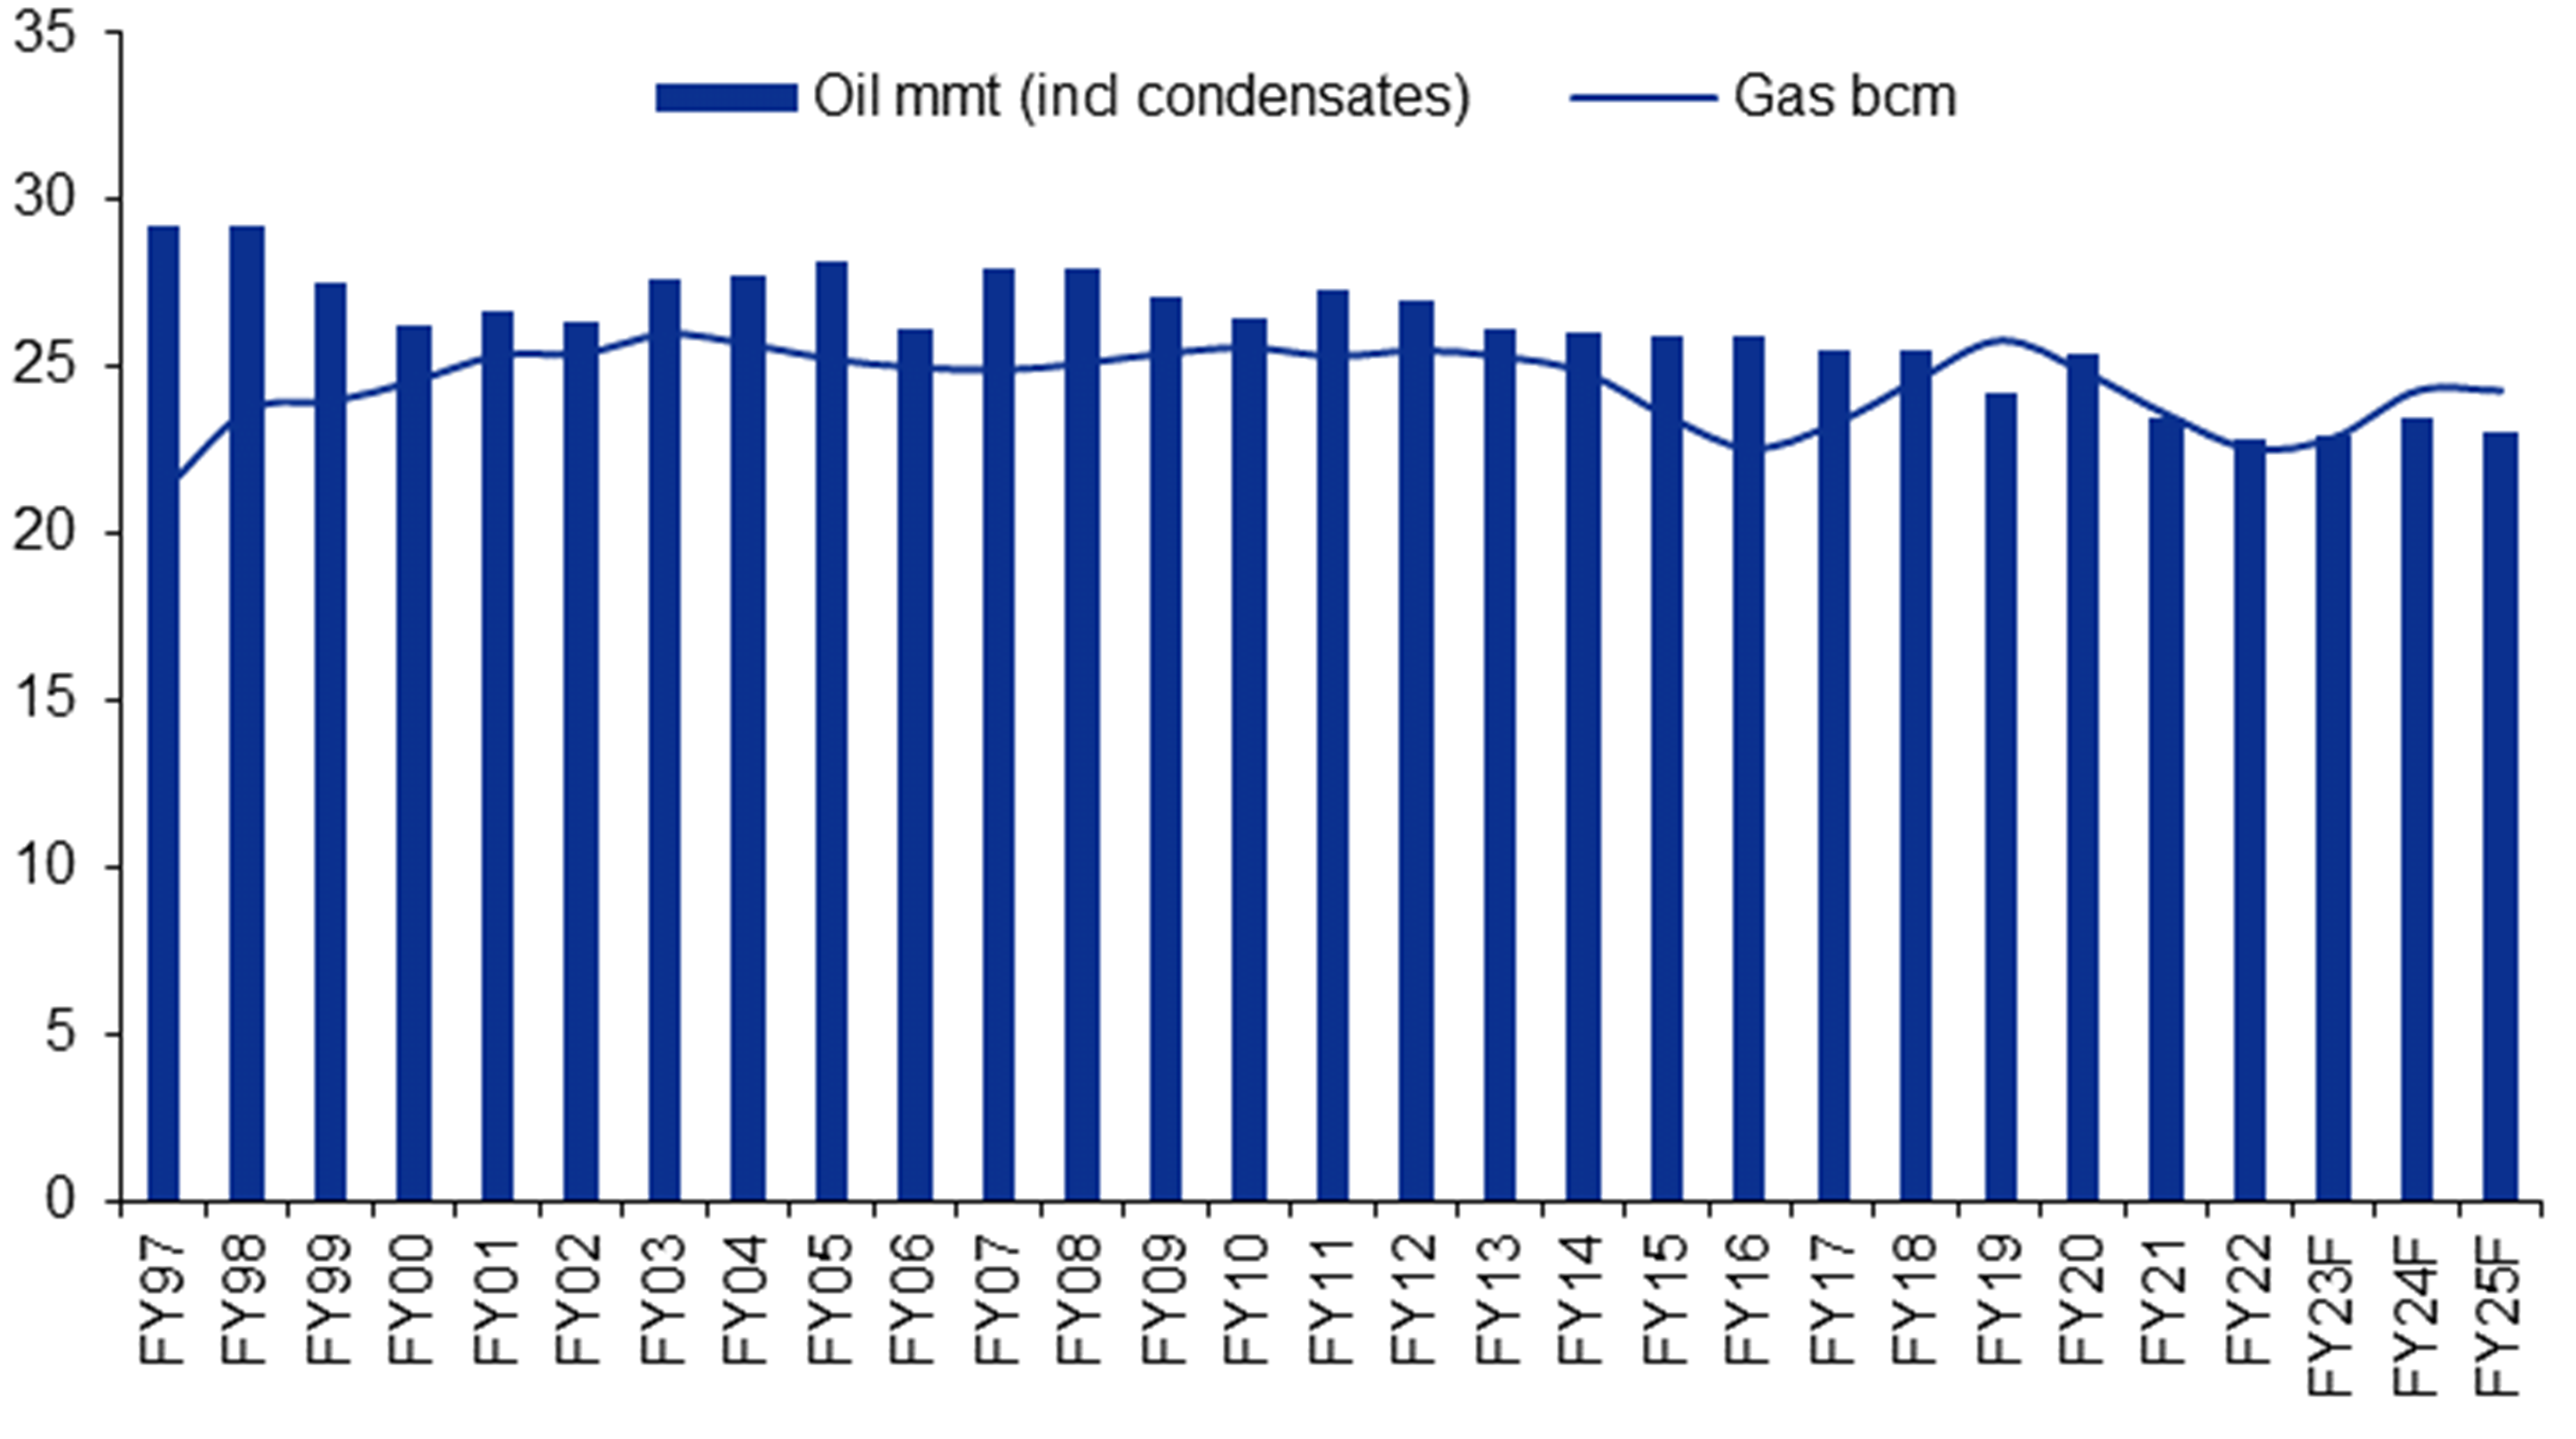
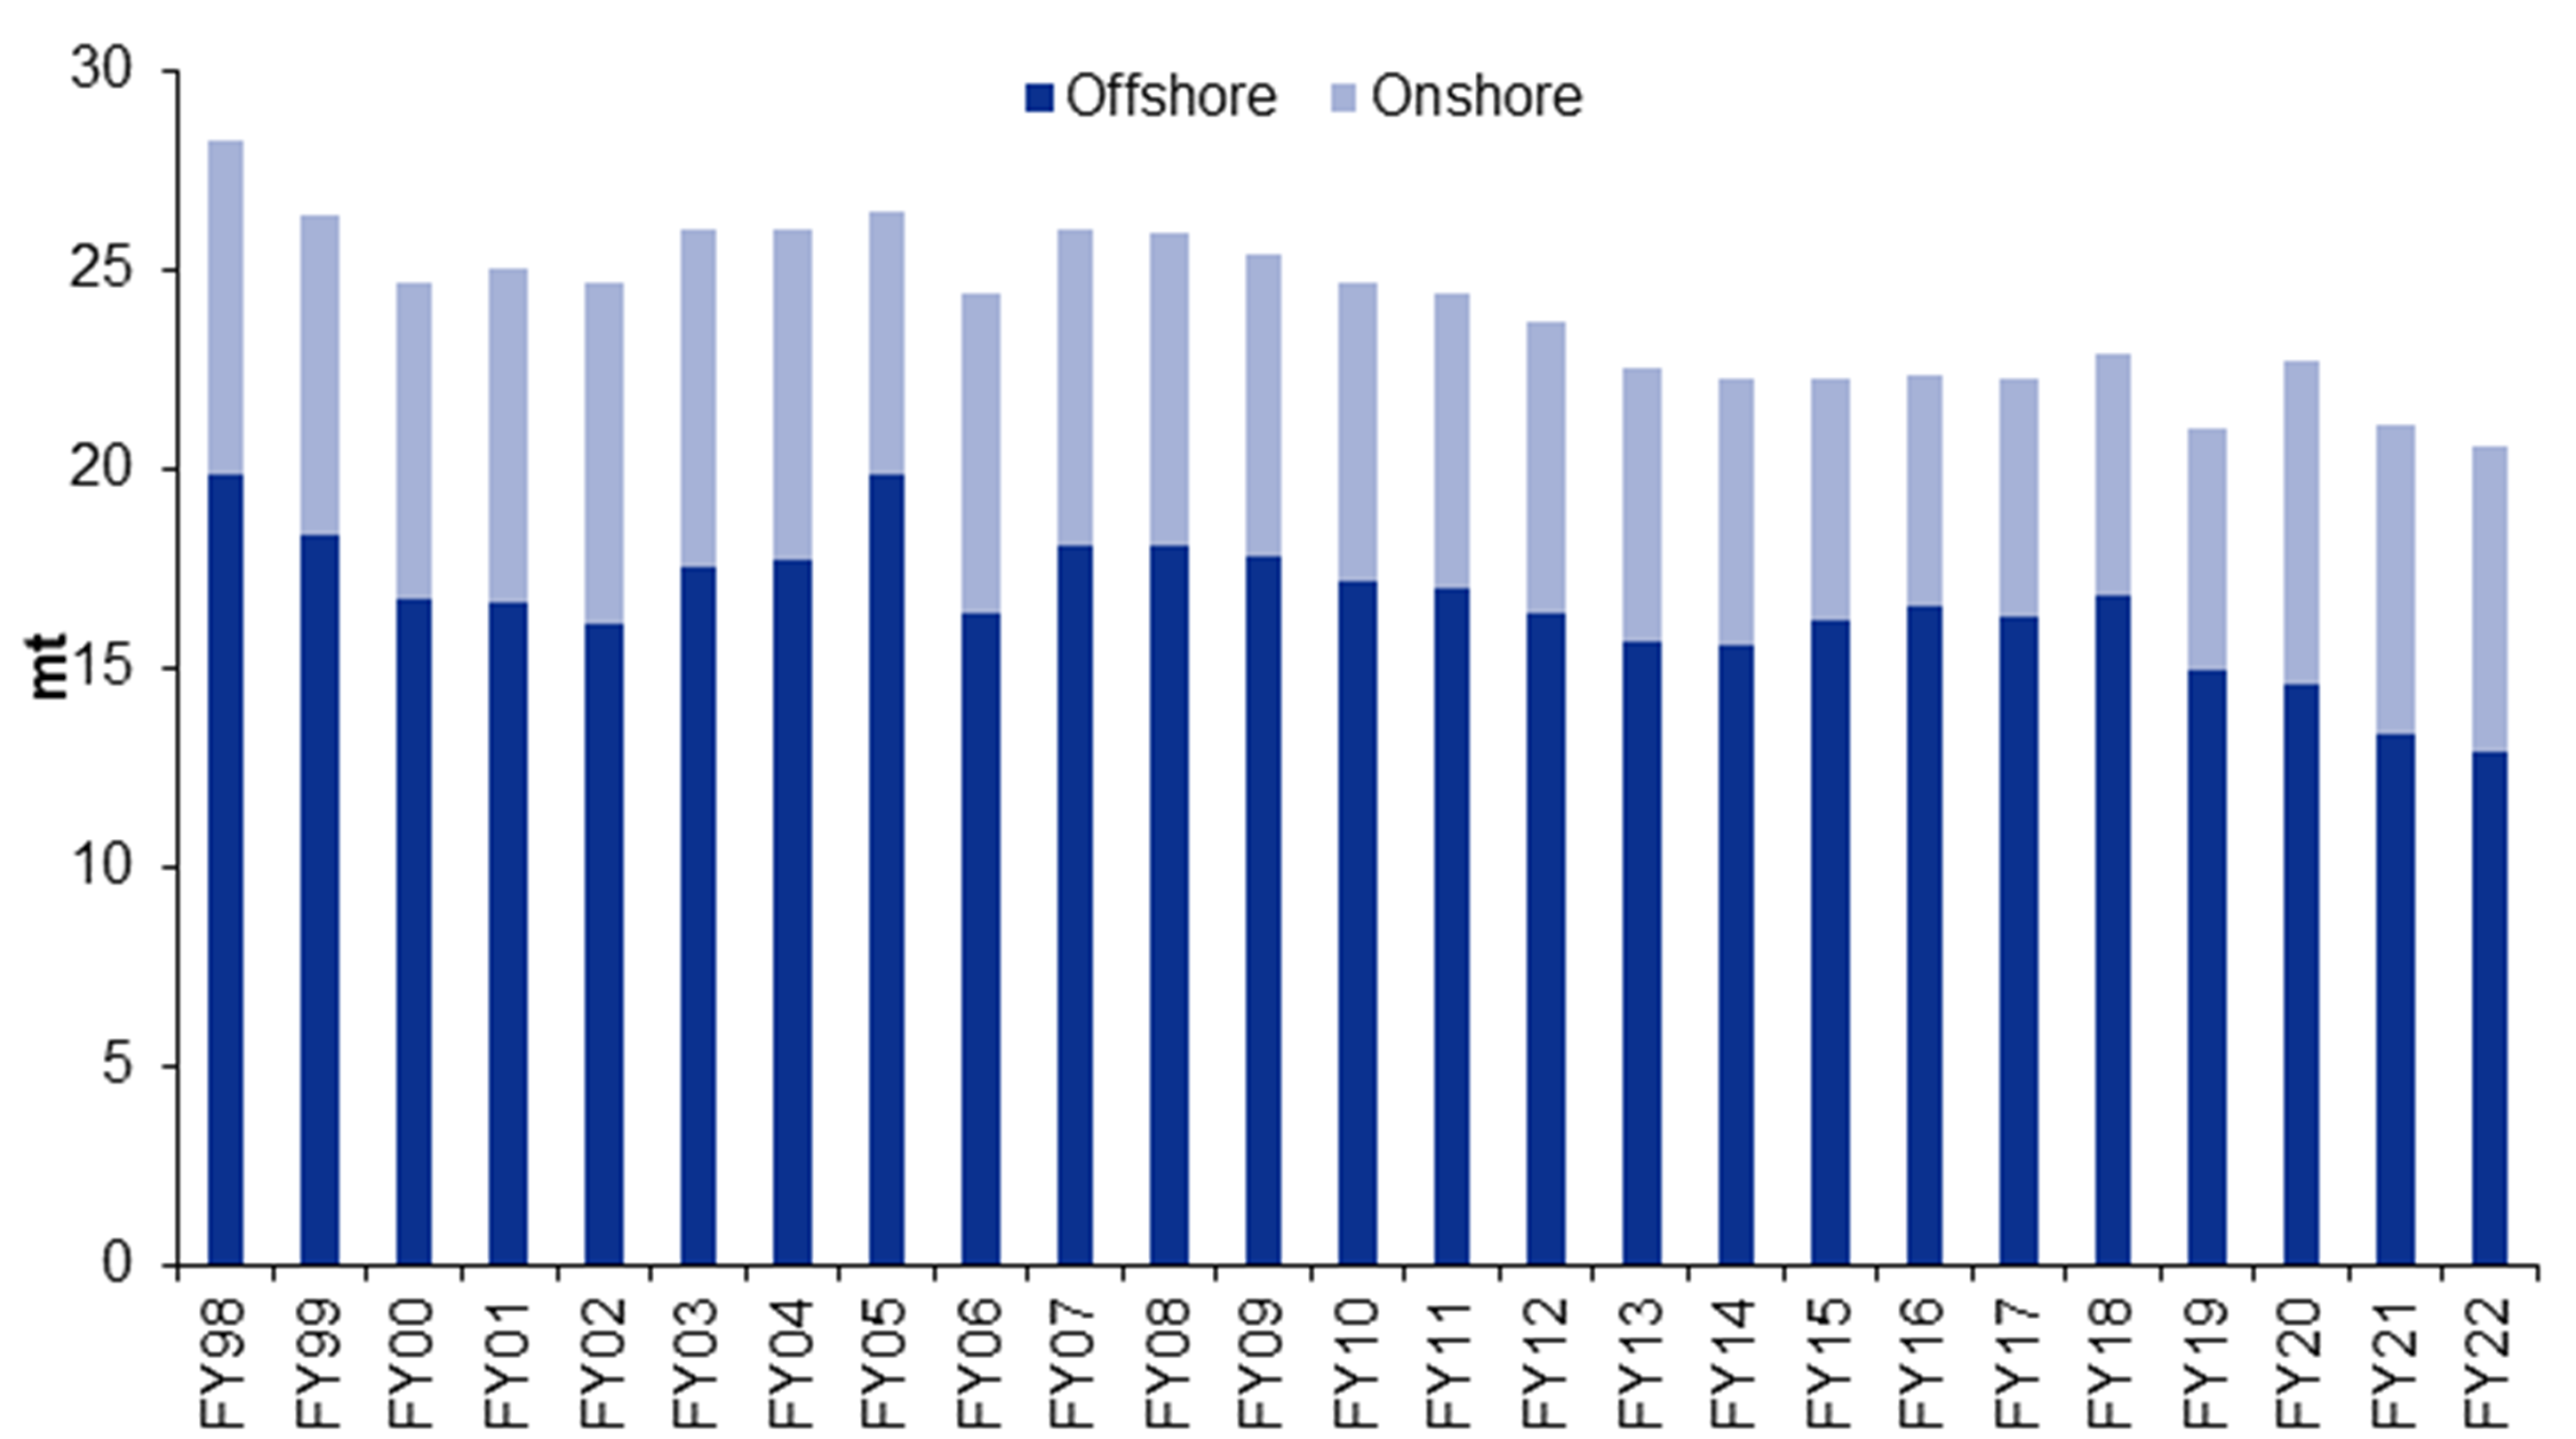
We don’t expect any significant increase in ONGC’s oil and gas production. We expect its oil production to stay around 23mt and gas output to remain steady at 24bcm. Offshore production has passed its prime and it’s a known fact that production is declining over there. While ONGC has recently announced its Rs 330bn capex for oil exploration, we are not building in any new well or oil source in our production estimates.

Expect ONGC to keep producing 23mt of crude oil…

Figure 28: ONGC’s crude oil production to trend downwards over the coming years

SOURCE: INCRED RESEARCH, COMPANY REPORTS

…as offshore assets have passed their prime

Figure 29: Offshore assets of ONGC have passed its prime and we don’t expect any revival of the same

SOURCE: INCRED RESEARCH, COMPANY REPORTS


As ONGC goes on a exploration spree, we expect more exploration-related write-offs in coming years

Figure 30: Depreciation, depletion, and amortization or DD&A charges to remain elevated in coming years as well

SOURCE: INCRED RESEARCH, COMPANY REPORTS

Current JVs’ (MRPL and others) business outlook

Given the diesel shortage and high production cost in Europe, Organization for Economic Co-operation and Development or OECD countries’ diesel cracks are likely to remain in high 40’s or around US$50/bbl levels. Adjusting for freight cost between Europe and Asia, Singapore spreads can remain around US$35/bbl level in the near future. Most Indian refineries are big producers of diesel and hence, for them gasoline spreads are least important. Rather, if gasoline prices fall, it will be positive for oil marketing companies or OMCs as they will start making marketing margins. Given the fall in base crude oil prices, we believe there is little sense in levying export tax on Indian refiners. 

Figure 31: How are JVs performing? Chart shows total oil processed by HPCL at 64%, MRPL at 36% and ONGC at 0.2%

SOURCE: PPAC, INCRED RESEARCH, COMPANY REPORTS

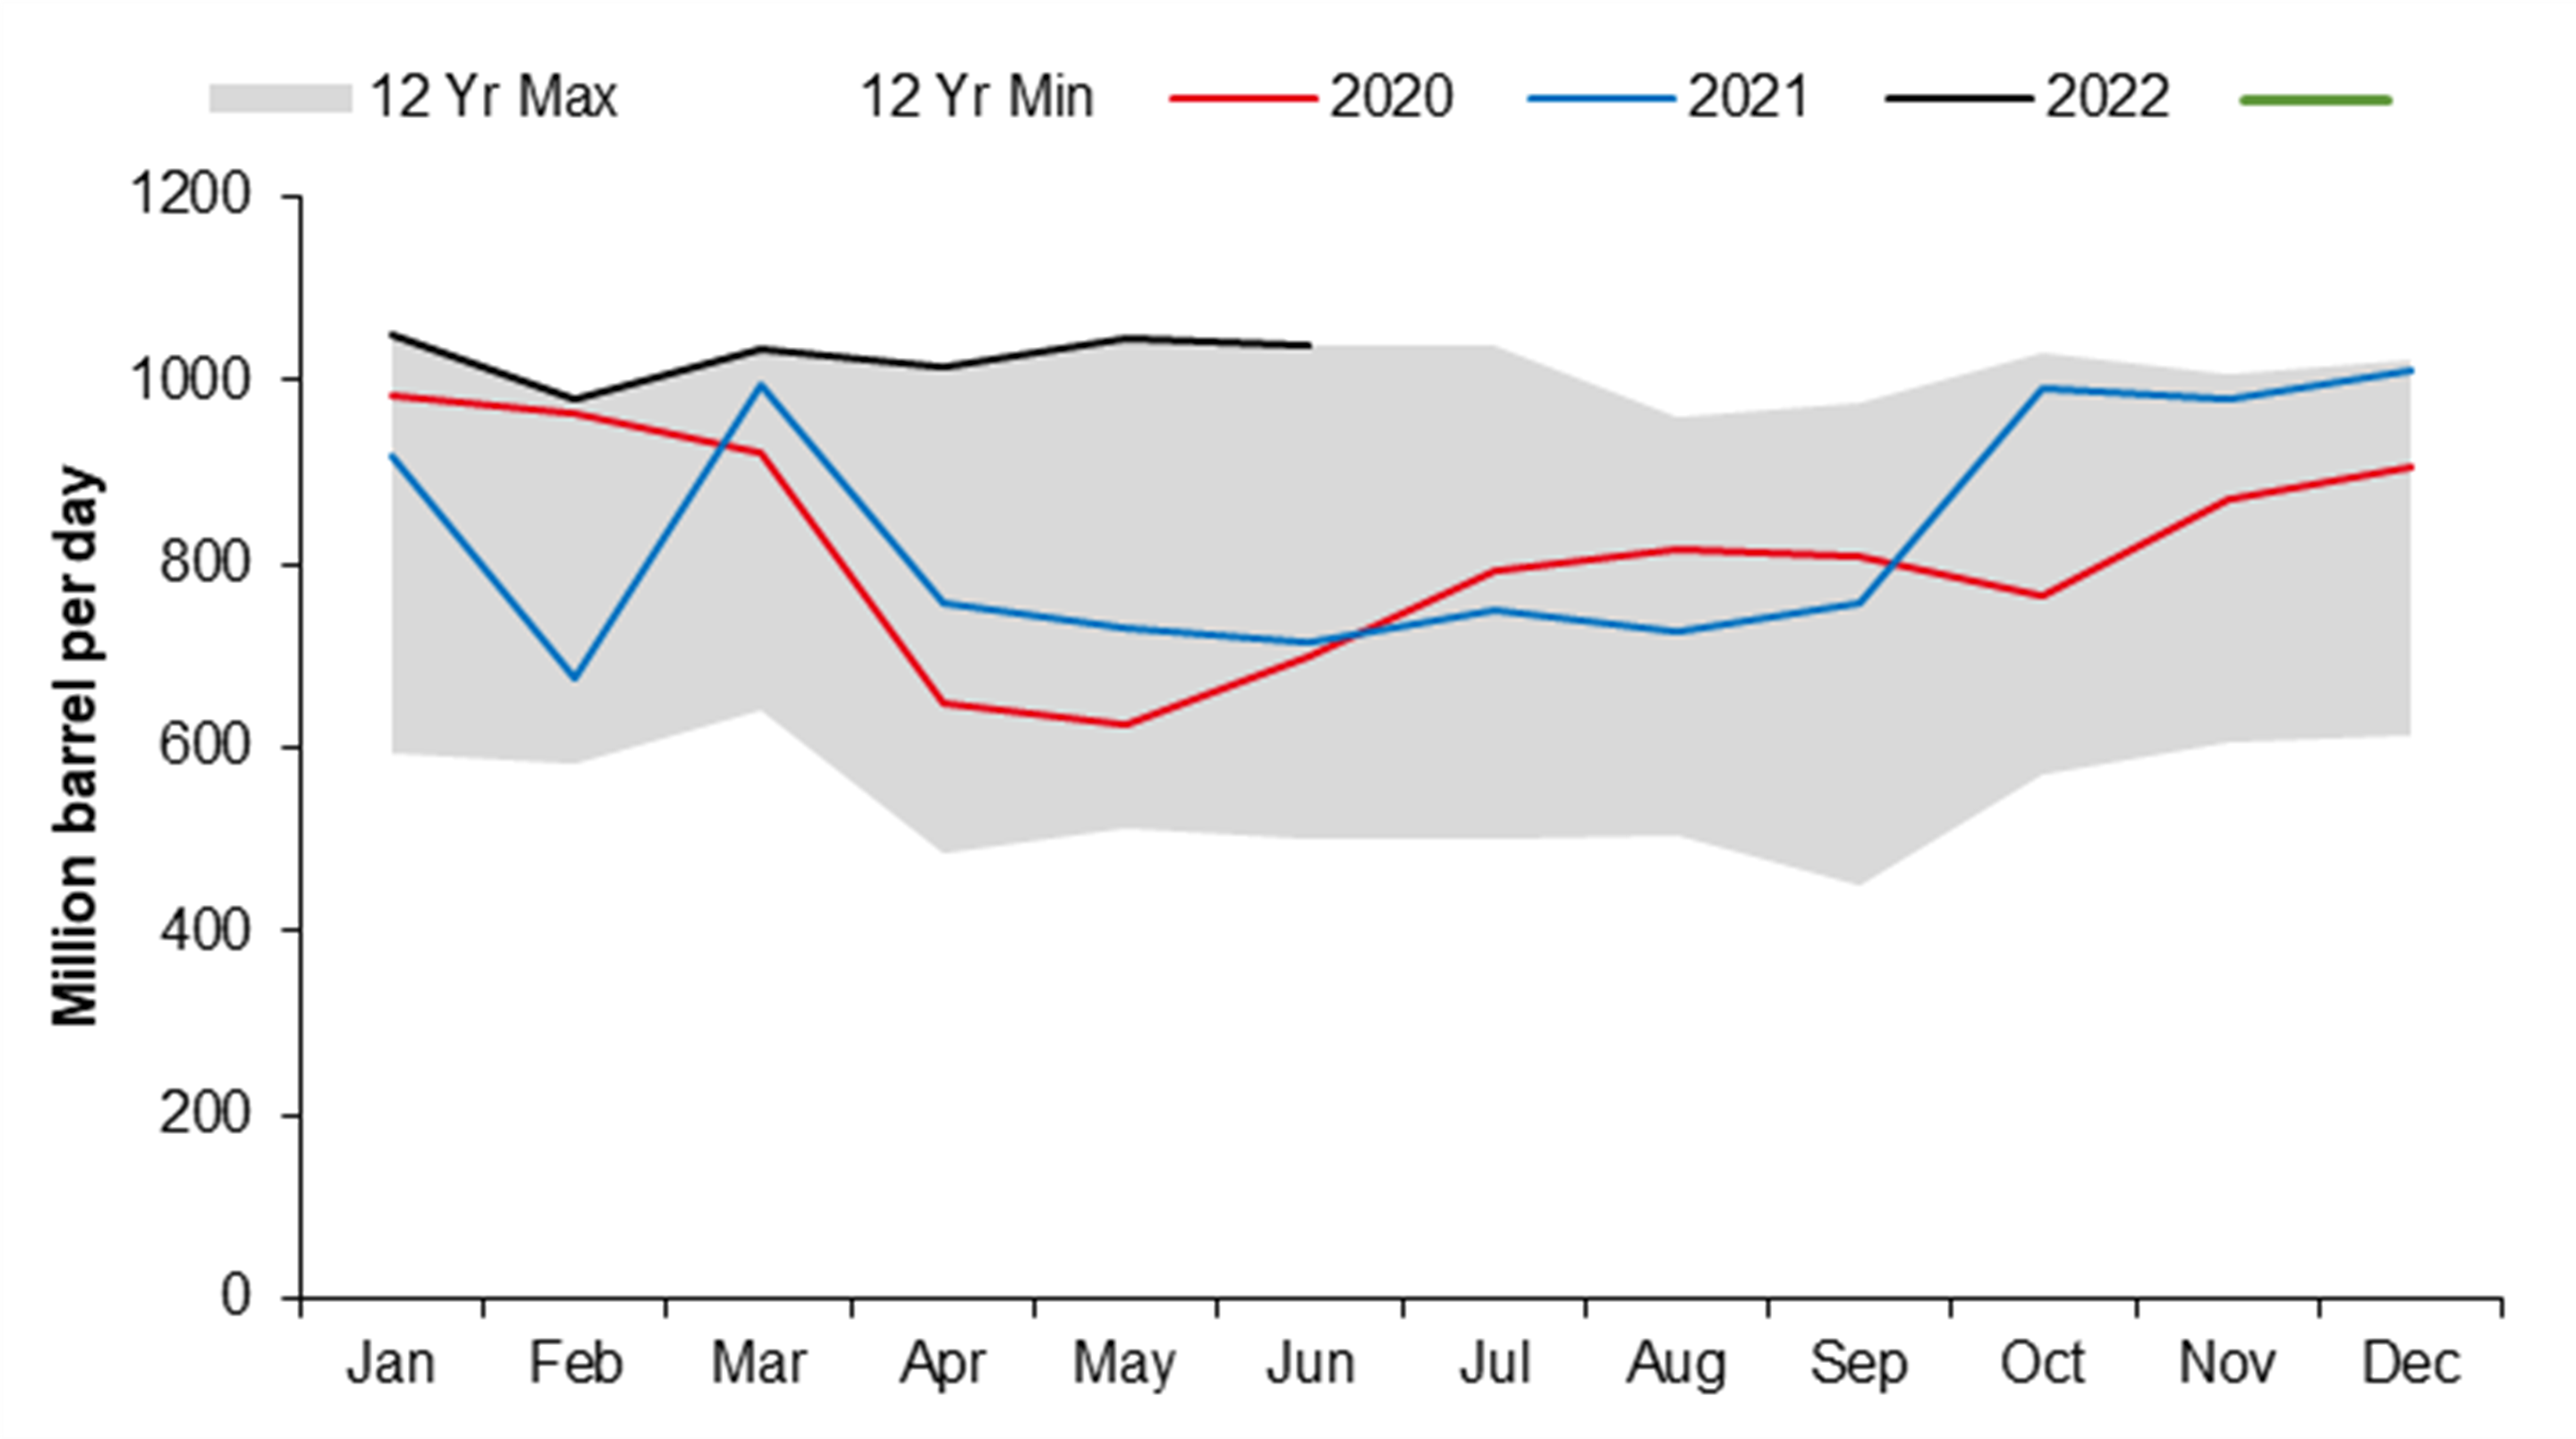
We are in a high energy price age, and ultimately governments will force companies to invest and stop giving dividend, and also ESG (Environmental, Social, and Governance) investment will go into the dustbin of history. Till that time, enjoy the ride!


Figure 32: For last five years, crude oil has seen an overall decline of around 33% in the production rate vis-à-vis 2017

SOURCE: PPAC, INCRED RESEARCH, COMPANY REPORTS

GRM to go in a higher orbit of US$17-25/bbl in coming three-to-four years

The current global refining scenario is something like that of the Indian cement sector in 2005. The scenario is the same – capacity scarcity and prices too low to justify new capex. As of now, capex for a NI index 9-10 refinery can be in the range of around US$40k/bbl (this cost includes interest cost during the construction phase). The long gestation period means that the internal rate of return or IRR has very little sensitivity to interest rates and tax holidays.

Even if the tax remains at 0% in perpetuity and the government provides interest-free loans as refineries become national assets, then also to make a 7-8% equity IRR a project needs US$10/bbl GRM. Normally, emerging market equity return requirement is more than 13%. Governments the world over are taking knee-jerk actions in taxing various components and this won’t help in the long run. The best example of penalization policy which can spur capex is in the UK. In the UK, if companies spend on building capacity, then the effective tax rate is in single digit as against the announced windfall tax of 25% (over and above normal taxes).

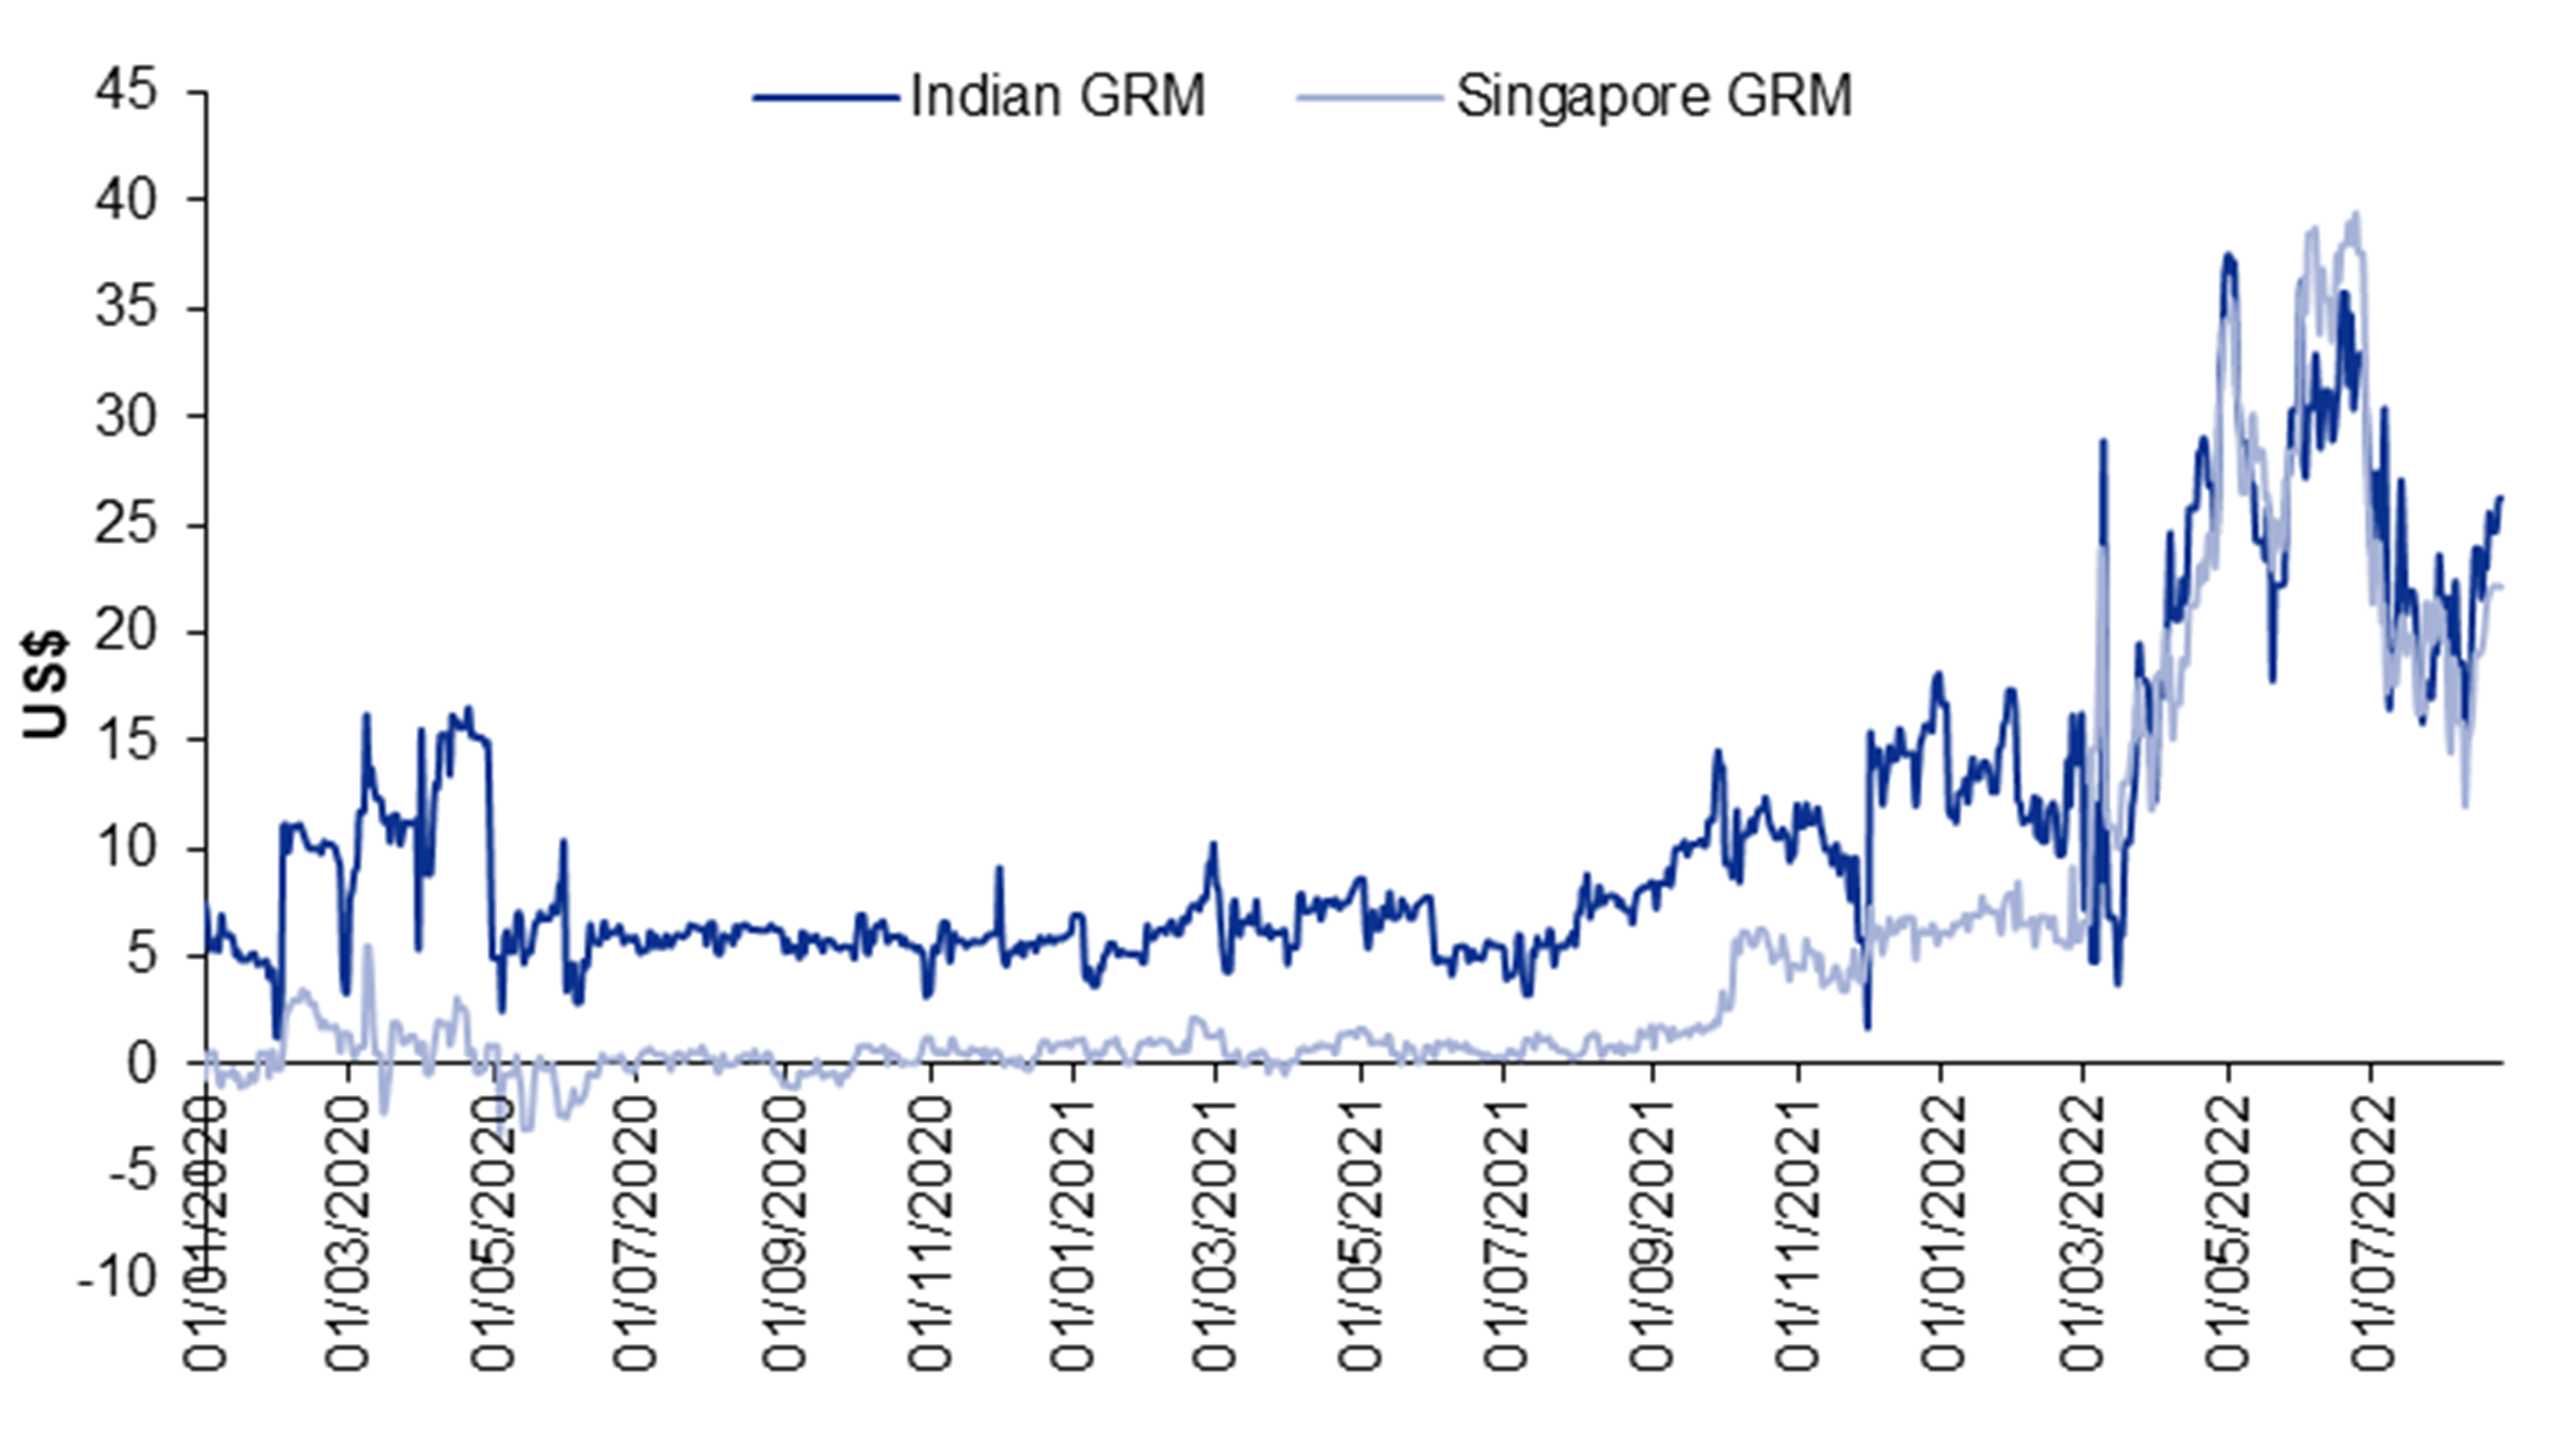
Figure 33: Our assumption of Indian GRM models US$26.27/bbl vs. Singapore GRM of US$22.1/bbl; we expect Indian GRM to remain around US$17-25/bbl for the next three-to-four years

SOURCE: COMPANY REPORTS, INCRED RESEARCH


GRM is essentially the sum of spreads of gasoline, diesel, naphtha, fuel oil and other refinery liquids. In this report, we will focus on individual demand-supply dynamics of all the four components of GRM. In our India GRM model, we have made assumptions as per the percentage of current refined products stated by the Petroleum Planning & Analysis Cell or PPAC.

In coming weeks, we expect a rise in global naphtha price and its discount to crude oil price will wane

Naphtha’s price discount over crude oil is leading to an US$2 loss on GRM for Indian refiners. As naphtha price rises, we will see a rise in reported GRM of Indian refiners. While the whole street is understandably more glued to diesel and gasoline cracks, naphtha has been the biggest GRM spoiler in the last one quarter.

Diesel cracks contribute more than 50% in overall GRM assumption

The Government of India (GoI) has imposed an export tax on gasoline, diesel, and ATF (aviation turbine fuel) which will impact diesel the most, and Indian refiners are one of the biggest producers of diesel in global market. India’s diesel exports are to the tune of ~0.3mbbl/day vs. global demand of 27.8mbbl/day and against global HSD (high-speed diesel) capacity of ~28.5mbbl/day. Please note that Russian supply of 0.9mbbl is already barred from western countries. Shipping constraints won’t make it easy for rerouting Russian cargo to elsewhere as well.

Valuation and analysis

Figure 34: One-year forward P/E trades at 3.5x FY23F

SOURCE: COMPANY REPORTS, INCRED RESEARCH


Figure 35: One-year forward P/BV trades at 1.5x FY23F

SOURCE: INCRED RESEARCH, COMPANY REPORTS


Figure 36: We have valued ONGC on net present value or NPV basis with a target price of Rs221

Shares out (m)

12,580.3

Long-term exchange rate

80.0

DCF value of proved reserves

29,41,049.0

Value per share

233.8

Reserves mboe

4,477.5

US$/boe

8.2

OVL reserves (mt)

161.0

OVL reserves (m boe)

1,207.5

Valuation (US$/boe)

8.2

Valuation (US$ m)

9,914.3

Valuation (Rs m)

7,93,147.2

SOURCE: INCRED RESEARCH, COMPANY REPORTS  

1) We expect Brent crude oil prices to stay still and to trade not lesser than US$65-70/bbl. We have assumed US$65/bbl long-term realization for ONGC. 2) Even at our Brent crude oil price assumption of US$65/bbl vs. spot price of US$97/bbl, ONGC's dividend yield stays at 7-8%, giving a grasp to the stock.

Consolidated quarterly results

Consolidated net sales of ONGC in 1QFY23 stood at Rs1,828.9bn,+69.1% yoy and +17.3% qoq. EBITDA stood at Rs188.5bn, +15.8% yoy and -17.3% qoq. PBT at Rs122.2bn grew 19.9% yoy and fell 22.6% qoq. Net profit at Rs85.8bn grew 43.4% yoy and fell 28.9% qoq.

Figure 37: ONGC’s consolidated quarterly result trend

Rs bn

1QFY22

2QFY22

3QFY22

4QFY22

1QFY23

yoy%

qoq%

Net sales

1,081.4

1,220.3

1,456.9

1,559.2

1,828.9

69.1%

17.3%

EBITDAX

175.3

185.4

225.6

271.4

200.8

14.5%

-26.0%

Exploration well cost

6.0

5.0

8.4

19.7

4.5

-24.5%

-77.0%

EBITDA

162.9

177.5

214.2

244.1

188.6

15.8%

-22.8%

Interest

-14.4

-13.8

-13.9

-14.9

-16.4

13.9%

10.0%

Depreciation

-64.2

-62.3

-68.5

-73.8

-66.1

2.9%

-10.4%

Other income

11.7

14.2

21.3

27.3

12.6

7.6%

-54.0%

Share in associate cos./JVs

6.0

5.4

7.0

-3.8

10.4

71.2%

-373.0%

Profit before tax

101.9

121.0

160.1

157.8

122.2

19.9%

-22.6%

Net profit

59.9

180.6

109.3

120.6

85.8

43.4%

-28.9%

Quarterly EPS (Rs)

4.8

14.4

8.7

9.6

6.8

43.4%

-28.9%

SOURCE: INCRED RESEARCH, COMPANY REPORTS  


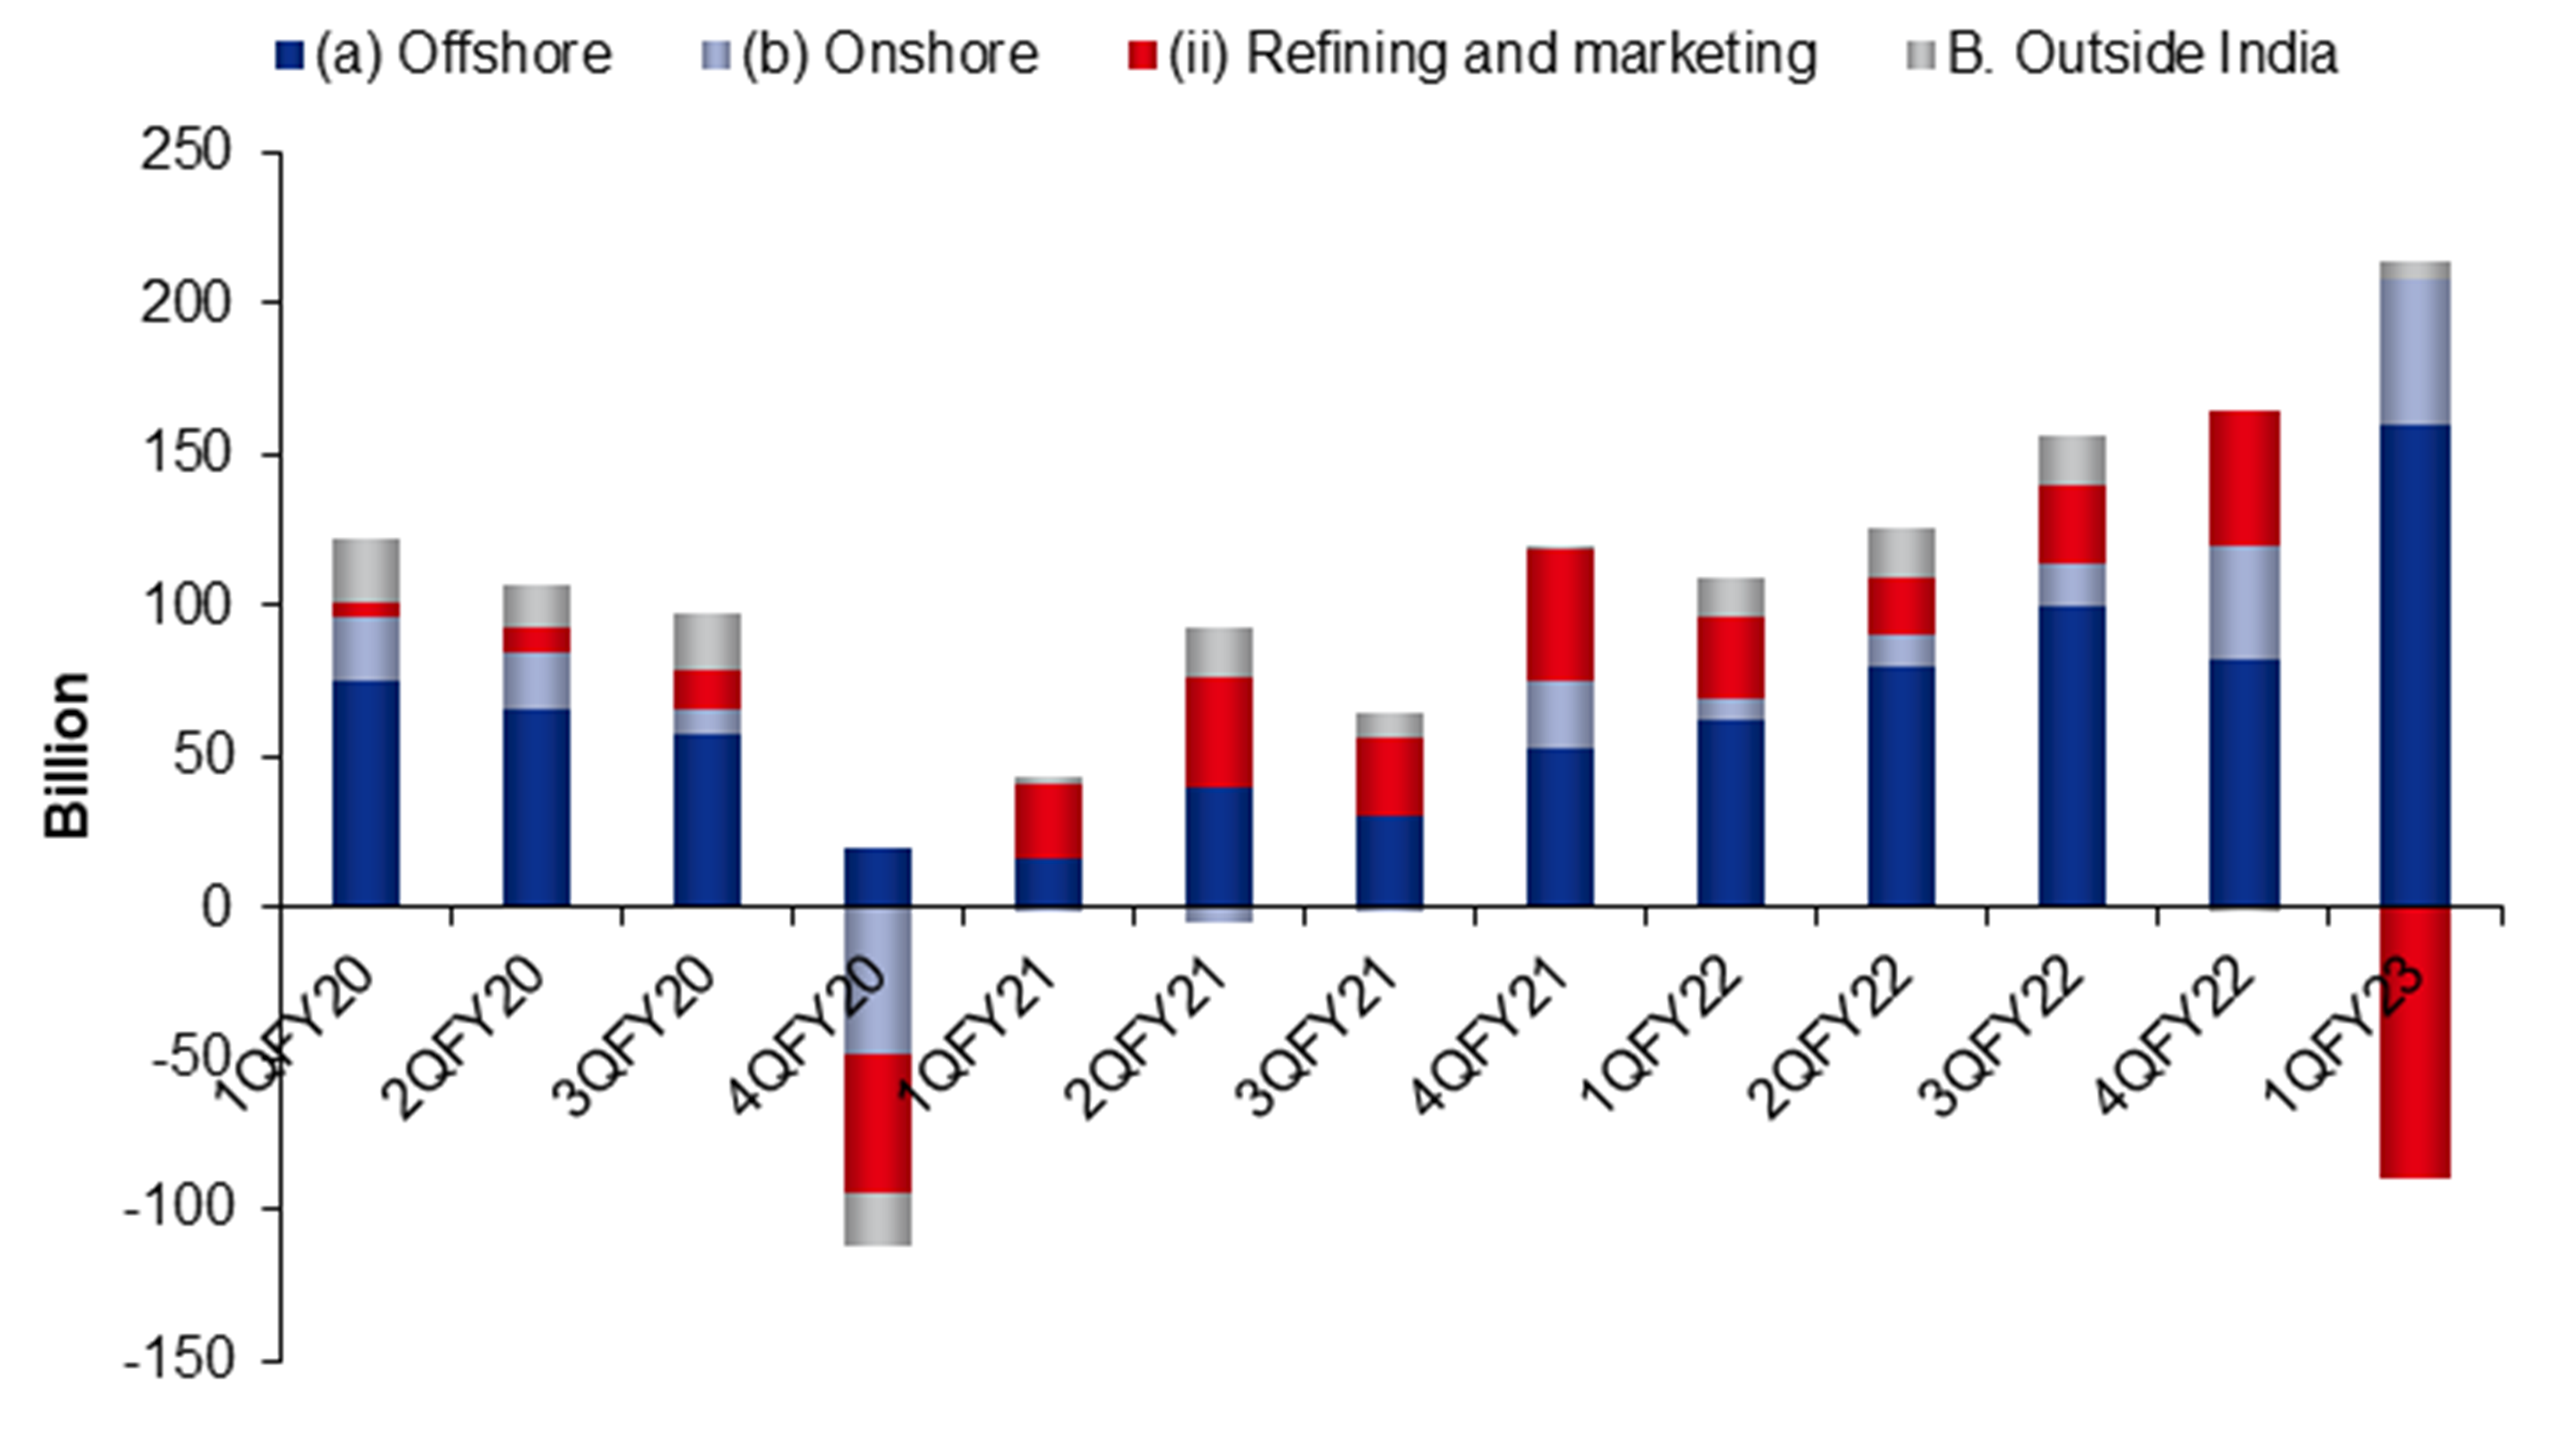
Figure 38: Segmental revenue in 1QFY23 stood at Rs2,035.3bn, up 70.4% qoq

SOURCE: INCRED RESEARCH, COMPANY REPORTS


Figure 39: Segmental EBIT in 1QFY23 - refining and marketing margin fell by 430% yoy and 298.3% qoq

SOURCE: INCRED RESEARCH, COMPANY REPORTS


BY THE NUMBERS 


Profit & Loss 

(Rs mn)   

Mar-21A

Mar-22A

Mar-23F

Mar-24F

Mar-25F

Total Net Revenues

3,040,010

5,317,619

4,814,722

4,577,294

4,558,231

Gross Profit

566,016

857,668

977,295

975,907

956,844

Operating EBITDA

494,661

798,737

909,291

904,903

887,840

Depreciation And Amortisation

(246,197)

(268,832)

(264,991)

(281,396)

(255,809)

Operating EBIT

248,464

529,905

644,300

623,507

632,032

Financial Income/(Expense)

(50,790)

(56,960)

(66,638)

(66,307)

(52,313)

Pretax Income/(Loss) from Assoc.


Non-Operating Income/(Expense)

93,230

74,376

71,733

74,775

69,524

Profit Before Tax (pre-EI)

290,904

547,321

649,395

631,975

649,242

Exceptional Items


Pre-tax Profit

290,904

547,321

649,395

631,975

649,242

Taxation

(87,661)

(47,971)

(176,201)

(163,414)

(137,205)

Exceptional Income - post-tax


Profit After Tax

203,243

499,350

473,194

468,560

512,038

Minority Interests

(50,948)

(38,724)

(30,488)

(38,053)

(28,074)

Preferred Dividends


FX Gain/(Loss) - post tax


Other Adjustments - post-tax

10,193

14,639

20,645

21,578

1,708

Net Profit

162,488

475,266

463,351

452,085

485,672

Recurring Net Profit

162,488

475,266

463,351

452,085

485,672

Fully Diluted Recurring Net Profit

162,488

475,266

463,351

452,085

485,672


Cash Flow 

(Rs mn)     

Mar-21A

Mar-22A

Mar-23F

Mar-24F

Mar-25F

EBITDA

494,661

798,737

909,291

904,903

887,840

Cash Flow from Invt. & Assoc.

93,230

74,376

71,733

74,775

69,524

Change In Working Capital

44,365

70,365

(43,246)

21,139

67,199

(Incr)/Decr in Total Provisions


Other Non-Cash (Income)/Expense

(7,656)

(75,768)

9,736

8,527

(115,962)

Other Operating Cashflow

(16,216)

9,256

14,692

19,266

19,266

Net Interest (Paid)/Received

(50,790)

(56,960)

(66,638)

(66,307)

(52,313)

Tax Paid

(87,661)

(47,971)

(176,201)

(163,414)

(137,205)

Cashflow From Operations

469,933

772,035

719,367

798,888

738,349

Capex

(417,488)

(479,737)

(484,734)

(458,634)

(401,634)

Disposals Of FAs/subsidiaries


Acq. Of Subsidiaries/investments

(105,371)

(59,365)

(55,100)

(55,099)

(331,388)

Other Investing Cashflow


Cash Flow From Investing

(522,859)

(539,102)

(539,834)

(513,733)

(733,023)

Debt Raised/(repaid)

44,938

54,033

(30,105)

(32,445)

(407,744)

Proceeds From Issue Of Shares


Shares Repurchased


Dividends Paid

(22,015)

(114,481)

(213,236)

(129,577)

(125,803)

Preferred Dividends


Other Financing Cashflow


Cash Flow From Financing

22,922

(60,448)

(243,341)

(162,021)

(533,547)

Total Cash Generated

(30,004)

172,485

(63,808)

123,133

(528,221)

Free Cashflow To Equity

(7,988)

286,965

149,428

252,710

(402,418)

Free Cashflow To Firm

(2,136)

289,893

246,170

351,462

57,640

SOURCES: INCRED RESEARCH, COMPANY REPORTS


BY THE NUMBERS…cont’d


Balance Sheet 

(Rs mn)   

Mar-21A

Mar-22A

Mar-23F

Mar-24F

Mar-25F

Total Cash And Equivalents

126,099

450,964

401,750

543,128

495,294

Total Debtors

185,788

218,941

207,851

196,847

157,224

Inventories

445,733

446,130

428,198

414,148

415,012

Total Other Current Assets

426,147

445,728

462,883

480,197

400,026

Total Current Assets

1,183,767

1,561,763

1,500,681

1,634,320

1,467,556

Fixed Assets

3,026,350

4,102,915

3,355,339

3,475,753

2,945,007

Total Investments

781,161

840,526

895,627

950,726

1,282,114

Intangible Assets

135,386

135,386

135,386

135,386

12,108

Total Other Non-Current Assets


Total Non-current Assets

3,942,897

5,078,828

4,386,352

4,561,865

4,239,229

Short-term Debt

306,576

277,596

213,739

200,042

219,711

Current Portion of Long-Term Debt


Total Creditors

810,873

934,368

879,254

892,652

843,712

Other Current Liabilities


Total Current Liabilities

1,117,449

1,211,964

1,092,993

1,092,695

1,063,424

Total Long-term Debt

1,025,294

1,108,307

1,142,059

1,123,311

695,898

Hybrid Debt - Debt Component


Total Other Non-Current Liabilities


Total Non-current Liabilities

1,025,294

1,108,307

1,142,059

1,123,311

695,898

Total Provisions

557,953

482,186

491,923

500,449

381,696

Total Liabilities

2,700,696

2,802,457

2,726,974

2,716,455

2,141,017

Shareholders Equity

2,209,811

3,612,772

2,914,539

3,211,869

3,271,056

Minority Interests

216,158

225,361

245,519

267,860

294,710

Total Equity

2,425,969

3,838,133

3,160,059

3,479,729

3,565,766


Key Ratios 


Mar-21A

Mar-22A

Mar-23F

Mar-24F

Mar-25F

Revenue Growth

(23.4%)

74.9%

(9.5%)

(4.9%)

(0.4%)

Operating EBITDA Growth

(12.2%)

61.5%

13.8%

(0.5%)

(1.9%)

Operating EBITDA Margin

16.3%

15.0%

18.9%

19.8%

19.5%

Net Cash Per Share (Rs)

(95.85)

(74.32)

(75.84)

(62.02)

(33.41)

BVPS (Rs)

175.66

287.18

231.68

255.31

260.01

Gross Interest Cover

4.89

9.30

9.67

9.40

12.08

Effective Tax Rate

30.1%

8.8%

27.1%

25.9%

21.1%

Net Dividend Payout Ratio

27.9%

37.1%

32.6%

27.8%

25.9%

Accounts Receivables Days

18.09

13.89

16.18

16.14

14.18

Inventory Days

57.26

36.49

41.58

42.69

42.02

Accounts Payables Days

109.24

71.41

86.25

89.79

87.99

ROIC (%)

5.5%

9.0%

13.0%

12.2%

15.3%

ROCE (%)

8.4%

12.4%

13.7%

13.9%

14.2%

Return On Average Assets

5.1%

9.5%

8.7%

8.9%

9.3%

SOURCES: INCRED RESEARCH, COMPANY REPORTS


​India

ADD (no change)

Consensus ratings*:

Buy 16

Hold 2

Sell 2


Current price:

Rs185

Target price:

q

Rs261

Previous target:

Rs265

Up/downside:

41.1%

InCred Research / Consensus:

5.4%


Reuters:


Bloomberg:

OINL IN

Market cap:

US$2,762m


Rs200,561m

Average daily turnover:

US$12.9m


Rs936.8m

Current shares o/s:

1,084.4m

Free float:

43.3%

*Source: Bloomberg


Source: Bloomberg

Price performance

1M

3M

12M

Absolute (%)

(5.4)

(20.4)

10.0

Relative (%)

(10.2)

(27.1)

4.3

Major shareholders

% held

Government of India

56.7

LIC

11.9

Indian Oil

4.9


Analyst(s)

Satish KUMAR

T (91) 22 4161 1562

E satish.kumar@incredcapital.com

Abbas PUNJANI

T (91) 22 4161 1562

E abbas.punjani@incredcapital.com


Analyst(s)

Satish KUMAR

T (91) 22 4161 1562

E satish.kumar@incredcapital.com

Abbas PUNJANI

T (91) 22 4161 1562

E abbas.punjani@incredcapital.com


Oil India

Treads the path of increasing production

Oil India is an undervalued stock in India’s energy sector. Government policy uncertainty led to a severe derating of the stock.

Recent government actions indicate that Oil India can make US$65-70/bbl realization, and we build in US$65/bbl in our earnings estimates.

Oil India is an undervalued stock in India’s energy sector. Government policy uncertainty led to a severe derating of the stock.

Recent government actions indicate that Oil India can make US$65-70/bbl realization, and we build in US$65/bbl in our earnings estimates.

The stock trades at 3.8x FY23F EPS with a dividend yield of 7.5%. With long-term crude oil prices to remain in an uptrend, Oil India is an attractive value pick. Retain Add rating.

Brent crude oil prices unlikely to fall below US$80-85/bbl

Geopolitics, lack of investment in oil assets, dwindling strategic petroleum reserves (SPR) as well as the Organization of the Petroleum Exporting Countries or OPEC’s own financial condition indicates that Brent crude oil prices are unlikely to remain below US$80-85/bbl for a long time. Hence, the odds are in favour of Oil India. Media frenzy and unwarranted investor activism has led to a steep decline in investment in oil assets. Companies are delivering fat dividends, but not investing enough. In fact, Saudi Arabia’s oil major Aramco in its 1HCY22 presentation said that given the current rate of investments, global crude oil production capacity can decline to ~95mbbl by 2025F. There isn’t going to be any revolution in clean energy by that time and hence, crude oil prices will rise. In between, there can be many factors like release of SPR, US President Joe Biden’s statements and what not, but the trajectory for crude oil is up from this level.

Oil India presents attractive opportunity to play crude oil Bull cycle

While government policy will always remain an overhang and hence the full value of the stock may never be realized, recent/past events indicate that government is happy letting Oil India make around US$65-70/bbl.  Oil India is investing in oil exploration but to be on the conservative side, we have valued only the proven reserves of the state-owned company. Any fresh discoveries in oil or gas will be a further positive. We have built in 22.91mt /23.48 and 23.08mt oil and condensate production in our FY23F/24F/25F earnings estimates, respectively.

Reiterate Add rating on the stock

Oil India

Treads the path of increasing production

■   Oil India is an undervalued stock in India’s energy sector. Government policy uncertainty led to a severe derating of the stock.

■   Recent government actions indicate that Oil India can make US$65-70/bbl realization, and we build in US$65/bbl in our earnings estimates.

■   The stock trades at 3.8x FY23F EPS with a dividend yield of 7.5%. With long-term crude oil prices to remain in an uptrend, Oil India is an attractive value pick.  Retain Add rating.

Brent crude oil prices unlikely to fall below US$80-85/bbl

Geopolitics, lack of investment in oil assets, dwindling strategic petroleum reserves (SPR) as well as the Organization of the Petroleum Exporting Countries or OPEC’s own financial condition indicates that Brent crude oil prices are unlikely to remain below US$80-85/bbl for a long time. Hence, the odds are in favour of Oil India. Media frenzy and unwarranted investor activism has led to a steep decline in investment in oil assets. Companies are delivering fat dividends, but not investing enough. In fact, Saudi Arabia’s oil major Aramco in its 1HCY22 presentation said that given the current rate of investments, global crude oil production capacity can decline to ~95mbbl by 2025F. There isn’t going to be any revolution in clean energy by that time and hence, crude oil prices will rise. In between, there can be many factors like release of SPR, US President Joe Biden’s statements and what not, but the trajectory for crude oil is up from this level.

Oil India presents attractive opportunity to play crude oil Bull cycle

While government policy will always remain an overhang and hence the full value of the stock may never be realized, recent/past events indicate that government is happy letting Oil India make around US$65-70/bbl.  Oil India is investing in oil exploration but to be on the conservative side, we have valued only the proven reserves of the state-owned company. Any fresh discoveries in oil or gas will be a further positive. We have built in 22.91mt /23.48 and 23.08mt oil and condensate production in our FY23F/24F/25F earnings estimates, respectively.

Reiterate Add rating on the stock

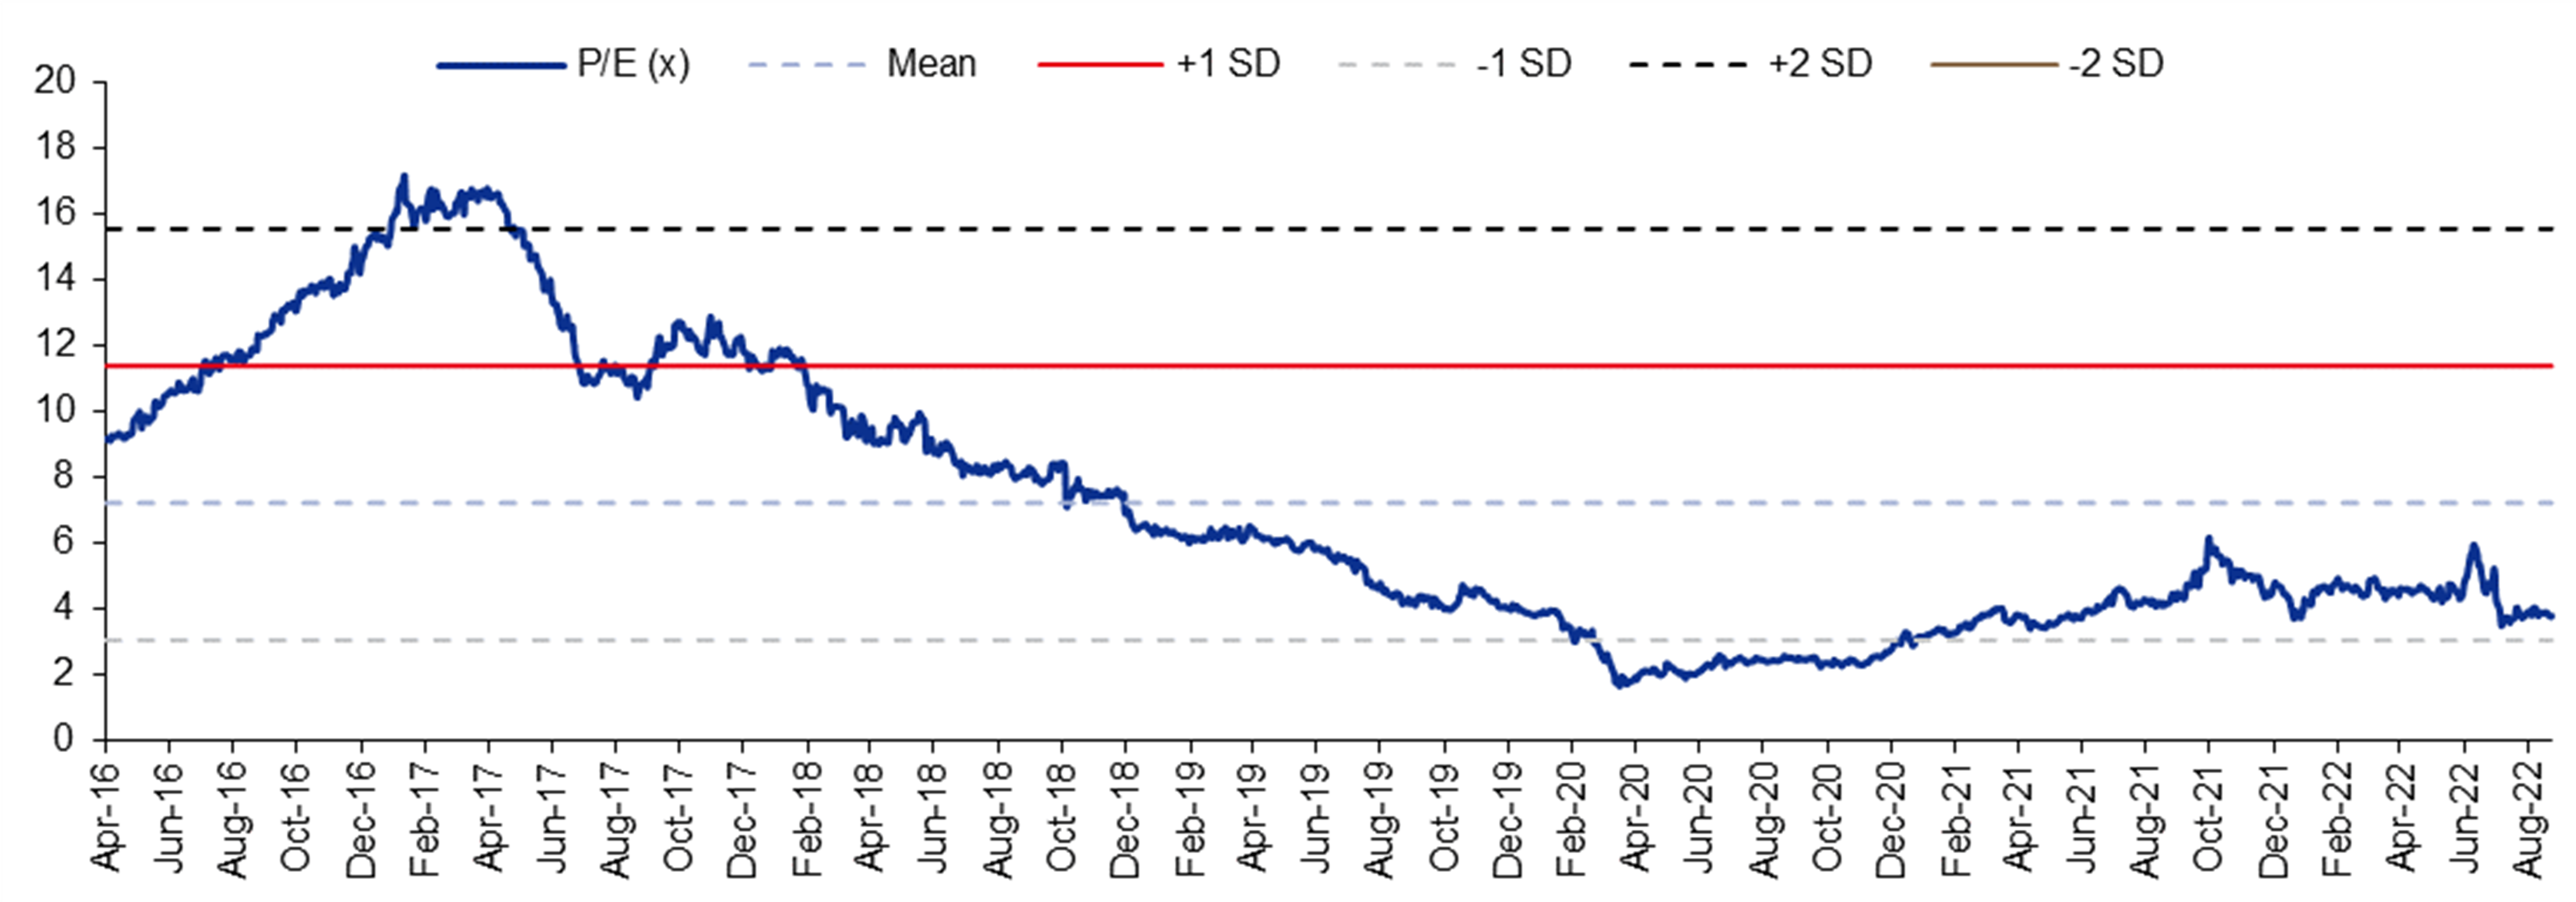
We reiterate Add rating on Oil India with a slightly lower target price of Rs261 (from Rs265 earlier). We have used the following assumptions to value the stock: 1) We are bullish on crude oil and see Brent crude price staying still at its current US$100/bbl level and with the incorporation of windfall tax, we have assumed long-term realization of US$65/bbl. 2) Numaligarh Refinery or NRL has shown  robust earnings, doubling its quarterly numbers on a yoy basis, and we believe gross refining margin or GRM will remain near US$17-25/bbl. 3) Oil India’s one-year forward P/E trades at 3.8x against the historical average of 7.2x. Downside risk to our estimates and target price is the complete collapse of crude oil price to below US$60/bbl and NRL’s GRM slipping below US$10/bbl.

Financial Summary   

Mar-21A

Mar-22A

Mar-23F

Mar-24F

Mar-25F

Revenue (Rsm)

176,295

217,899

349,381

342,377

355,644

Operating EBITDA (Rsm)

57,533

105,004

120,968

110,302

117,146

Net Profit (Rsm)

35,279

56,319

67,004

61,721

59,173

Core EPS (Rs)

32.5

51.9

61.8

56.9

54.6

Core EPS Growth

(25.0%)

59.6%

19.0%

(7.9%)

(4.1%)

FD Core P/E (x)

5.68

3.56

2.99

3.25

3.39

DPS (Rs)

5.0

12.0

14.0

12.0

12.0

Dividend Yield

2.70%

6.49%

7.57%

6.49%

6.49%

EV/EBITDA (x)

2.37

1.10

1.35

1.95

2.24

P/FCFE (x)

(16.70)

14.57

21.30

7.44

6.28

Net Gearing

64.1%

42.6%

47.6%

53.5%

56.3%

P/BV (x)

0.85

0.72

0.62

0.55

0.48

ROE

15.1%

21.9%

22.3%

17.9%

15.1%

% Change In Core EPS Estimates


25.33%

42.11%


InCred Research/Consensus EPS (x)


SOURCE: INCRED RESEARCH, COMPANY REPORTS

Treads the path of increasing production

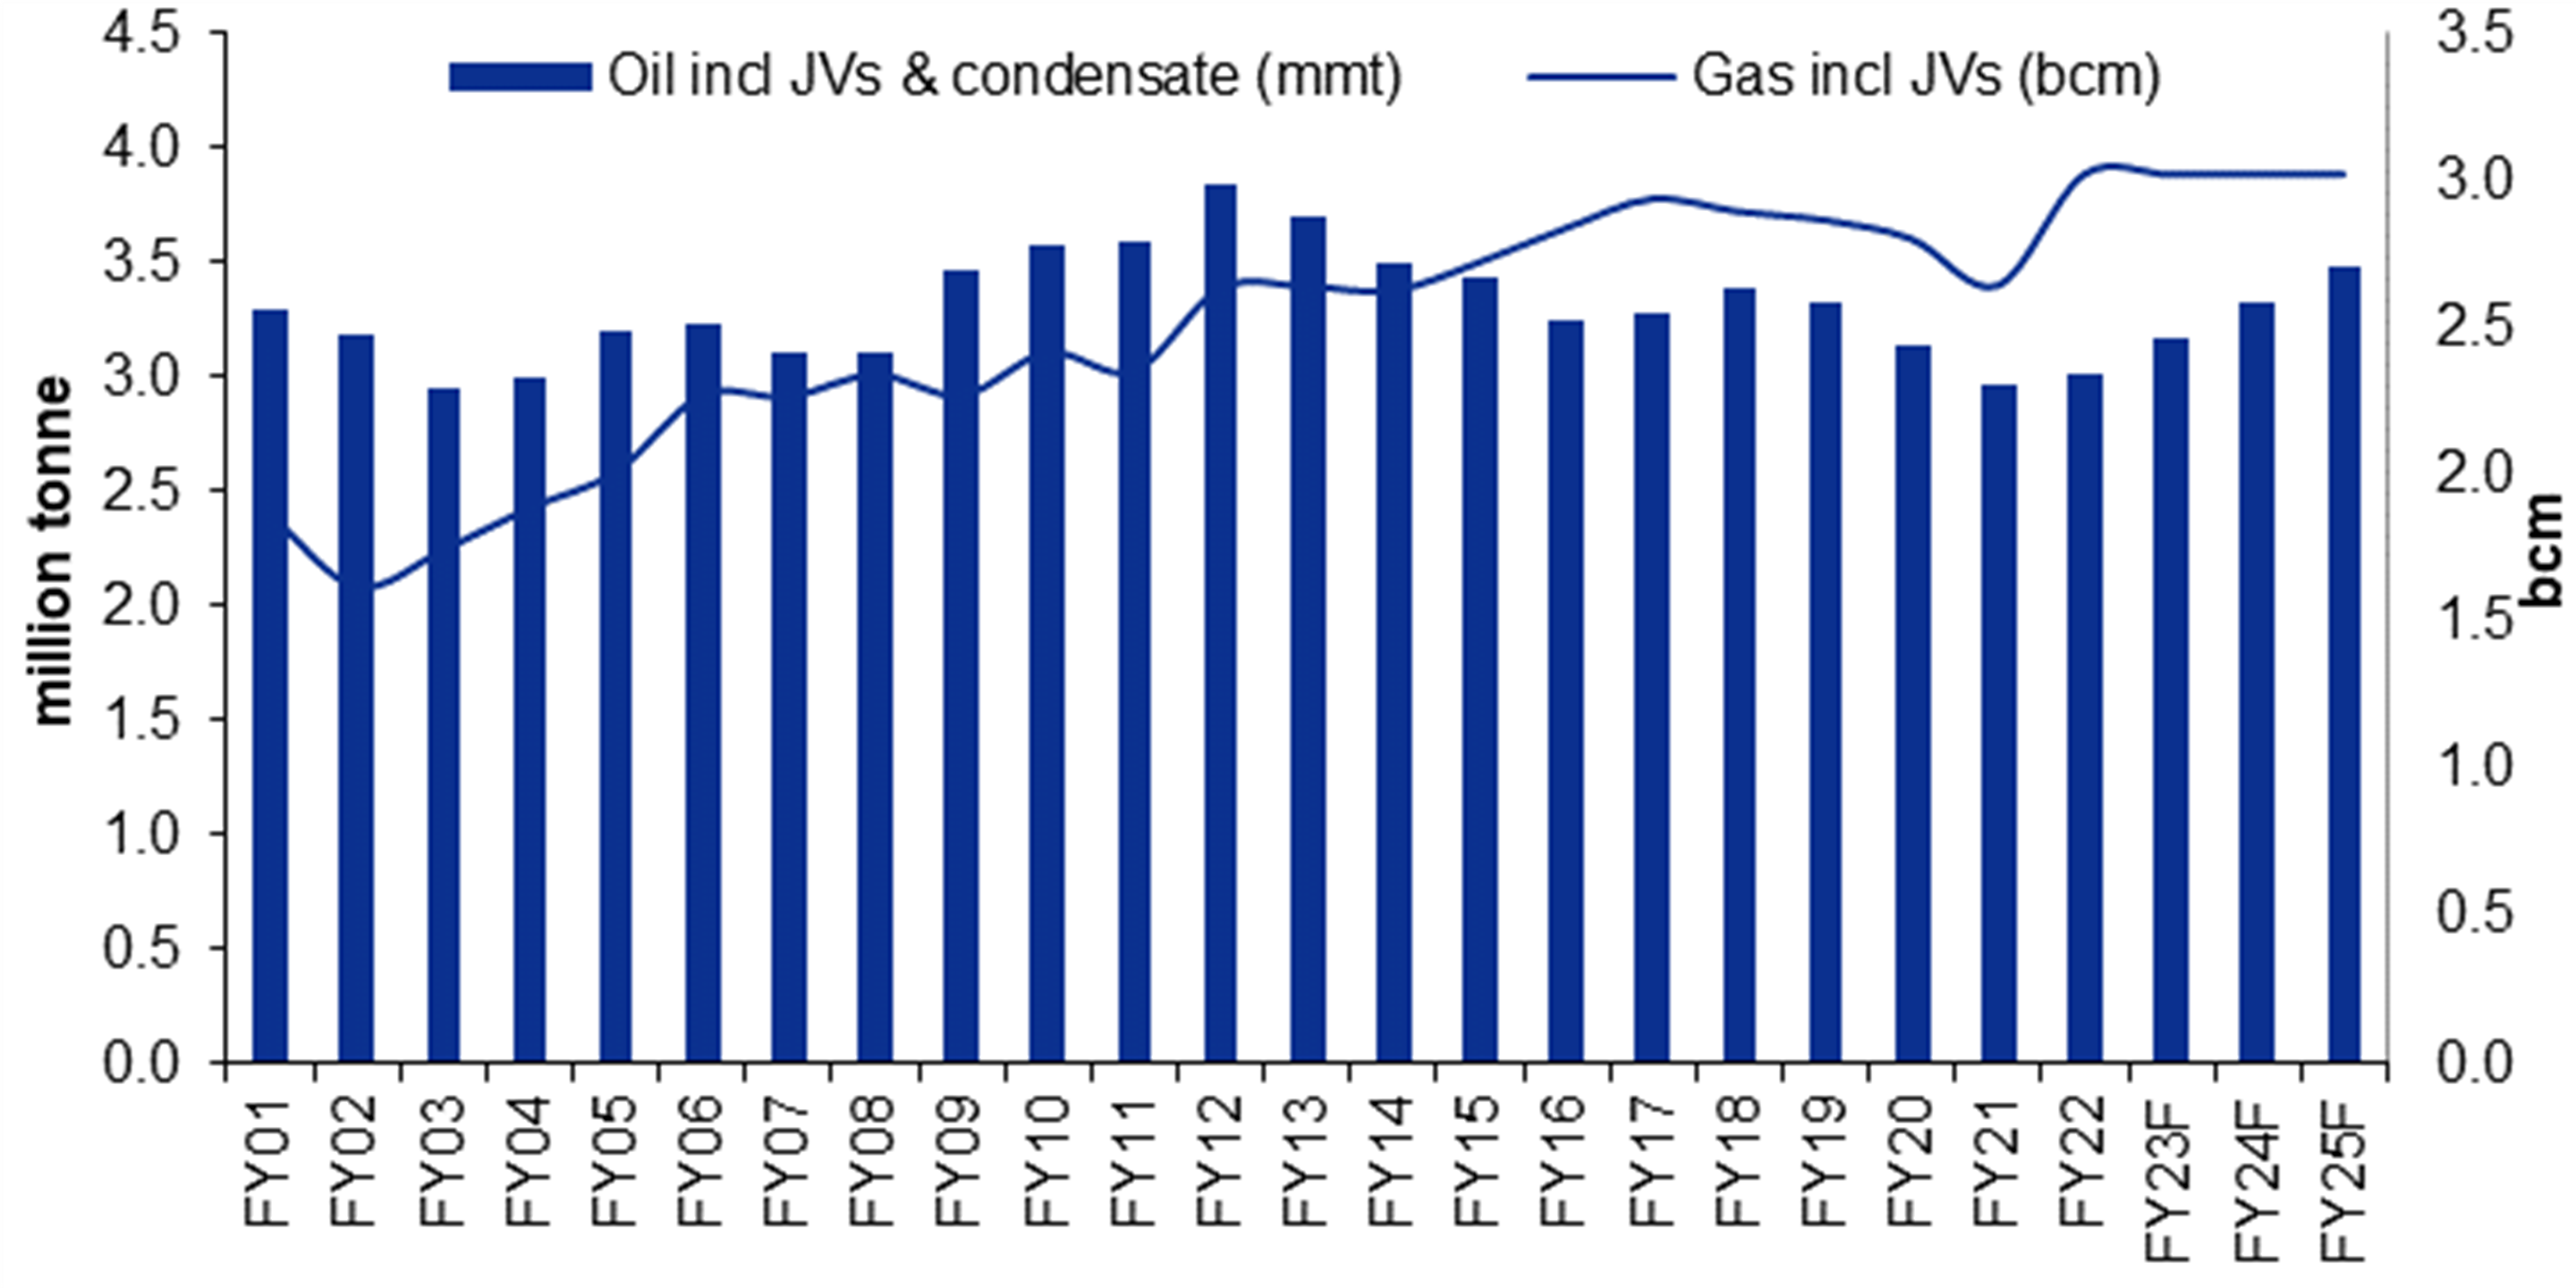
Oil India’s oil & gas production to remain steady

Oil India has seen a significant rise in gas production and oil output. We expect the company’s oil production to stay around 3-3.2mt and gas production to remain steady at 2.5-2.8bcm. Oil India’s target oil production is 4.1mt and gas output at around 5bcm by FY24F-25F. However, we are not building in any new oil source in our production estimates.  

Planned capex at Rs43bn, of which Rs12bn invested in
1QFY23

Approx US$25-30/bbl will be impacted in realization due to windfall tax and our assumption of Brent crude oil price unlikely to slip below US$80-85/bbl. We expect the trend will continue to remain around US$95-100/bbl, which leads to a realization of US$65/bbl on a long-term basis. Downside risk occurs only when crude oil price and GRM collapse below US$60/bbl and US$10/bbl, respectively, which is unlikely to happen.

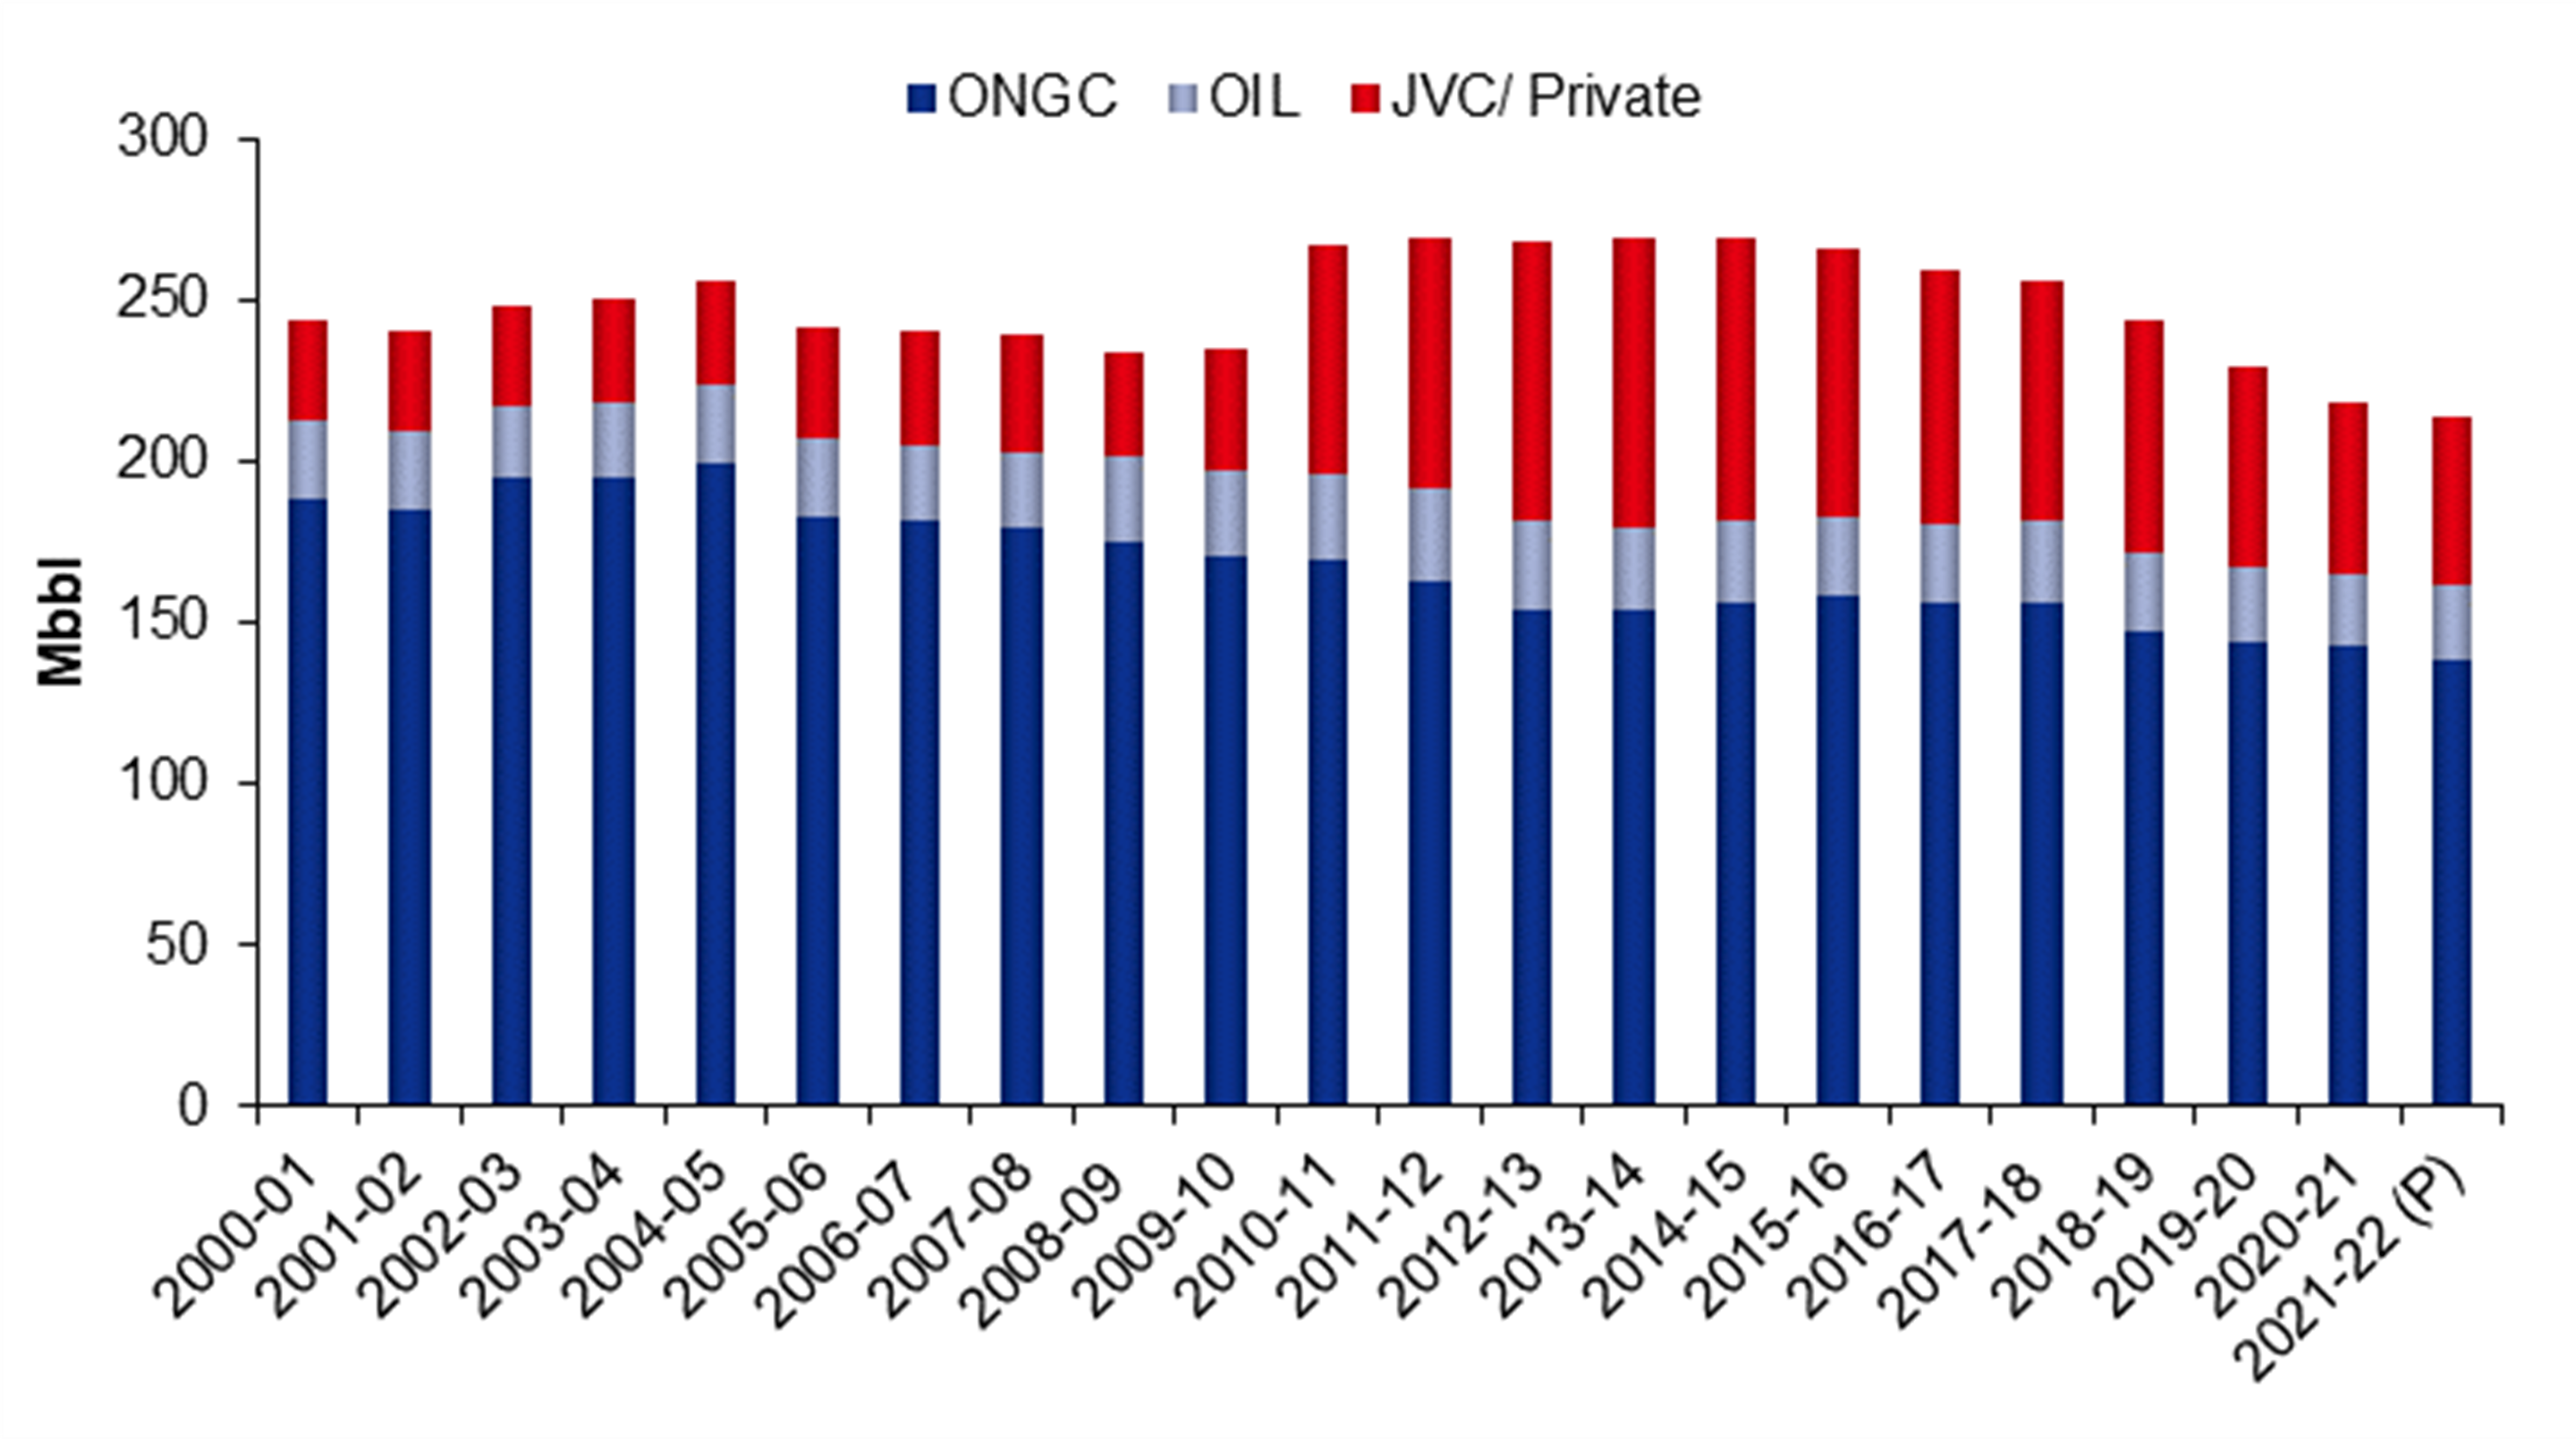
Capex to drive the increase  in  oil and gas production of parent company

Figure 40: We expect Oil India’s oil & gas production to remain steady

SOURCE: INCRED RESEARCH, COMPANY REPORTS

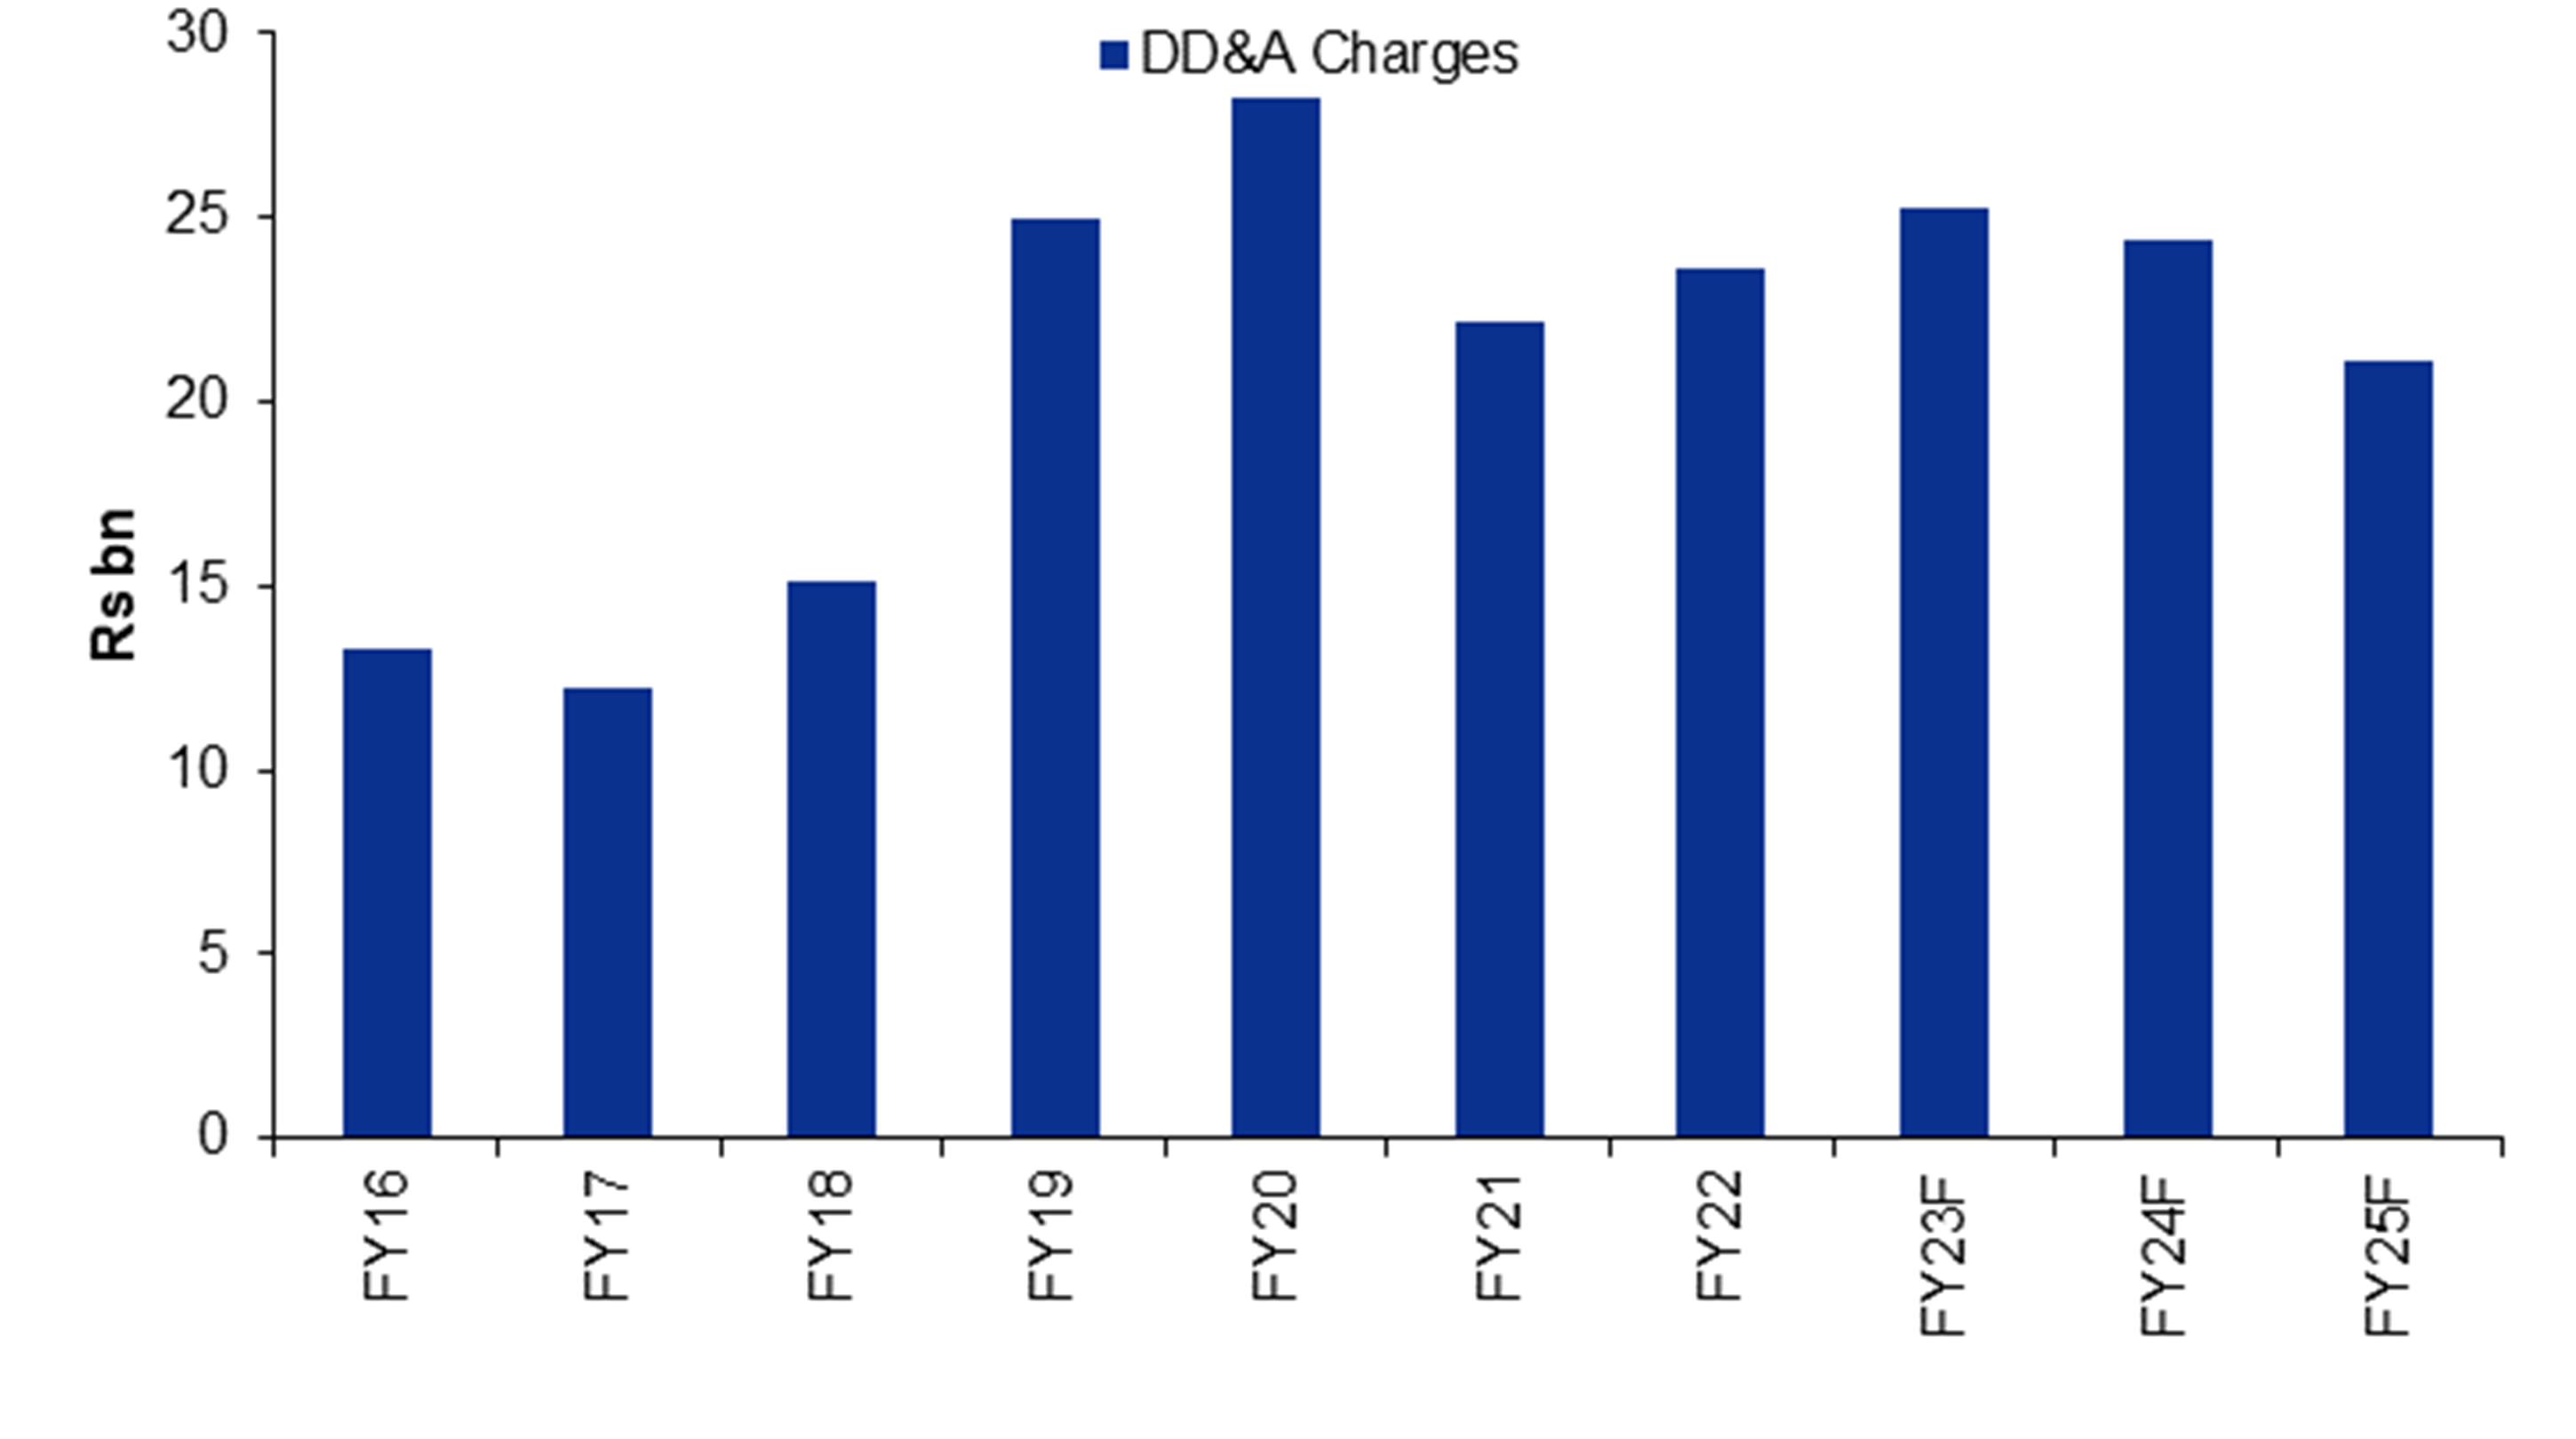
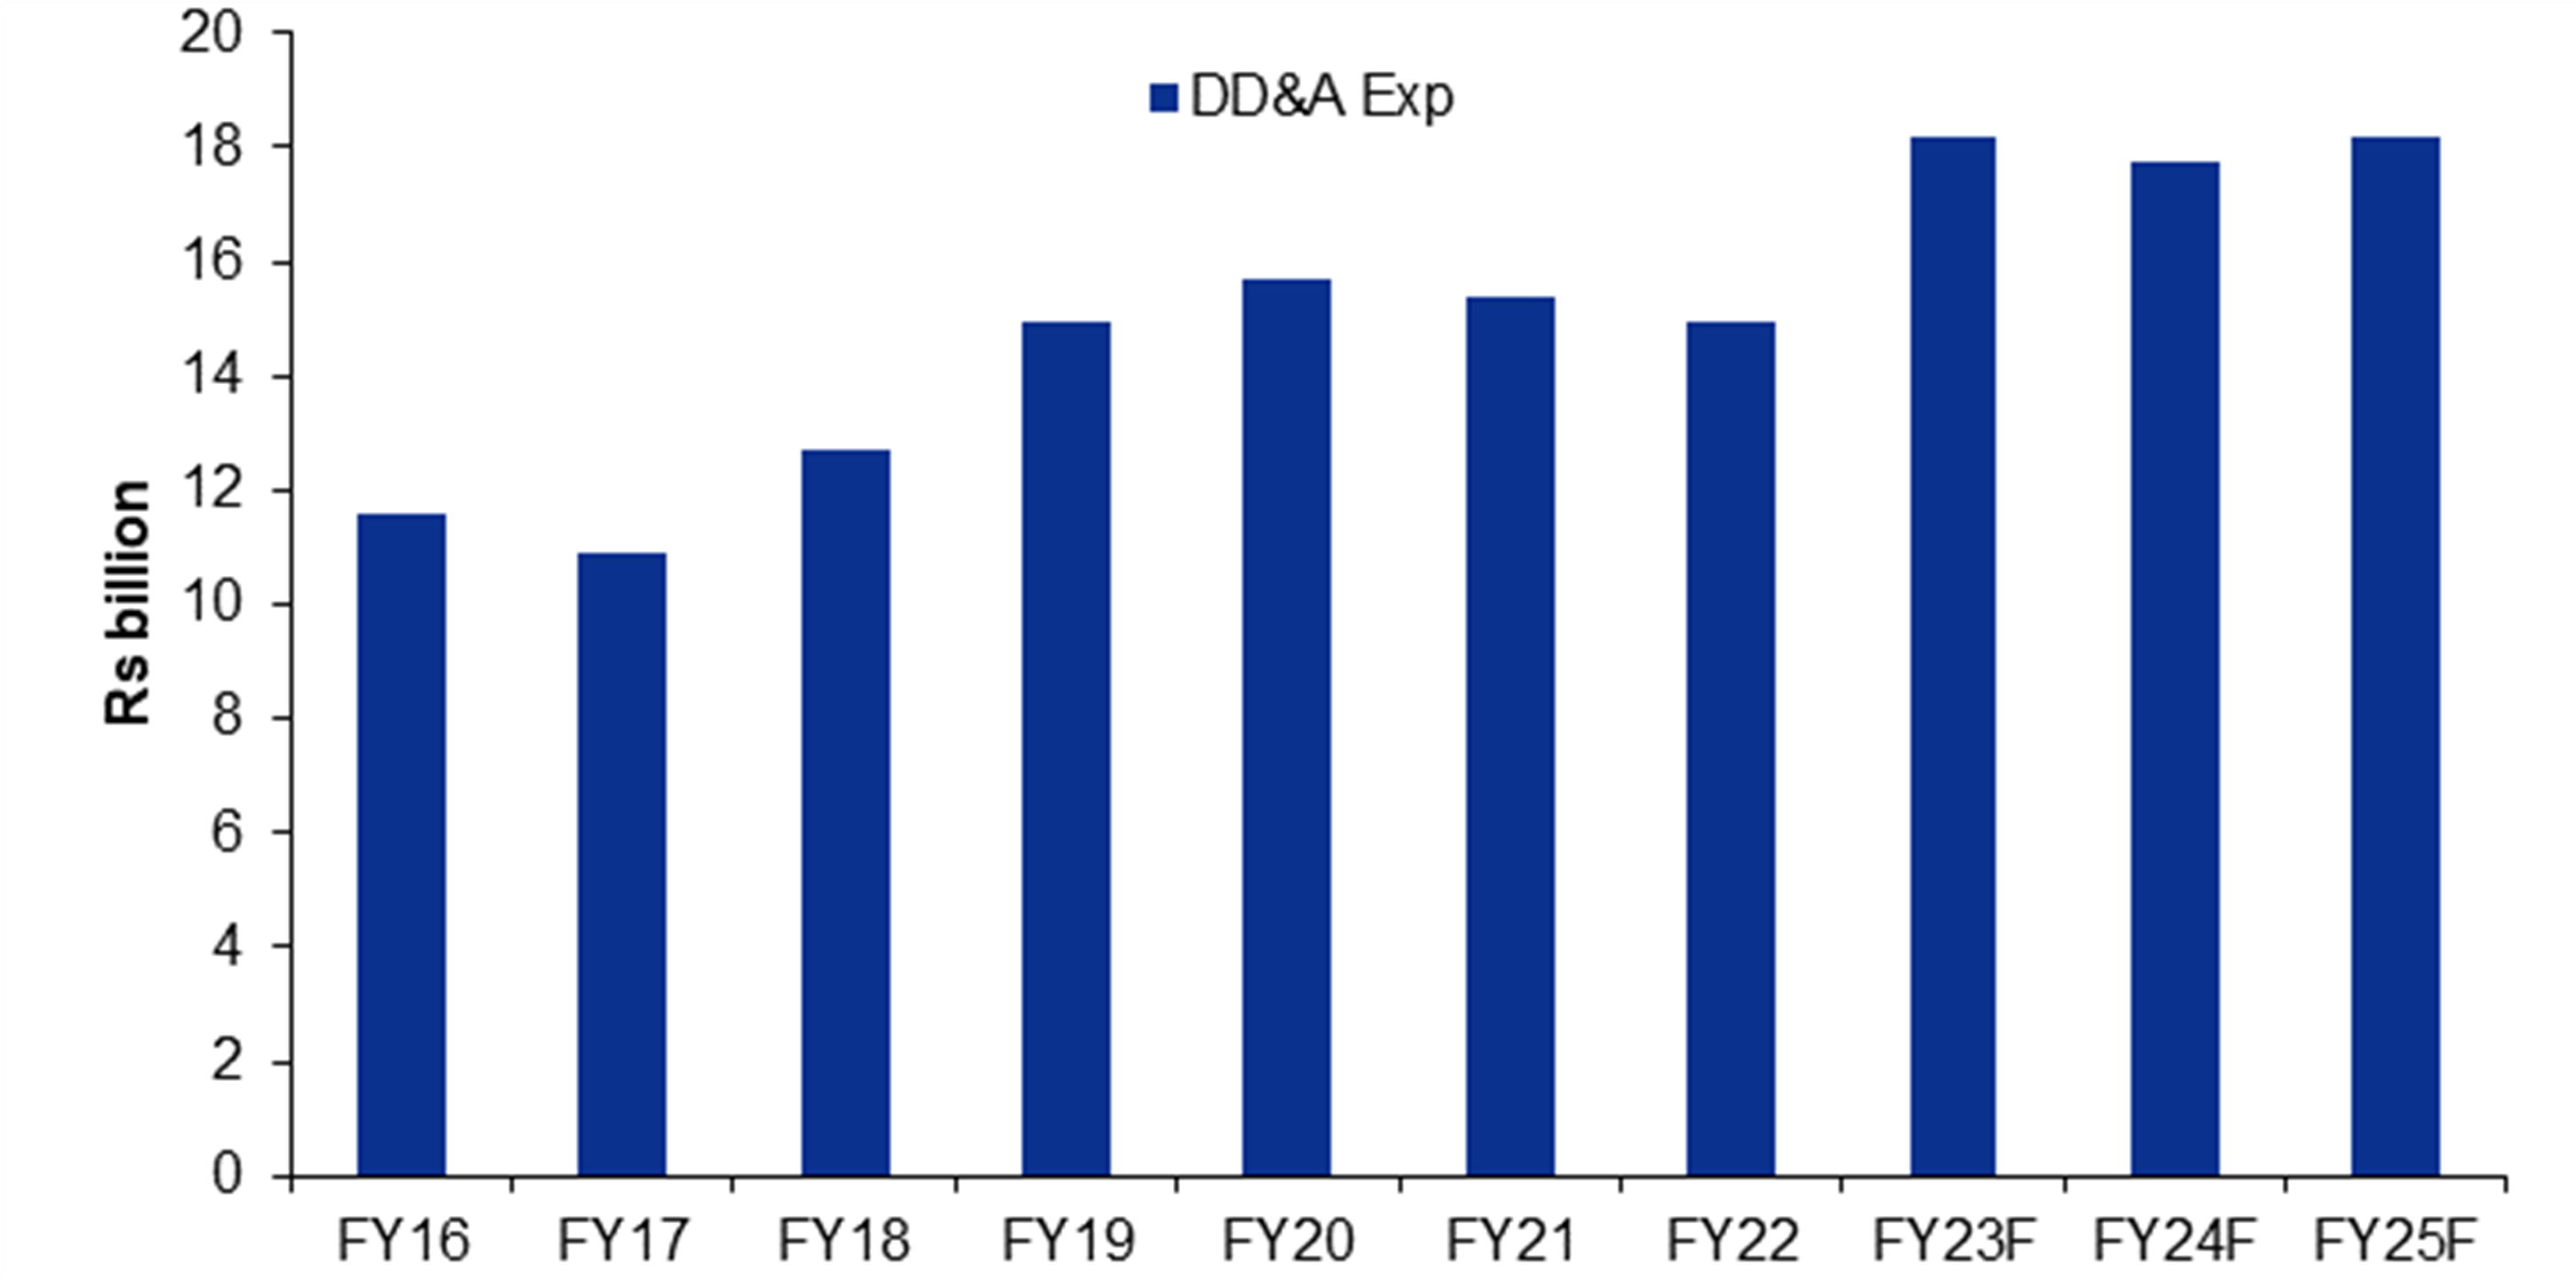
Expect a rise in DD&A expenditure going ahead

Figure 41: DD&A expenditure to increase going ahead

SOURCE: COMPANY REPORTS, INCRED RESEARCH


Incremental oil volume will be able to garner full spot price

As per the Government of India or GoI’s notification, incremental oil production over FY22 will not be subject to windfall tax cut and hence, incremental volume over FY22 will be able to garner full realization of US$80/bbl.

We believe NRL’s core GRM will continue to remain around US$17-20/bbl level

Market doesn’t feel the current GRM will sustain as the present scenario never occurred in last 50 years, but we believe it will sustain for next three years and the GRM will continue to remain at US$17-20/bbl level for the next three-to-four years. However, there are multiple factors which will keep GRM on a strong mode.

GoI has imposed export tax on gasoline, diesel, and ATF (aviation turbine fuel). The tax will impact diesel the most, and Indian refiners are one of the biggest producers of diesel in global market.

We believe the decline in Russian crude oil pumping to Europe has impacted the CIS and Europe naphtha demand by 7%. Naphtha normally trades at par with crude oil and, in our view, when it bounces back to being at par with crude oil, it will add US$2/bbl to GRM of Indian companies.

In a below-par equity internal rate of return or IRR (8%) scenario, a basic complexity refinery needs US$16-17/bbl GRM. While it’s a consensus fact that global refinery capacity is in shortage, many question the sustainability of GRM and what is the optimal level of GRM. We have tried to answer this question by assuming 8% project IRR scenario.

Valuation and analysis

Figure 42: One-year forward P/E trades at 3.8x FY23F

SOURCE: INCRED RESEARCH, COMPANY REPORTS


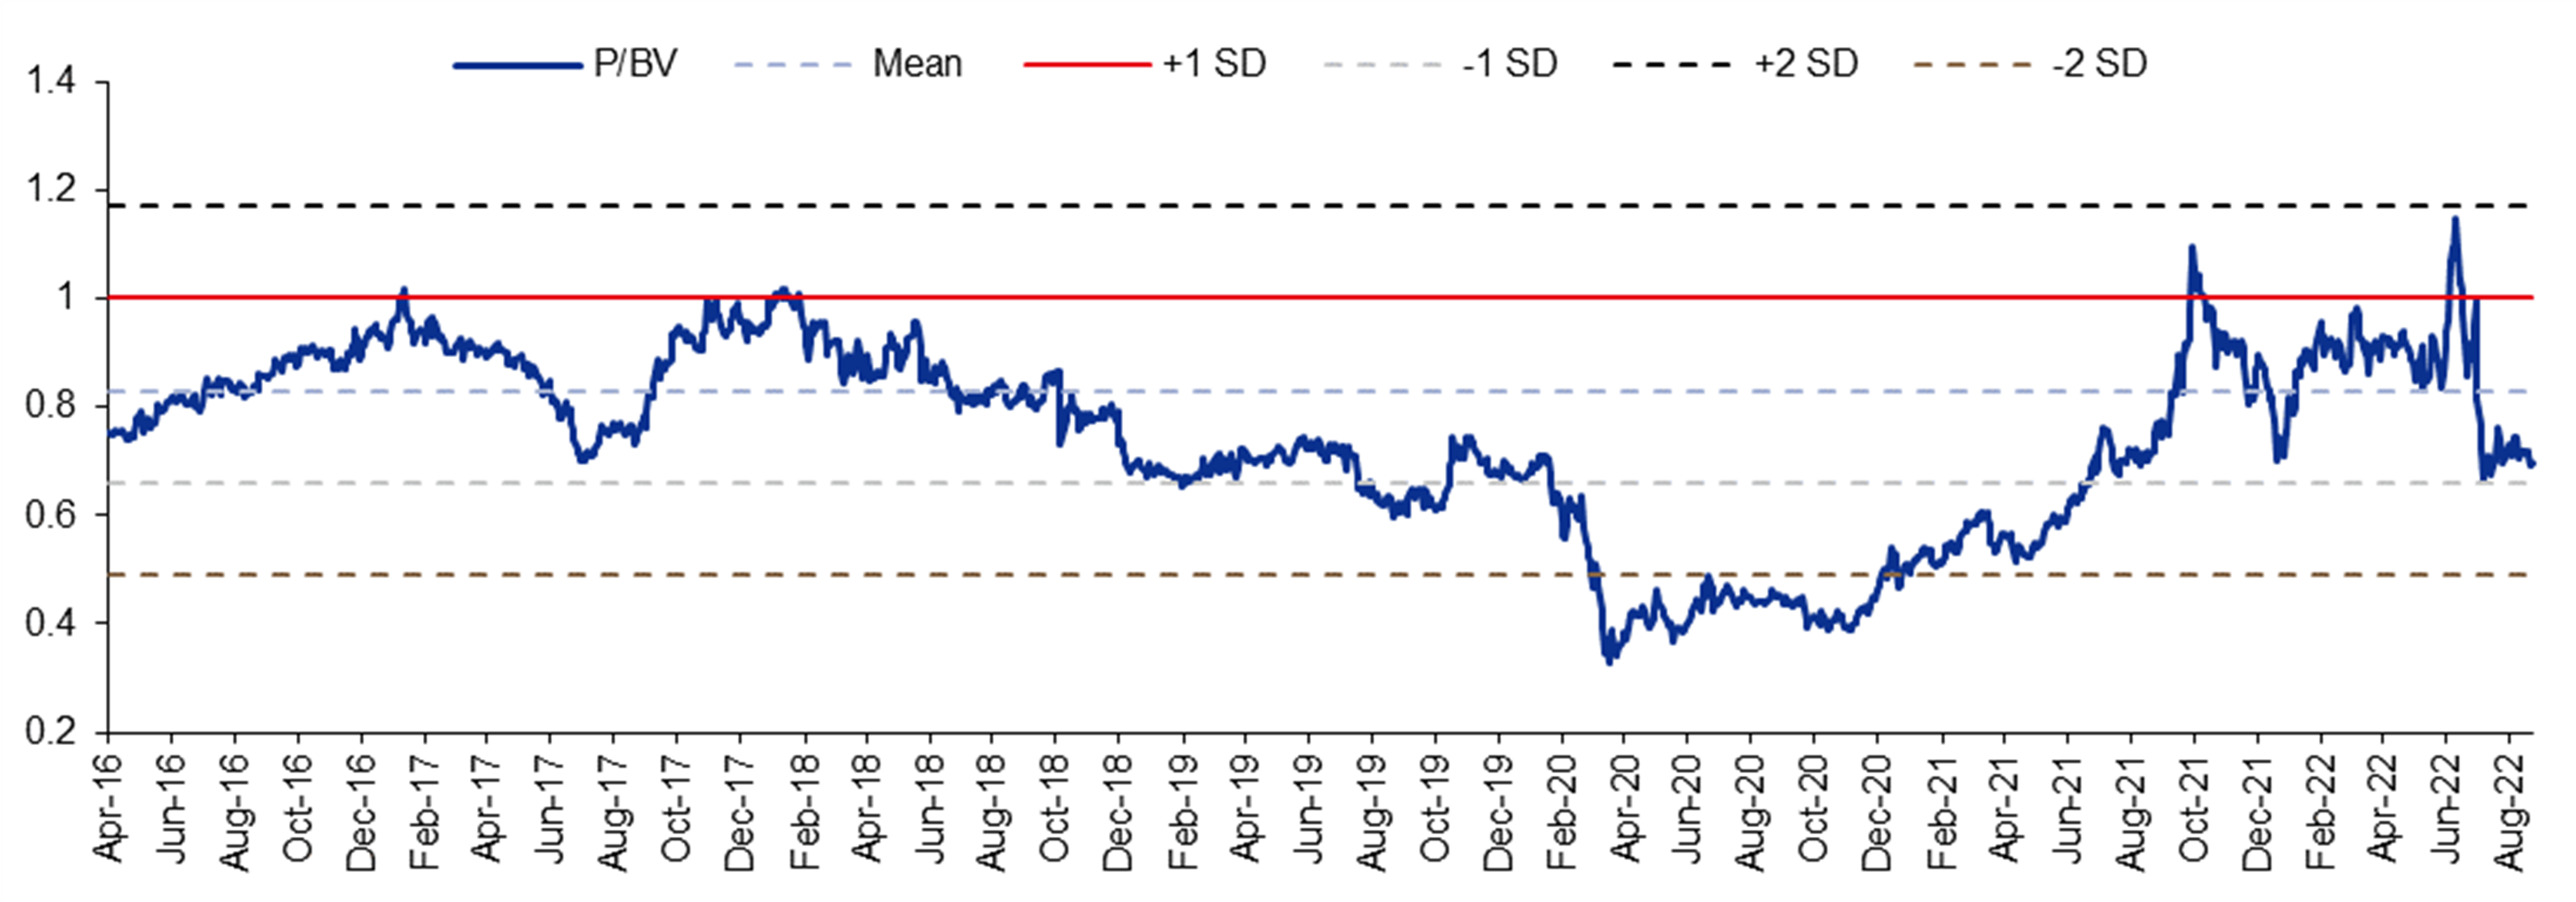
Figure 43: One-year forward P/BV trades at 0.7x FY23F

SOURCE: INCRED RESEARCH, COMPANY REPORTS


Figure 44: We have valued Oil India on net present value or NPV basis with a target price of Rs261

Rsm

Rs/share

DCF value of domestic proved reserves

2,72,125

251

Net cash

-1,29,343

-119

NRL stake at BV (Rs/share)

77,812

72

IOC stake at discounted market value

44,190

41

Mozambique valuation

18,080

17

Russian acquisitions - at cost

0

0

Total

2,82,864

261

SOURCE: INCRED RESEARCH, COMPANY REPORTS

1) We see Brent crude oil price staying still and trading not lesser than US$65-$70/bbl. We have assumed US$65/bbl long-term realization for Oil India even as our Brent crude oil price assumption remains at US$65/bbl vs. spot Brent price of US$97/bbl.

Downside risk to our estimates and target price is the complete collapse of crude oil price to below US$60/bbl and NRL’s GRM slipping below US$10/bbl.


BY THE NUMBERS 


Profit & Loss 

(Rs mn)   

Mar-21A

Mar-22A

Mar-23F

Mar-24F

Mar-25F

Total Net Revenues

176,295

217,899

349,381

342,377

355,644

Gross Profit

74,562

116,421

132,953

122,266

129,100

Operating EBITDA

57,533

105,004

120,968

110,302

117,146

Depreciation And Amortisation

(18,954)

(18,245)

(21,074)

(20,642)

(21,168)

Operating EBIT

38,579

86,759

99,894

89,660

95,978

Financial Income/(Expense)

(6,605)

(9,401)

(8,694)

(8,006)

(8,006)

Pretax Income/(Loss) from Assoc.


Non-Operating Income/(Expense)

6,431

11,426

8,814

8,970

9,040

Profit Before Tax (pre-EI)

38,405

88,784

100,014

90,625

97,012

Exceptional Items


Pre-tax Profit

38,405

88,784

100,014

90,625

97,012

Taxation

(2,227)

(22,710)

(27,078)

(24,661)

(26,270)

Exceptional Income - post-tax


Profit After Tax

36,178

66,074

72,936

65,964

70,742

Minority Interests

(6,181)

(10,873)

(13,478)

(10,974)

(11,568)

Preferred Dividends


FX Gain/(Loss) - post tax


Other Adjustments - post-tax

5,282

1,119

7,546

6,731


Net Profit

35,279

56,319

67,004

61,721

59,173

Recurring Net Profit

35,279

56,319

67,004

61,721

59,173

Fully Diluted Recurring Net Profit

35,279

56,319

67,004

61,721

59,173


Cash Flow 

(Rs mn)     

Mar-21A

Mar-22A

Mar-23F

Mar-24F

Mar-25F

EBITDA

57,533

105,004

120,968

110,302

117,146

Cash Flow from Invt. & Assoc.

6,431

11,426

8,814

8,970

9,040

Change In Working Capital

(95,695)

9,333

(6,328)

(6,580)

(8,106)

(Incr)/Decr in Total Provisions


Other Non-Cash (Income)/Expense

2,272

(342)

215

196

208

Other Operating Cashflow

(7,131)

934

343

1,065

1,065

Net Interest (Paid)/Received

(6,605)

(9,401)

(8,694)

(8,006)

(8,006)

Tax Paid

(436)

(24,201)

(26,863)

(24,465)

(26,062)

Cashflow From Operations

(43,631)

92,752

88,455

81,482

85,286

Capex

(37,967)

(59,540)

(115,540)

(115,540)

(115,540)

Disposals Of FAs/subsidiaries


Acq. Of Subsidiaries/investments

2,963

(5,301)

(5,700)

(6,200)

(5,000)

Other Investing Cashflow


Cash Flow From Investing

(35,004)

(64,841)

(121,240)

(121,740)

(120,540)

Debt Raised/(repaid)

66,627

(14,147)

42,200

67,200

67,200

Proceeds From Issue Of Shares


Shares Repurchased


Dividends Paid

(20,472)

(11,657)

(15,127)

(13,447)

(13,013)

Preferred Dividends


Other Financing Cashflow


Cash Flow From Financing

46,155

(25,804)

27,073

53,753

54,187

Total Cash Generated

(32,480)

2,107

(5,713)

13,495

18,933

Free Cashflow To Equity

(12,008)

13,764

9,415

26,942

31,946

Free Cashflow To Firm

(72,030)

37,313

(24,092)

(32,252)

(27,248)

SOURCE: INCRED RESEARCH, COMPANY REPORTS


BY THE NUMBERS…cont’d


Balance Sheet 

(Rs mn)   

Mar-21A

Mar-22A

Mar-23F

Mar-24F

Mar-25F

Total Cash And Equivalents

34,980

50,570

50,338

68,679

92,435

Total Debtors

18,556

22,317

22,807

22,372

23,390

Inventories

32,216

38,275

38,211

38,859

39,894

Total Other Current Assets

40,089

27,278

33,858

40,438

47,018

Total Current Assets

125,841

138,440

145,214

170,348

202,738

Fixed Assets

182,078

211,736

299,217

387,152

474,569

Total Investments

234,904

240,205

245,905

252,105

257,105

Intangible Assets


Total Other Non-Current Assets


Total Non-current Assets

416,982

451,941

545,122

639,257

731,674

Short-term Debt

43,005

25,001

1

1

1

Current Portion of Long-Term Debt


Total Creditors

61,477

68,617

69,295

69,507

70,035

Other Current Liabilities


Total Current Liabilities

104,482

93,617

69,295

69,508

70,035

Total Long-term Debt

151,055

154,913

222,113

289,313

356,513

Hybrid Debt - Debt Component


Total Other Non-Current Liabilities


Total Non-current Liabilities

151,055

154,913

222,113

289,313

356,513

Total Provisions

39,189

38,049

38,264

38,460

38,668

Total Liabilities

294,726

286,579

329,672

397,280

465,216

Shareholders Equity

236,664

277,646

323,578

366,722

414,483

Minority Interests

11,433

26,156

37,087

45,603

54,713

Total Equity

248,097

303,802

360,664

412,325

469,196


Key Ratios 


Mar-21A

Mar-22A

Mar-23F

Mar-24F

Mar-25F

Revenue Growth

(5.3%)

23.6%

60.3%

(2.0%)

3.9%

Operating EBITDA Growth

5.9%

82.5%

15.2%

(8.8%)

6.2%

Operating EBITDA Margin

32.6%

48.2%

34.6%

32.2%

32.9%

Net Cash Per Share (Rs)

(146.70)

(119.28)

(158.41)

(203.46)

(243.52)

BVPS (Rs)

218.24

256.04

298.39

338.18

382.22

Gross Interest Cover

5.84

9.23

11.49

11.20

11.99

Effective Tax Rate

5.8%

25.6%

27.1%

27.2%

27.1%

Net Dividend Payout Ratio

15.4%

23.1%

22.7%

21.1%

22.0%

Accounts Receivables Days

34.76

34.23

23.57

24.08

23.48

Inventory Days

112.75

126.77

64.50

63.90

63.44

Accounts Payables Days

370.86

233.96

116.29

115.08

112.41

ROIC (%)

13.6%

28.1%

23.0%

16.0%

13.9%

ROCE (%)

10.3%

19.8%

19.2%

14.6%

13.2%

Return On Average Assets

8.4%

13.1%

13.6%

10.5%

8.8%

SOURCE: INCRED RESEARCH, COMPANY REPORTS


DISCLAIMER

This report (including the views and opinions expressed therein, and the information comprised therein) has been prepared by Incred Research Services Private Ltd.(formerly known as Earnest Innovation Partners Private Limited) (hereinafter referred to as “ IRSPL”). IRSPL is registered with SEBI as a Research Analyst vide Registration No. INH000007793. Pursuant to a trademark agreement, IRSPL has adopted “Incred Equities ” as its trademark for use in this report.

The term “IRSPL” shall, unless the context otherwise requires, mean IRSPL and its affiliates, subsidiaries and related companies. This report is not directed or intended for distribution to or use by any person or entity resident in a state, country or any jurisdiction, where such distribution, publication, availability or use would be contrary to law, regulation or which would subject IRSPL and its affiliates/group companies to registration or licensing requirements within such jurisdictions.

This report is being supplied to you strictly on the basis that it will remain confidential. No part of this report may be (i) copied, photocopied, duplicated, stored or reproduced in any form by any means; or (ii) redistributed or passed on, directly or indirectly, to any other person in whole or in part, for any purpose without the prior written consent of IRSPL.

The information contained in this report is prepared from data believed to be correct and reliable at the time of issue of this report.

IRSPL is not required to issue regular reports on the subject matter of this report at any frequency and it may cease to do so or change the periodicity of reports at any time. IRSPL is not under any obligation to update this report in the event of a material change to the information contained in this report. IRSPL has not any and will not accept any, obligation to (i) check or ensure that the contents of this report remain current, reliable or relevant; (ii) ensure that the content of this report constitutes all the information a prospective investor may require; (iii) ensure the adequacy, accuracy, completeness, reliability or fairness of any views, opinions and information, and accordingly, IRSPL and its affiliates/group companies (and their respective directors, associates, connected persons and/or employees) shall not be liable in any manner whatsoever for any consequences (including but not limited to any direct, indirect or consequential losses, loss of profits and damages) of any reliance thereon or usage thereof.

Unless otherwise specified, this report is based upon reasonable sources. Such sources will, unless otherwise specified, for market data, be market data and prices available from the main stock exchange or market where the relevant security is listed, or, where appropriate, any other market. Information on the accounts and business of company(ies) will generally be based on published statements of the company(ies), information disseminated by regulatory information services, other publicly available information and information resulting from our research. Whilst every effort is made to ensure that statements of facts made in this report are accurate, all estimates, projections, forecasts, expressions of opinion and other subjective judgments contained in this report are based on assumptions considered to be reasonable as of the date of the document in which they are contained and must not be construed as a representation that the matters referred to therein will occur. Past performance is not a reliable indicator of future performance. The value of investments may go down as well as up and those investing may, depending on the investments in question, lose more than the initial investment. No report shall constitute an offer or an invitation by or on behalf of IRSPL and its affiliates/group companies to any person to buy or sell any investments.

The opinions expressed are based on information which are believed to be accurate and complete and obtained through reliable public or other non-confidential sources at the time made. (Information barriers and other arrangements may be established where necessary to prevent conflicts of interests arising. However, the analyst(s) may receive compensation that is based on his/their coverage of company(ies) in the performance of his/their duties or the performance of his/their recommendations. In reviewing this report, an investor should be aware that any or all of the foregoing, among other things, may give rise to real or potential conflicts of interest. Additional information is, subject to the duties of confidentiality, available on request.

The report is not a “prospectus” as defined under Indian Law, including the Companies Act, 2013, and is not, and shall not be, approved by, or filed or registered with, any Indian regulator, including any Registrar of Companies in India, SEBI, any Indian stock exchange, or the Reserve Bank of India. No offer, or invitation to offer, or solicitation of subscription with respect to any such securities listed or proposed to be listed in India is being made, or intended to be made, to the public, or to any member or section of the public in India, through or pursuant to this report.

The research analysts, strategists or economists principally responsible for the preparation of this research report are segregated from the other activities of IRSPL. Information barriers and other arrangements have been established, as required, to prevent any conflicts of interests.

The research analysts, strategists or economists principally responsible for the preparation of this research report are segregated from the other activities of IRSPL. Information barriers and other arrangements have been established, as required, to prevent any conflicts of interests.

IRSPL may have issued other reports (based on technical analysis, event specific, short term views etc.) that are inconsistent with and reach different conclusion from the information presented in this report.

Holding of Analysts/Relatives of Analysts, IRSPL and Associates of IRSPL in the covered securities, as on the date of publishing of this report

Analyst/ Relative Entity/ Associates
any financial interests in the company covered in this report (subject company) and nature of such financial interest NO NO
actual/beneficial ownership of 1% or more in securities of the subject company at the end of the month immediately preceding the date of publication of the research report or date of the public appearance; NO NO
any other material conflict of interest at the time of publication of the research report or at the time of public appearance NO NO
received any compensation from the subject company in the past twelve months for investment banking or merchant banking or brokerage services or investment advisory or depository or distribution from the subject company in the last twelve months for products/services other than investment banking or merchant banking or broker- age services or investment advisory or depository or distribution from the subject company in the last twelve months NO NO
managed or co-managed public offering of securities for the subject company in the last twelve months NO NO
received any compensation or other benefits from the subject company or third party in connection with the research report NO NO
served as an officer, director or employee of the subject company NO NO
been engaged in market making activity for the subject company NO NO
Analyst declaration
  • The analyst responsible for the production of this report hereby certifies that the views expressed herein accurately and exclusively reflect his or her personal views and opinions about any and all of the issuers or securities analysed in this report and were prepared independently and autonomously in an unbiased manner.
  • No part of the compensation of the analyst(s) was, is, or will be directly or indirectly related to the inclusion of specific recommendations(s) or view(s) in this report or based any specific investment banking transaction.
  • The analyst(s) has(have) not had any serious disciplinary action taken against him/her(them). • The analyst, strategist, or economist does not have any material conflict of interest at the time of
  • publication of this report.
  • The analyst(s) has(have) received compensation based upon various factors, including quality, accuracy and value of research, overall firm performance, client feedback and competitive factors.

IRSPL and/or its affiliates and/or its Directors/employees may own or have positions in securities of the company(ies) covered in this report or any securities related thereto and may from time to time add to or dispose of, or may be materially interested in, any such securities.

IRSPL and/or its affiliates and/or its Directors/employees may do and seek to do business with the company(ies) covered in this research report and may from time to time (a) buy/sell the securities covered in this report, from time to time and/or (b) act as market maker or have assumed an underwriting commitment in securities of such company(ies), and/or (c) may sell them to or buy them from customers on a principal basis and/or (d) may also perform or seek to perform significant investment banking, advisory, underwriting or placement services for or relating to such company(ies) and/or (e) solicit such investment, advisory or other services from any entity mentioned in thisreport and/or (f) act as a lender/borrower to such company and may earn brokerage or other compensation. However, Analysts are forbidden to acquire, on their own account or hold securities (physical or uncertificated, including derivatives) of companies in respect of which they are compiling and producing financial recommendations or in the result of which they play a key part.