* price as on January 01, 0001
India
Consensus ratings*: Buy 26 Hold 10 Sell 3
Previous target: 350
Up/downside: 35.6%
Reuters MMFS.BO
Bloomberg: MMFS IN
Market cap: US$5,400m
Rs392,095m
Average daily turnover: US$14.8m
Current shares o/s: 1,232.3m
Free float: 46.4%
*Source: Bloomberg

Key changes in this note

Our channel check on MMFS indicates its rising focus on customer quality, improved incentive-linked pay structure and increased use of technology.

*Source: Bloomberg

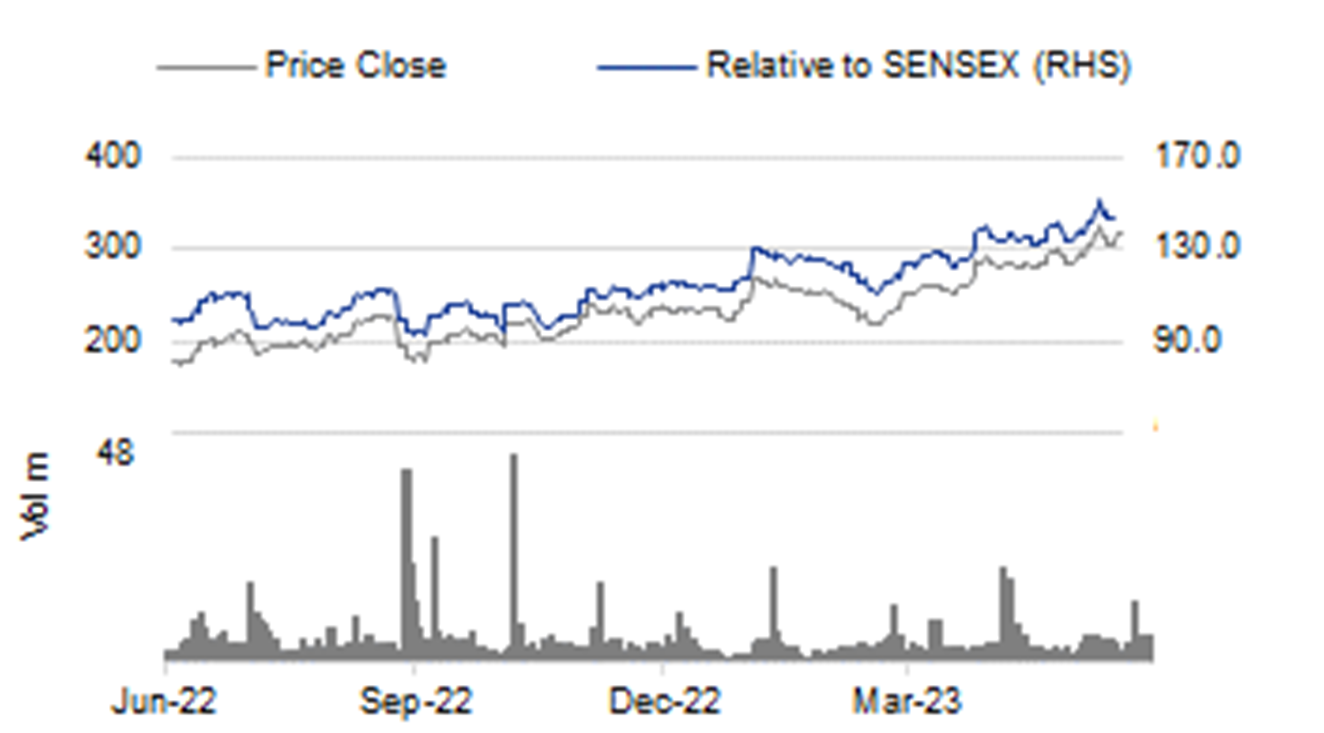
Price performance
1M 3M 12M
Absolute (%) 13.3 43.3 76.1
Relative (%) 11.7 30.2 47.6
Major shareholders
% held
Mahindra & Mahindra 52.0
LIC 6.3
HDFC Life 2.6
Analyst(s)

Jignesh SHIAL

T (91) 22 4161 1547
E jignesh.shial@incredcapital.com

Mayank AGARWAL

T (91) 22 4161 0000
E mayank.agarwal@incredcapital.com

Execution-led turnaround visible on ground

Our ground check with various dealers, DSAs & customers indicate MMFS’s rising focus on better quality customers and increased use of technology.

The visible efforts towards improved sourcing & credit quality will drive granularity in credit costs & reduced earnings volatility in future. 

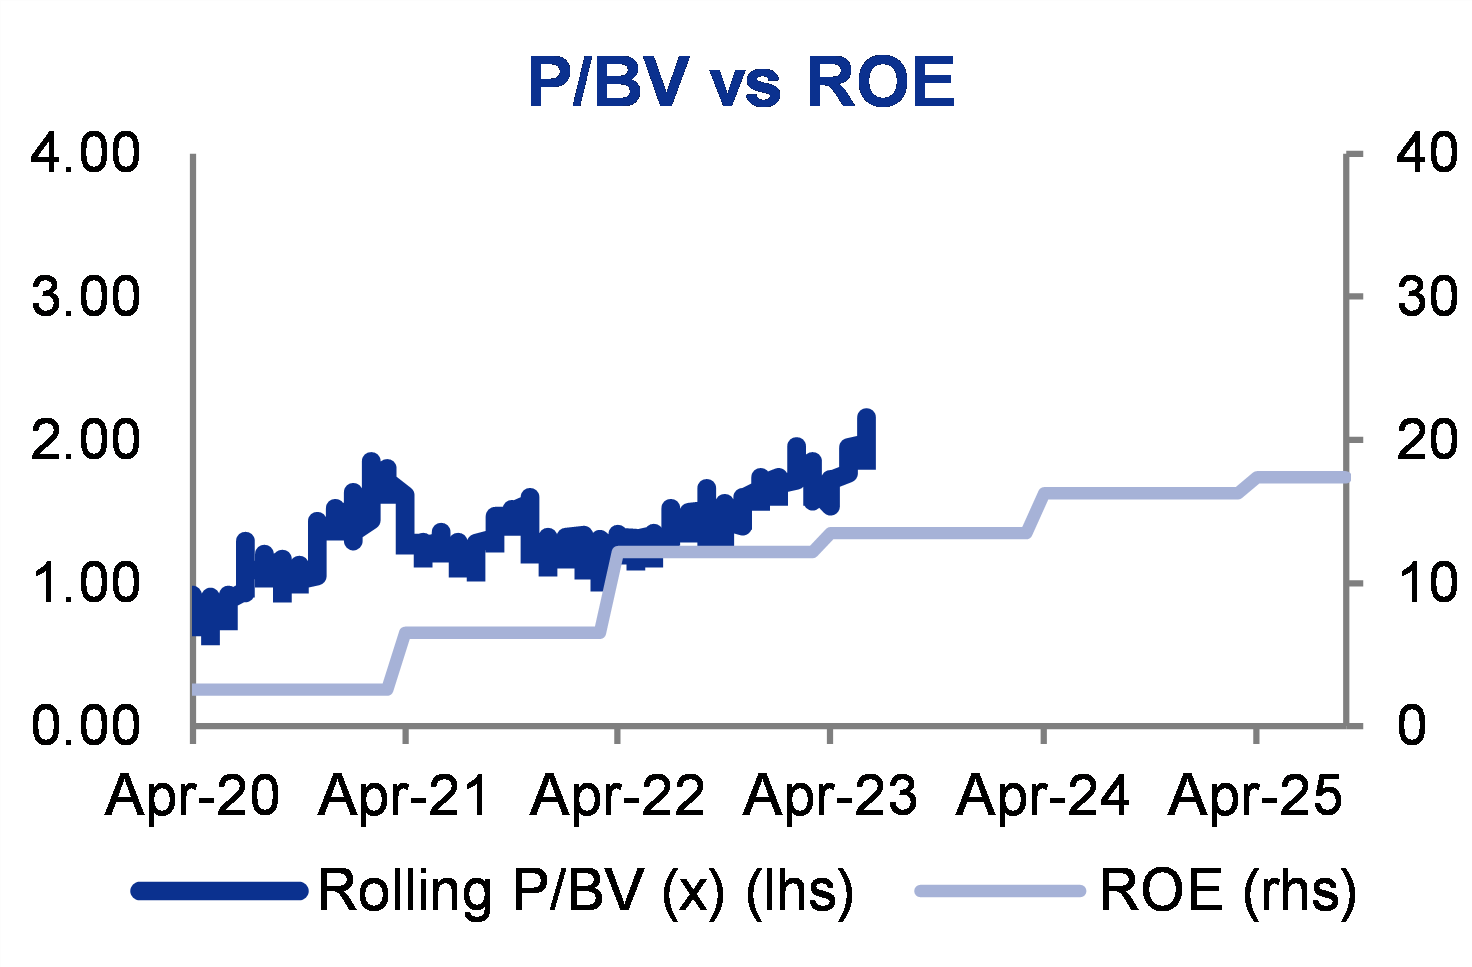
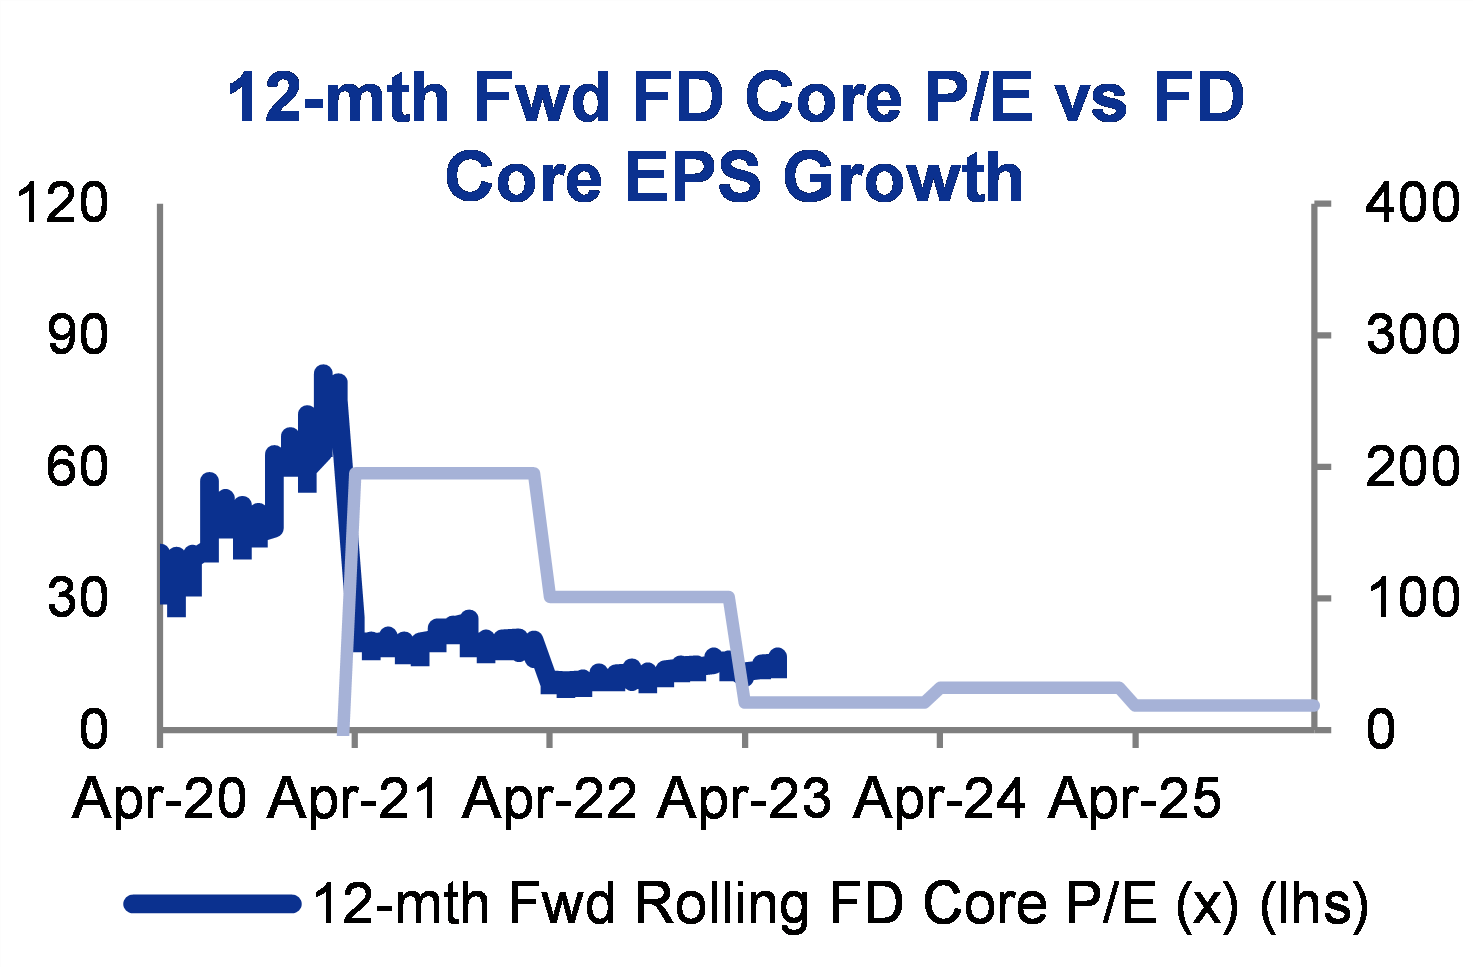
We expect the valuation gap to CIFC to narrow for MMFS as it achieves earnings consistency. Retain ADD rating. TP at Rs430 or 2.5x FY25F BV.

Our channel check indicates MMFS’ focus on quality growth

Our ground check with various dealers, direct sales agents or DSAs and customers across different geographies indicate an improving momentum for Mahindra & Mahindra Finance or MMFS on growth as well as asset quality fronts. The rising focus on better quality customers, growth aggression through improved incentive-linked pay structure and increased use of technology and data analytics are some of the observations that we made during our discussions with industry players.

Shift to affluent customer base via diversified offerings

MMFS is focusing on the affluent customer base from semi-urban and rural India through diversified product offerings and maintaining superior underwriting standards. The company is also focusing on diversity by introducing differentiated products including micro enterprise loans, loans against property, lease financing and unsecured personal and consumer loans across rural and semi-urban pockets in India. Management is also investing in various tech-enabled platforms for seamless execution.

Superior customers come at low yield and lower acquisition cost

MMFS is aware of yield compromise in case of superior customer acquisition which, in turn, may exert pressure on its margins in the coming years. However, the acquisition cost for such a customer is relatively low and also attracts lower credit cost which, we feel, should compensate for margin loss and improve overall profitability.

Retain its high conviction bet status; discount versus CIFC to narrow

MMFS has a track record of volatile asset quality. However, with improved customer sourcing, a rising mix of low-risk products and an efficient & timely collection mechanism, profitability may see a meaningful improvement. MMFS is one of our high-conviction ideas due to its attractive risk-reward & improving return ratios. We feel the discounting gap between Cholamandalam Investment and Finance Corporation & MMFS will narrow gradually, with asset quality improvement leading to more credit cost granularity for MMFS.

Outlook & valuation

We increase our earnings estimates for FY25F/26F, mainly led by moderation in long-term credit cost to ~150-160bp vs. ~180bp earlier. We retain ADD rating on MMFS with a higher target price of Rs430 (Rs350 earlier) or ~2.5x FY25F BV. Downside risks: Slowing growth, and deterioration in asset quality.

Financial Summary
Mar-22A Mar-23A Mar-24F Mar-25F Mar-26F
Net Interest Income (Rsm) 57,795 63,853 78,252 97,880 116,740
Total Non-Interest Income (Rsm) 191 941 998 1,123 1,237
Operating Revenue (Rsm) 57,986 64,794 79,250 99,003 117,978
Total Provision Charges (Rsm) (23,683) (9,992) (14,768) (18,021) (22,336)
Net Profit (Rsm) 9,888 19,848 24,049 31,858 37,827
Core EPS (Rs) 8.02 16.10 19.50 25.84 30.68
Core EPS Growth 195% 101% 21% 32% 19%
FD Core P/E (x) 39.57 19.71 16.27 12.28 10.34
DPS (Rs) 3.60 6.00 7.00 10.00 12.00
Dividend Yield 1.13% 1.89% 2.21% 3.15% 3.78%
BVPS (Rs) 126.7 138.6 151.1 166.9 185.6
P/BV (x) 2.50 2.29 2.10 1.90 1.71
ROE 6.5% 12.1% 13.5% 16.3% 17.4%
% Change In Core EPS Estimates
InCred Research/Consensus EPS (x)
INCRED RESEARCH, COMPANY REPORTS, PRICED AS AT January 01, 0001
Figure 1: Revision in our earnings estimates for MMFS

Y/e Mar (Rs m)

FY24F

FY25F

FY26F

Earlier

Revised

% change

Earlier

Revised

% change

Earlier

Revised

% change

Net interest income

77,653

78,252

0.8%

95,454

97,880

2.5%

1,13,645

1,16,740

2.7%

PPOP

46,232

46,833

1.3%

58,080

60,498

4.2%

69,693

72,772

4.4%

PAT

23,657

24,049

1.7%

28,615

31,858

11.3%

34,475

37,827

9.7%

EPS (Rs)

19.2

19.5

1.7%

23.2

25.8

11.3%

27.9

30.6

9.7%

AUM (Rs)

10,08,342

10,18,250

0

12,05,672

12,34,405

0

14,30,606

14,73,033

0


SOURCE: INCRED RESEARCH


BY THE NUMBERS

Profit & Loss
(Rs mn) Mar-22A Mar-23A Mar-24F Mar-25F Mar-26F
Net Interest Income 57,795 63,853 78,252 97,880 116,740
Total Non-Interest Income 191 941 998 1,123 1,237
Operating Revenue 57,986 64,794 79,250 99,003 117,978
Total Non-Interest Expenses (19,466) (25,402) (30,169) (35,852) (42,076)
Pre-provision Operating Profit 37,252 37,519 46,833 60,498 72,772
Total Provision Charges (23,683) (9,992) (14,768) (18,021) (22,336)
Operating Profit After Provisions 13,569 27,526 32,066 42,477 50,435
Pretax Income/(Loss) from Assoc.
Operating EBIT (incl Associates) 13,569 27,526 32,066 42,477 50,435
Non-Operating Income/(Expense)
Profit Before Tax (pre-EI) 20,872 36,285 42,400 54,569 64,462
Exceptional Items
Pre-tax Profit 13,569 27,526 32,066 42,477 50,435
Taxation (3,682) (7,134) (8,016) (10,619) (12,609)
Consolidation Adjustments & Others
Exceptional Income - post-tax (545)
Profit After Tax 9,888 19,848 24,049 31,858 37,827
Minority Interests
Pref. & Special Div
FX And Other Adj.
Net Profit 9,888 19,848 24,049 31,858 37,827
Balance Sheet Employment
(Rs mn) Mar-22A Mar-23A Mar-24F Mar-25F Mar-26F
Gross Loans/Cust Deposits
Avg Loans/Avg Deposits
Avg Liquid Assets/Avg Assets 84.6% 85.9% 86.2% 87.5% 88.8%
Avg Liquid Assets/Avg IEAs 106.1% 105.0% 101.7% 100.2% 101.0%
Net Cust Loans/Assets
Net Cust Loans/Broad Deposits
Equity & Provns/Gross Cust Loans
Asset Risk Weighting
Provision Charge/Avg Cust Loans
Provision Charge/Avg Assets
Total Write Offs/Average Assets

BY THE NUMBERS…cont’d

Balance Sheet
(Rs mn) Mar-22A Mar-23A Mar-24F Mar-25F Mar-26F
Total Gross Loans 609,055 794,550 999,403 1,217,213 1,473,333
Liquid Assets & Invst. (Current)
Other Int. Earning Assets
Total Gross Int. Earning Assets 609,055 794,550 999,403 1,217,213 1,473,333
Total Provisions/Loan Loss Reserve
Total Net Interest Earning Assets 609,055 794,550 999,403 1,217,213 1,473,333
Intangible Assets
Other Non-Interest Earning Assets 5,727 26,226 28,849 31,462 34,324
Total Non-Interest Earning Assets 17,925 39,406 44,707 48,069 51,755
Cash And Marketable Securities 41,507 28,320 2,344 3,056 24,405
Long-term Investments 84,403 99,890 107,881 116,512 128,163
Total Assets 752,890 962,166 1,154,334 1,384,850 1,677,655
Customer Interest-Bearing Liabilities
Bank Deposits
Interest Bearing Liabilities: Others 558,138 715,040 854,467 1,009,626 1,195,840
Total Interest-Bearing Liabilities 558,138 715,040 854,467 1,009,626 1,195,840
Banks Liabilities Under Acceptances
Total Non-Interest Bearing Liabilities 38,471 76,240 113,577 169,426 253,011
Total Liabilities 596,609 791,280 968,044 1,179,052 1,448,851
Shareholders Equity 156,281 170,886 186,290 205,798 228,804
Minority Interests
Total Equity 156,281 170,886 186,290 205,798 228,804
Key Ratios
(Rs mn) Mar-22A Mar-23A Mar-24F Mar-25F Mar-26F
Total Income Growth 0.1% 10.5% 22.6% 25.1% 19.3%
Operating Profit Growth (9.9%) 2.3% 24.6% 28.7% 20.2%
Pretax Profit Growth 226% 103% 16% 32% 19%
Net Interest To Total Income 99.7% 98.5% 98.7% 98.9% 99.0%
Cost Of Funds 6.85% 7.19% 7.20% 6.90% 6.60%
Return On Interest Earning Assets 16.0% 15.6% 15.0% 14.6% 14.1%
Net Interest Spread 9.12% 8.43% 7.82% 7.73% 7.49%
Net Interest Margin (Avg Deposits)
Net Interest Margin (Avg RWA)
Provisions to Pre Prov. Operating Profit 64% 27% 32% 30% 31%
Interest Return On Average Assets 7.59% 7.45% 7.39% 7.71% 7.62%
Effective Tax Rate 27.1% 25.9% 25.0% 25.0% 25.0%
Net Dividend Payout Ratio
Return On Average Assets 1.30% 2.31% 2.27% 2.51% 2.47%
Key Drivers
(Rs mn) Mar-22A Mar-23A Mar-24F Mar-25F Mar-26F
ITEM_KEY_01 N/A N/A N/A N/A N/A
ITEM_KEY_02 N/A N/A N/A N/A N/A
ITEM_KEY_03 N/A N/A N/A N/A N/A
ITEM_KEY_04 N/A N/A N/A N/A N/A
ITEM_KEY_05 N/A N/A N/A N/A N/A
ITEM_KEY_06 N/A N/A N/A N/A N/A
ITEM_KEY_07 N/A N/A N/A N/A N/A
ITEM_KEY_08 N/A N/A N/A N/A N/A
ITEM_KEY_09 N/A N/A N/A N/A N/A
ITEM_KEY_10 N/A N/A N/A N/A N/A
SOURCES: INCRED RESEARCH, COMPANY REPORTS

DISCLAIMER

This report (including the views and opinions expressed therein, and the information comprised therein) has been prepared by Incred Research Services Private Ltd.(formerly known as Earnest Innovation Partners Private Limited) (hereinafter referred to as “ IRSPL”). IRSPL is registered with SEBI as a Research Analyst vide Registration No. INH000007793. Pursuant to a trademark agreement, IRSPL has adopted “Incred Equities ” as its trademark for use in this report.

The term “IRSPL” shall, unless the context otherwise requires, mean IRSPL and its affiliates, subsidiaries and related companies. This report is not directed or intended for distribution to or use by any person or entity resident in a state, country or any jurisdiction, where such distribution, publication, availability or use would be contrary to law, regulation or which would subject IRSPL and its affiliates/group companies to registration or licensing requirements within such jurisdictions.

This report is being supplied to you strictly on the basis that it will remain confidential. No part of this report may be (i) copied, photocopied, duplicated, stored or reproduced in any form by any means; or (ii) redistributed or passed on, directly or indirectly, to any other person in whole or in part, for any purpose without the prior written consent of IRSPL.

The information contained in this report is prepared from data believed to be correct and reliable at the time of issue of this report.

IRSPL is not required to issue regular reports on the subject matter of this report at any frequency and it may cease to do so or change the periodicity of reports at any time. IRSPL is not under any obligation to update this report in the event of a material change to the information contained in this report. IRSPL has not any and will not accept any, obligation to (i) check or ensure that the contents of this report remain current, reliable or relevant; (ii) ensure that the content of this report constitutes all the information a prospective investor may require; (iii) ensure the adequacy, accuracy, completeness, reliability or fairness of any views, opinions and information, and accordingly, IRSPL and its affiliates/group companies (and their respective directors, associates, connected persons and/or employees) shall not be liable in any manner whatsoever for any consequences (including but not limited to any direct, indirect or consequential losses, loss of profits and damages) of any reliance thereon or usage thereof.

Unless otherwise specified, this report is based upon reasonable sources. Such sources will, unless otherwise specified, for market data, be market data and prices available from the main stock exchange or market where the relevant security is listed, or, where appropriate, any other market. Information on the accounts and business of company(ies) will generally be based on published statements of the company(ies), information disseminated by regulatory information services, other publicly available information and information resulting from our research. Whilst every effort is made to ensure that statements of facts made in this report are accurate, all estimates, projections, forecasts, expressions of opinion and other subjective judgments contained in this report are based on assumptions considered to be reasonable as of the date of the document in which they are contained and must not be construed as a representation that the matters referred to therein will occur. Past performance is not a reliable indicator of future performance. The value of investments may go down as well as up and those investing may, depending on the investments in question, lose more than the initial investment. No report shall constitute an offer or an invitation by or on behalf of IRSPL and its affiliates/group companies to any person to buy or sell any investments.

The opinions expressed are based on information which are believed to be accurate and complete and obtained through reliable public or other non-confidential sources at the time made. (Information barriers and other arrangements may be established where necessary to prevent conflicts of interests arising. However, the analyst(s) may receive compensation that is based on his/their coverage of company(ies) in the performance of his/their duties or the performance of his/their recommendations. In reviewing this report, an investor should be aware that any or all of the foregoing, among other things, may give rise to real or potential conflicts of interest. Additional information is, subject to the duties of confidentiality, available on request.

The report is not a “prospectus” as defined under Indian Law, including the Companies Act, 2013, and is not, and shall not be, approved by, or filed or registered with, any Indian regulator, including any Registrar of Companies in India, SEBI, any Indian stock exchange, or the Reserve Bank of India. No offer, or invitation to offer, or solicitation of subscription with respect to any such securities listed or proposed to be listed in India is being made, or intended to be made, to the public, or to any member or section of the public in India, through or pursuant to this report.

The research analysts, strategists or economists principally responsible for the preparation of this research report are segregated from the other activities of IRSPL. Information barriers and other arrangements have been established, as required, to prevent any conflicts of interests.

The research analysts, strategists or economists principally responsible for the preparation of this research report are segregated from the other activities of IRSPL. Information barriers and other arrangements have been established, as required, to prevent any conflicts of interests.

IRSPL may have issued other reports (based on technical analysis, event specific, short term views etc.) that are inconsistent with and reach different conclusion from the information presented in this report.

Holding of Analysts/Relatives of Analysts, IRSPL and Associates of IRSPL in the covered securities, as on the date of publishing of this report

Analyst/ Relative Entity/ Associates
any financial interests in the company covered in this report (subject company) and nature of such financial interest NO NO
actual/beneficial ownership of 1% or more in securities of the subject company at the end of the month immediately preceding the date of publication of the research report or date of the public appearance; NO NO
any other material conflict of interest at the time of publication of the research report or at the time of public appearance NO NO
received any compensation from the subject company in the past twelve months for investment banking or merchant banking or brokerage services or investment advisory or depository or distribution from the subject company in the last twelve months for products/services other than investment banking or merchant banking or broker- age services or investment advisory or depository or distribution from the subject company in the last twelve months NO NO
managed or co-managed public offering of securities for the subject company in the last twelve months NO NO
received any compensation or other benefits from the subject company or third party in connection with the research report NO NO
served as an officer, director or employee of the subject company NO NO
been engaged in market making activity for the subject company NO NO
Analyst declaration
  • The analyst responsible for the production of this report hereby certifies that the views expressed herein accurately and exclusively reflect his or her personal views and opinions about any and all of the issuers or securities analysed in this report and were prepared independently and autonomously in an unbiased manner.
  • No part of the compensation of the analyst(s) was, is, or will be directly or indirectly related to the inclusion of specific recommendations(s) or view(s) in this report or based any specific investment banking transaction.
  • The analyst(s) has(have) not had any serious disciplinary action taken against him/her(them). • The analyst, strategist, or economist does not have any material conflict of interest at the time of
  • publication of this report.
  • The analyst(s) has(have) received compensation based upon various factors, including quality, accuracy and value of research, overall firm performance, client feedback and competitive factors.

IRSPL and/or its affiliates and/or its Directors/employees may own or have positions in securities of the company(ies) covered in this report or any securities related thereto and may from time to time add to or dispose of, or may be materially interested in, any such securities.

IRSPL and/or its affiliates and/or its Directors/employees may do and seek to do business with the company(ies) covered in this research report and may from time to time (a) buy/sell the securities covered in this report, from time to time and/or (b) act as market maker or have assumed an underwriting commitment in securities of such company(ies), and/or (c) may sell them to or buy them from customers on a principal basis and/or (d) may also perform or seek to perform significant investment banking, advisory, underwriting or placement services for or relating to such company(ies) and/or (e) solicit such investment, advisory or other services from any entity mentioned in thisreport and/or (f) act as a lender/borrower to such company and may earn brokerage or other compensation. However, Analysts are forbidden to acquire, on their own account or hold securities (physical or uncertificated, including derivatives) of companies in respect of which they are compiling and producing financial recommendations or in the result of which they play a key part.