* price as on January 01, 0001
India
Consensus ratings*: Buy 8 Hold 0 Sell 0
Previous target: 2,025
Up/downside: 9.9%
Reuters
Bloomberg: HNAL IN
Market cap: US$10,542m
Rs765,480m
Average daily turnover: US$26.1m
Current shares o/s: 334.4m
Free float: 24.9%
*Source: Bloomberg

Key changes in this note

Raise FY23F-24F sales by 1%.

Raise FY23F-24F EBITDA by 1-2%.

Raise FY23F-24F PAT by 1-3%.

*Source: Bloomberg

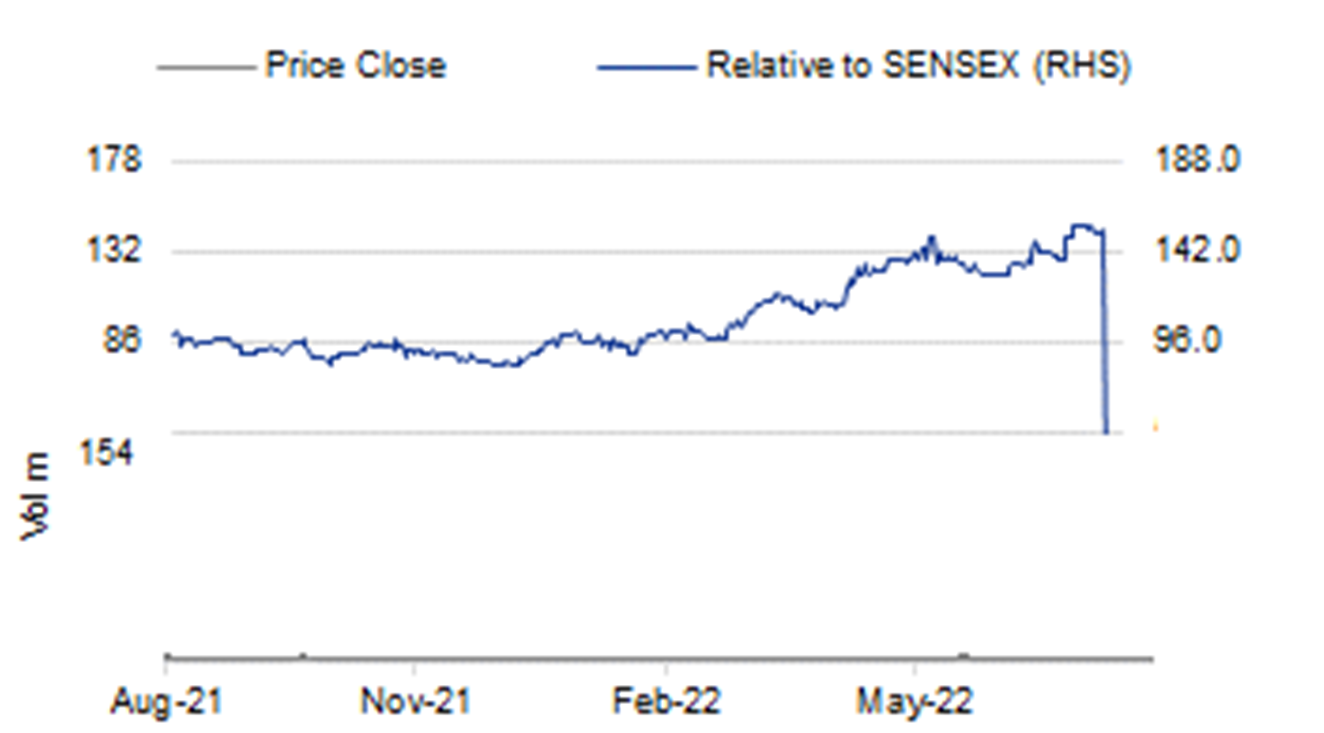
Price performance
1M 3M 12M
Absolute (%) 13.0 27.6 65.7
Relative (%) 12.3 23.1 62.6
Major shareholders
% held
Promoter 75.2
LIC 7.7
HDFC Mutual Fund 4.5
Analyst(s)

Sachin MANIAR

T (91) 22 4161 1545
E sachin.maniar@incredcapital.com

Abhishek JOSHI

T (91) 22 4161 1559
E abhishek.joshi@incredcapital.com

Solid order pipeline provides comfort

Hindustan Aeronautics cited strong order pipeline worth Rs420bn over FY23F-24F with a further order pipeline worth Rs600bn over the next 3-5 years.

Exports to be the growth driver but they are unlikely to have a meaningful contribution in FY23F-24F. Cost savings accelerated with indigenization steps.

Reiterate Add rating on the stock with a higher target price of Rs2,515.

Strong order pipeline over the next few years

Hindustan Aeronautics (HAL) expects manufacturing order inflows worth Rs420bn over FY23F-24F, which includes 70 Hindustan Turbo Trainer-40 (HTT-40) aircraft worth ~Rs70bn, 25 advanced light helicopters (ALH), 12 Sukhoi-30 aircraft (SU-30) worth Rs100bn, 12 light utility helicopters (LUH), 6 Do-228, and 240 AL-31 FP engines. HAL expects another Rs600bn worth of orders which includes 140 LCH, 175 LUH, 60 naval utility helicopters (NUH), 36 HTT-40 and 60 RD-33 engine orders over the next three-to-five years.

Exports to be new growth driver in the medium term

HAL has been well placed for LCA export order from Malaysia. The company is also pushing other platforms like ALH and LCH for exports to Nepal, Bangladesh, and the Philippines. HAL is also pushing for these products to other countries like Namibia, Mauritius, Vietnam, Thailand, and Nigeria. The company has a target to generate 10% of its sales from exports by FY25F. Repair & overhaul (RoH) has been growth driver for last few years and the company expects RoH revenue of Rs130-140bn in FY23F.

Cost savings through indigenization augur well for margins

HAL indigenized 1,412 items with an anticipated forex savings of Rs1.6bn in FY22. The company has already uploaded cumulatively more than 13,000 imported items on Srijan Defence Portal. Regarding the recent third positive indigenization list comprising 780 items, management cited that almost half of them are for HAL platforms. Provision was high at ~10% of sales in FY22 because of one-off items like SU-30 aircraft replacement due to an accident, leading to a provision of Rs1.6bn and certain loan items to the tune of Rs2.7bn, excluding which it will normalize to ~7% of sales going ahead.

Reiterate Add rating on the stock with higher target price of Rs2,515

Order pipeline remains solid, but order finalization timeline is critical to maintain growth momentum in FY23F-24F. We marginally raise our EPS estimate by 3% for FY24F. We raise our target price to Rs2,515 (Rs2,025 earlier) as we roll over to Sep 2024F EPS (implying a P/E of 16x vs. 14x considering the strong order pipeline, better working capital position and margin profile) and maintain our Add rating on HAL. Delay in new orders, setback in aircraft delivery and lower margins are key downside risks.

Financial Summary
Mar-21A Mar-22A Mar-23F Mar-24F Mar-25F
Revenue (Rsm) 227,546 246,202 258,337 275,432 305,905
Operating EBITDA (Rsm) 53,469 54,128 62,892 68,659 77,900
Net Profit (Rsm) 32,309 50,865 43,702 47,769 54,207
Core EPS (Rs) 96.6 152.1 130.7 142.9 162.1
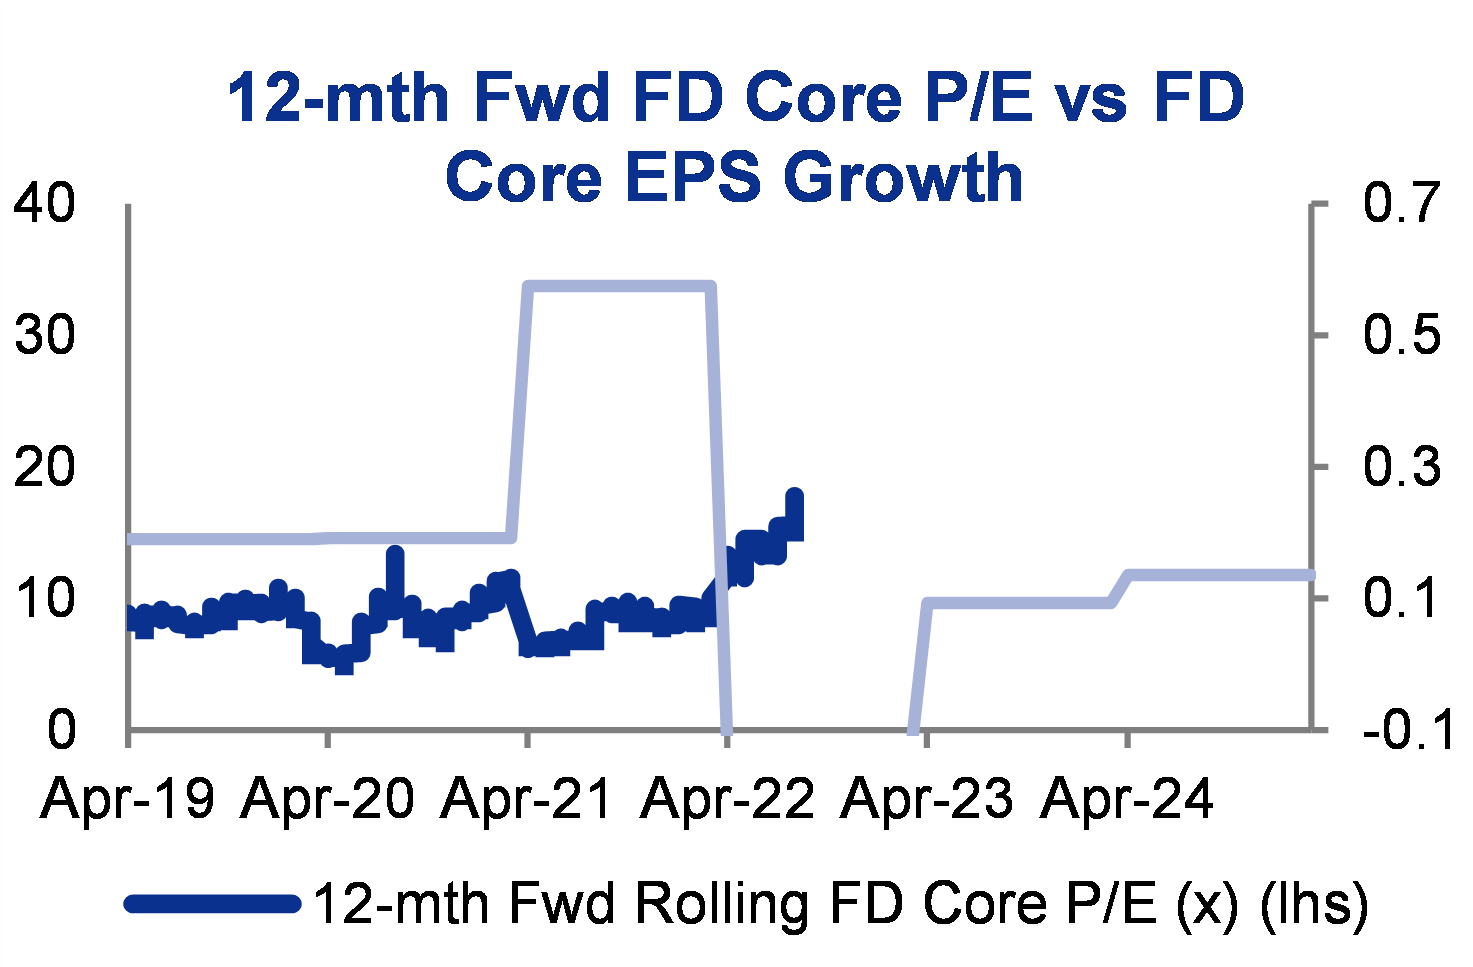
Core EPS Growth 19.1% 57.4% (14.1%) 9.3% 13.5%
FD Core P/E (x) 23.69 15.05 17.52 16.02 14.12
DPS (Rs) 30.0 40.0 34.4 37.6 42.6
Dividend Yield 1.31% 1.75% 1.50% 1.64% 1.86%
EV/EBITDA (x) 12.98 11.49 9.57 8.53 7.27
P/FCFE (x) 9.42 (28.60) 29.08 26.63 22.98
Net Gearing (46.6%) (74.5%) (72.9%) (69.2%) (66.3%)
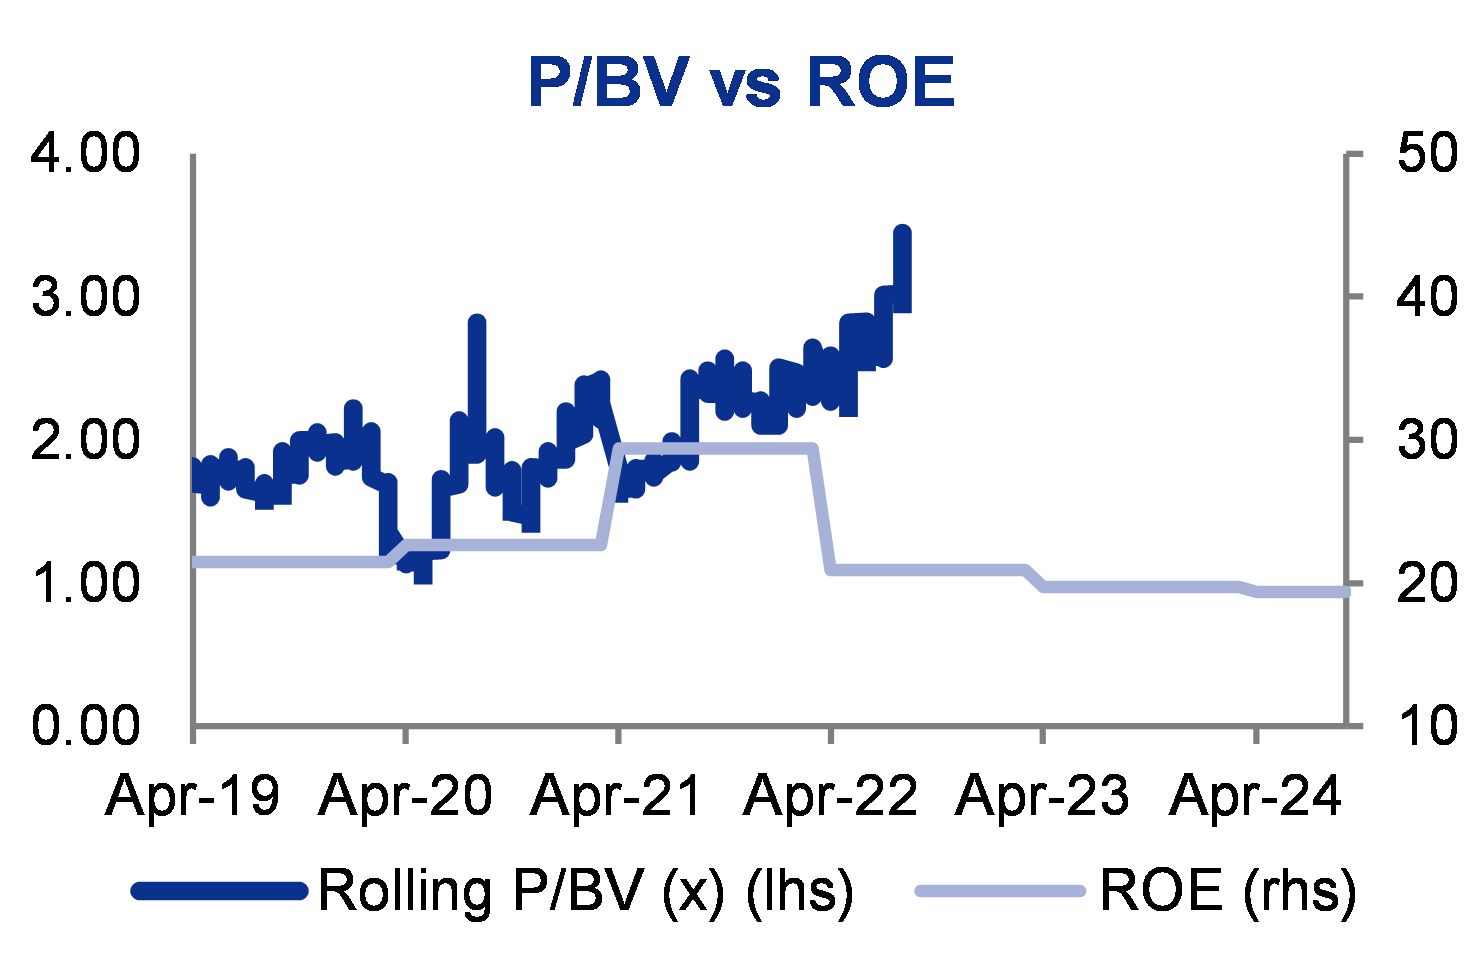
P/BV (x) 4.98 3.97 3.40 2.94 2.55
ROE 22.6% 29.4% 20.9% 19.7% 19.4%
% Change In Core EPS Estimates 0.92% 2.47%
InCred Research/Consensus EPS (x)
INCRED RESEARCH, COMPANY REPORTS, PRICED AS AT January 01, 0001

Solid order pipeline provides comfort

Key takeaways from conference call

·         Future order prospects: HAL expects manufacturing order inflows worth Rs420bn over FY23F-24F, which includes 70 Hindustan Turbo Trainer-40 (HTT-40) aircraft worth ~Rs70bn, 25 advanced light helicopters (ALH), 12 Sukhoi-30 (SU-30) aircraft worth Rs100bn, 12 light utility helicopters (LUH), six Do-228, 240 AL-31 FP engines, and mid-life upgrade of Do-228 for the Indian Navy worth ~Rs25bn. HAL expects another Rs600bn worth of orders, which includes 140 LCH, 175 LUH, 60 NUH, 36 HTT-40, 60 naval utility helicopters and 60 RD-33 engine orders over the next three-to-five years.

·         Provision: Provision stood at 10% of sales in FY22 due to the following:

o    SU-30 aircraft replacement due to accident led to an additional provision of Rs1.6bn over and above the company’s insurance claim. 

o    Certain loan to the tune of Rs2.7bn which the company took for faster delivery to its customers due to their urgent requirement.

o    Warranty provision of Rs1.9bn because of increase in sales. 

o    Replacement of helicopters led to a provision of Rs2bn.

o    HAL would be able to maintain a total provision at 6%-7% in FY23F as first two provisions were one-offs. Margin would be around 24%-25%. There would be no margin accretion due to lower provision. 

·         Exports: HAL has been well placed in the Malaysian order for LCA. The company is also pushing other platforms like ALH and LCH for exports to the Philippines, Nepal, and Bangladesh. HAL is also pushing these products to other countries like Namibia, Mauritius, Vietnam, Thailand, and Nigeria. HAL would also push exports of HTT-40 once it starts operations with the Indian Air Force or IAF. ROH activities would be conducted in the respective export countries, although parts can be imported from India.

·         Engines: 25kN Hindustan turbo fan engine (HTFE) is being developed in-house by HAL (company-funded project). The company has conducted core engine and compressor test. It expects another six-to-seven years for certification of engine. General Electric 404 engines are being procured from USA. IAF is opening up RoH facility at its bases. HAL wants to augment this workshop by manufacturing parts and is in discussions with GE for transfer of technology for the same. This will facilitate RoH of engines in India, which normally takes two years to come back if sent to USA. HAL has entered into a joint venture with Safran to take care of future ROH requirement of ALH engines, which would help the company to focus more on manufacturing of ALH engines at its own facility. Helicopter MRO helicopter facility will come up in Goa by the end of 2023F.  

·         LCH and engine orders: Of the 15 LCH orders (worth Rs28bn), 6 had been delivered in FY22 and 9 would be delivered in FY23F. Large LCH order comprising 140 units worth Rs250bn is expected in the next two-to-three years. On engines, 240 AL-31 FP engine order is estimated by FY23F-1HFY24F, and 80 RE-33 engines contract would be concluded in FY24F. 

·         ALH: HAL expects 9 ALH to be delivered in FY23F, which will lead to completion of old contracts. Order for 25 ALH is expected by FY23F, and deliveries to start from FY24F-FY25F. ALH is a successful program and orders will continue for the same.

·         Dornier 228 aircraft: HAL expects six Dornier-228 aircraft order from IAF, of which four will be delivered in FY23F and the remaining two would be delivered in FY24F. For mid upgrade of Donier-228 aircraft for Indian Navy, HAL has already submitted budgetary quotation and is awaiting Request For Proposal or RFP from the customer. HAL has two civil Dornier aircraft already flying right now and is manufacturing two more civil aircraft as it is already in discussions with multiple state governments for induction of the same. Price of civil aircraft is around Rs600m.

·         Platforms to undergo ROH during FY23F: 20 Su-30s, 13 Jaguars, 9 Mirage, 2Kiran Mk-1A and MK2, 9 Hawks, 2 Dornier,41 ALH, 40 Cheeta-Chetak and engines for these platforms which will account for ~Rs70bn, apart from accessories and avionics. Accessories and avionics would account for another Rs60-70bn. Total Rs130-140bn of ROH orders would be executed during FY23F.

·         SU-30: Orders may come in FY23F and deliveries to start from FY24F.

·         Supply from Russia: HAL has made payment to Russia with some payment mechanism and the problem seems to have been sorted out. The company is getting supply of spares from Russian, notwithstanding the status ofpayment.  HAL expects no major disruption in supply from Russia going ahead, and the company has got enough inventory currently to meet its requirement in FY23F.

Figure 1: Standalone quarterly analysis

YE Mar (Rs m)

 1QFY23

 1QFY22

 yoy % chg

 4QFY22

 qoq % chg

 FY22

 FY21

 yoy % chg

 1QFY23E

 Actuals vs. our estimates

 Total revenue

36,225

16,162

124.1%

1,15,610

(68.7%)

2,46,202

2,27,546

8.2%

32,325

12%

 Less: 


 Net raw material consumed

10,186

-2,265

(549.8%)

46,387

(78.0%)

1,00,042

1,10,512

(9.5%)

9,697

5%

 Other expenses

7,648

5,439

40.6%

30,259

(74.7%)

46,133

20,655

123.4%

5,786

32%

 Personnel cost

10,141

10,547

(3.8%)

13,988

(27.5%)

45,898

42,910

7.0%

11,152

-9%

 Total expenditure

27,976

13,721

103.9%

90,633

(69.1%)

1,92,074

1,74,077

10.3%

26,635

0%

 EBIDTA

8,250

2,441

238.0%

24,978

(67.0%)

54,128

53,469

1.2%

5,689

45%

 Less: Depreciation

2,081

1,113

86.9%

3,823

(45.6%)

11,099

11,776

(5.7%)

1,180

76%

 EBIT

6,169

1,328

364.6%

21,154

(70.8%)

43,030

41,693

3.2%

4,509

37%

 Less: Interest paid

2

147

(98.5%)

421

(99.5%)

581

2,591

(77.6%)

50

-96%

 Non-operating income

1,921

1,501

28.0%

5,005

(61.6%)

9,863

3,587

175.0%

2,000

-4%

 Extraordinary expenses


 Profit before tax

8,088

2,682

201.6%

25,739

(68.6%)

52,312

42,709

22.5%

6,459

25%

 Profit before tax excl. extraordinaries

8,088

2,682

201.6%

25,739

(68.6%)

52,312

42,689

22.5%

6,459

25%

 Less: Total tax

2,021

694

191.2%

-5,281

(138.3%)

1,447

10,379

(86.1%)

1,679

20%

 Reported PAT

6,067

1,988

205.2%

31,020


50,865

32,330

57.3%

4,780

27%

 Profit after tax excl. extraordinaries

6,067

1,988

205.2%

31,020

(80.4%)

50,865

32,309

57.4%

4,780

27%

 Diluted shares outstanding (m)

334

334


334


334

334


334


 Reported EPS-diluted (Rs.)

18.1

5.9

205.2%

92.8

(80.4%)

152.1

96.7

57.3%

14.3

27%

 Adjusted EPS-diluted (Rs.)

18.1

5.9

205.2%

92.8

(80.4%)

152.1

96.6

57.4%

14.3

27%


 Margin Analysis


yoy bp chg


qoq bp chg


yoy bp chg


 Raw material % of total revenue

28.1%

-14.0%

4,213

40.1%

-1,201

40.6%

48.6%

-793

30.0%

 Other expenses % of total revenue

21.1%

33.7%

-1,254

26.2%

-506

18.7%

9.1%

966

17.9%

 Personnel cost % of total revenue

28.0%

65.3%

-3,726

12.1%

1,590

18.6%

18.9%

-22

34.5%

 EBIDTA margin

22.8%

15.1%

767

21.6%

117

22.0%

23.5%

-151

17.6%

 EBIT margin

17.0%

8.2%

881

18.3%

-127

17.5%

18.3%

-85

13.9%

 PBT margin (%)

22.3%

16.6%

573

22.3%

6

21.2%

18.8%

248

20.0%

 Proforma NPM

16.7%

12.3%

445

26.8%

-1,008

20.7%

14.2%

646

14.8%

 Effective tax rate (%)

25.0%

25.9%

-89

-20.5%

4551

2.8%

24.3%

-2154

26.0%

SOURCE: INCRED RESEARCH, COMPANY REPORTS


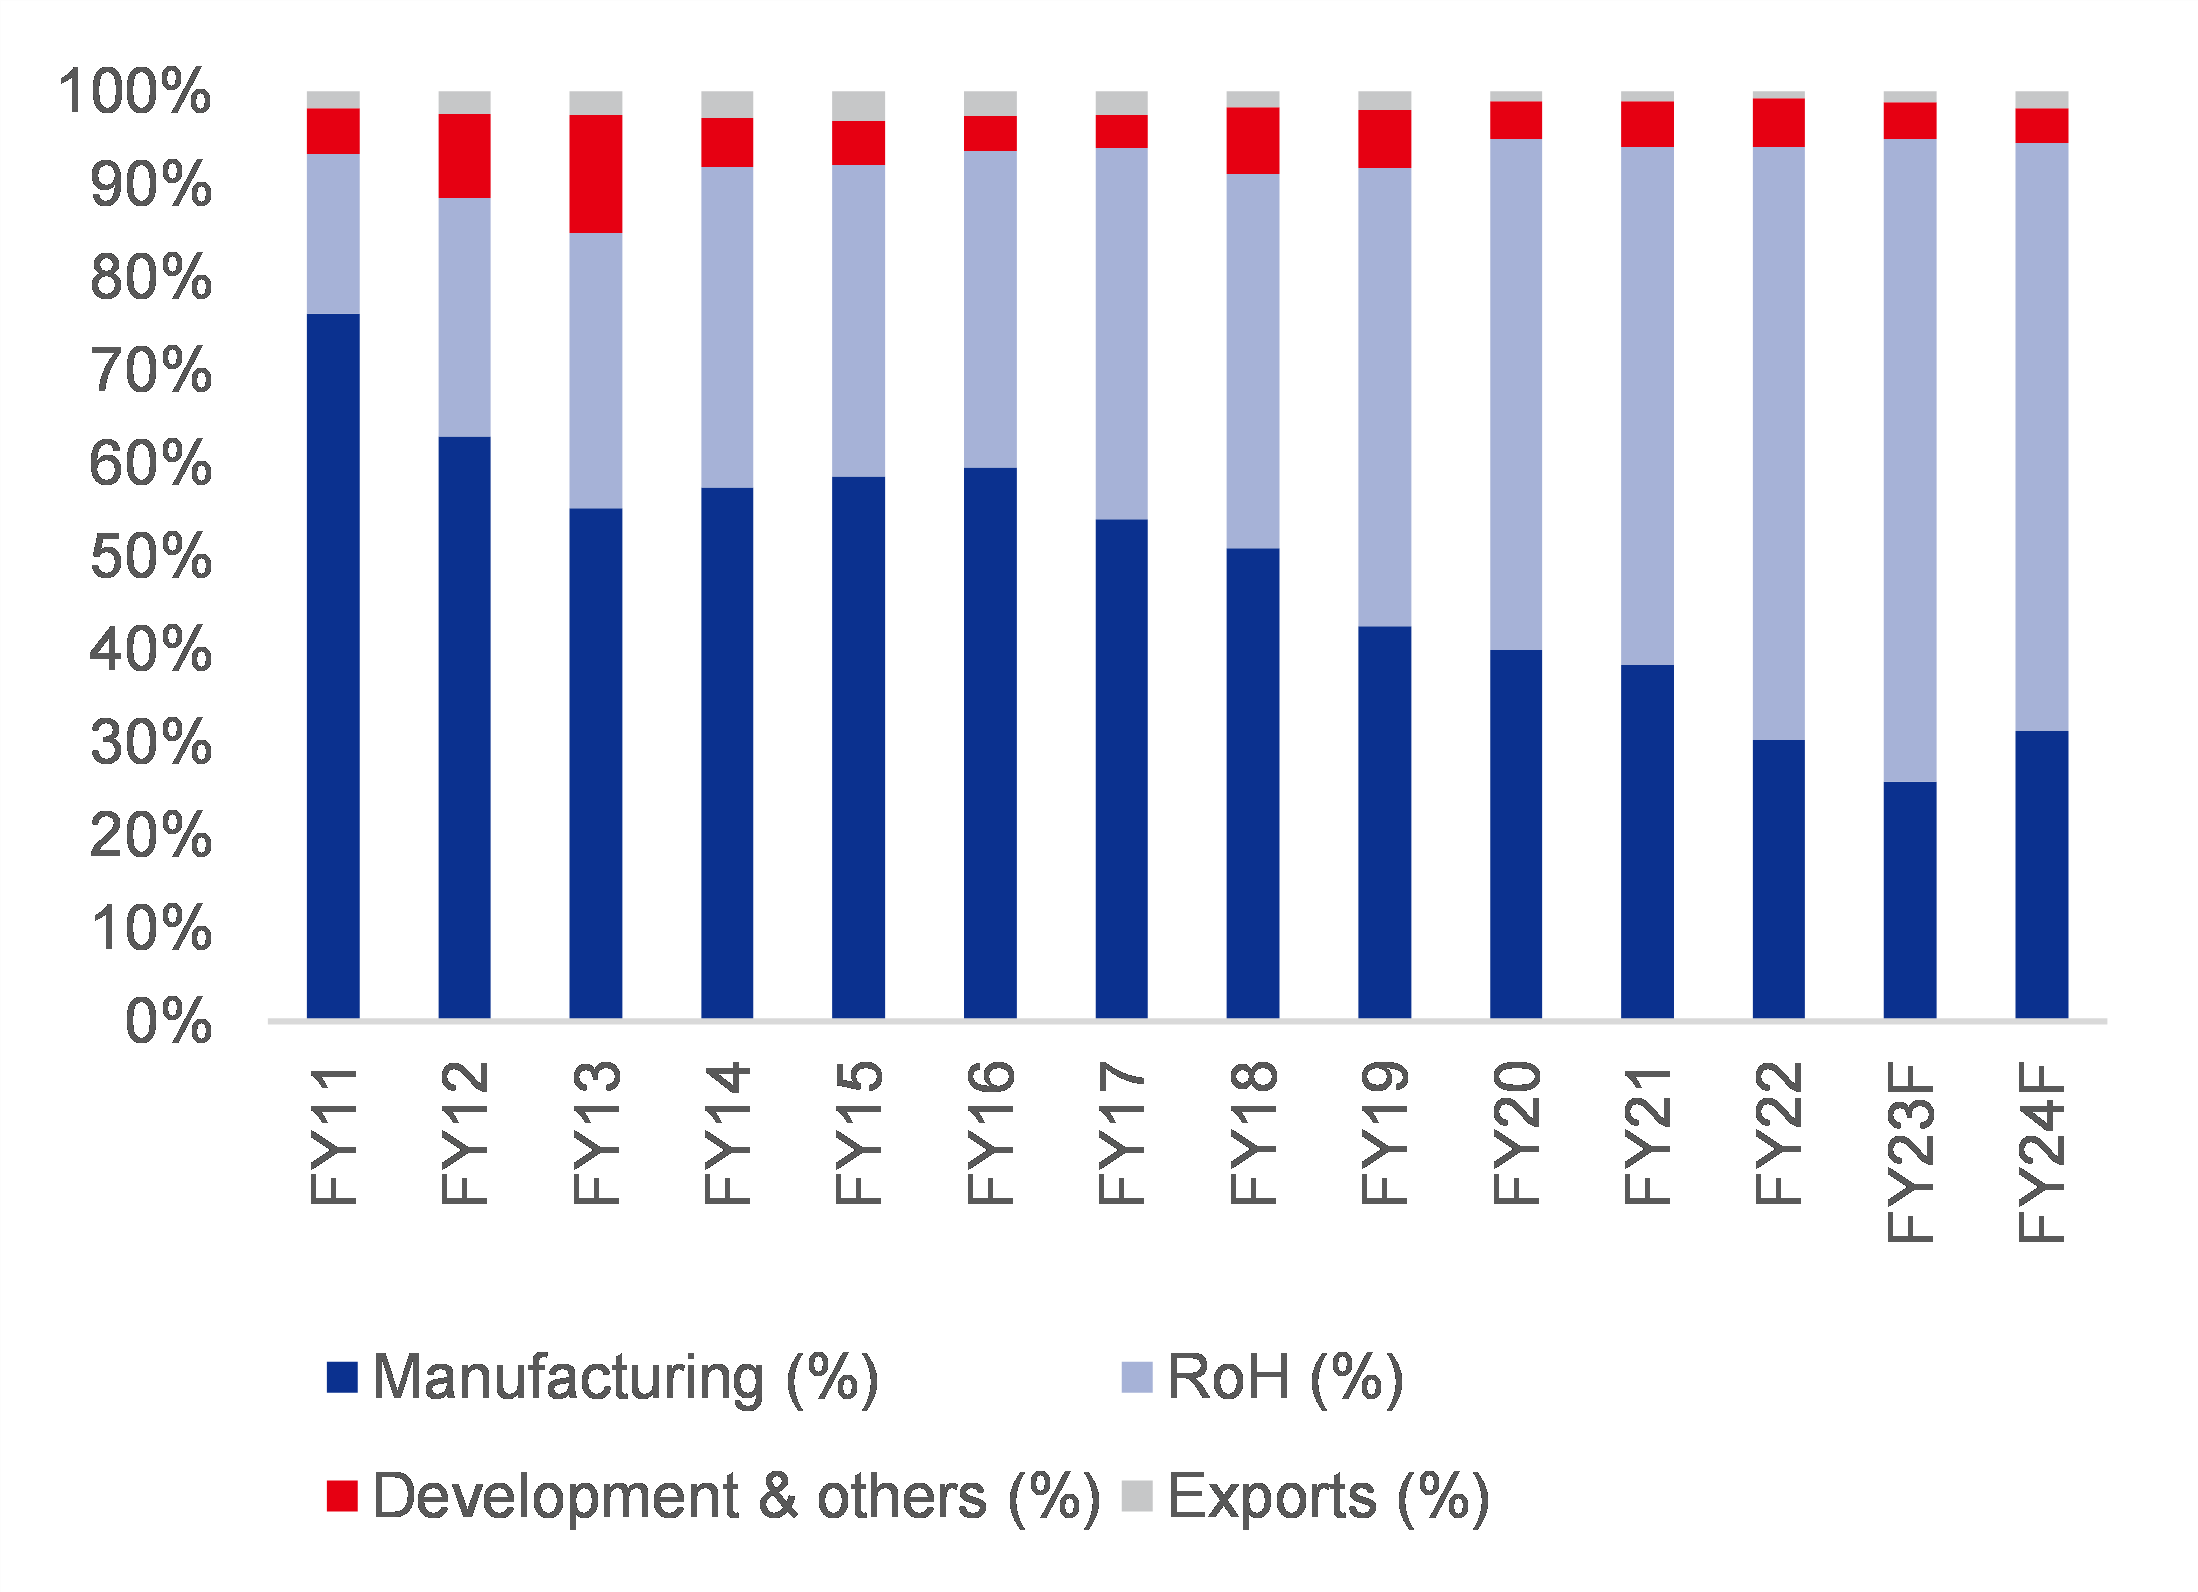
Figure 2: Share of manufacturing sales declined over the last few years, while services sales share inched up
SOURCE: INCRED RESEARCH, COMPANY REPORTS
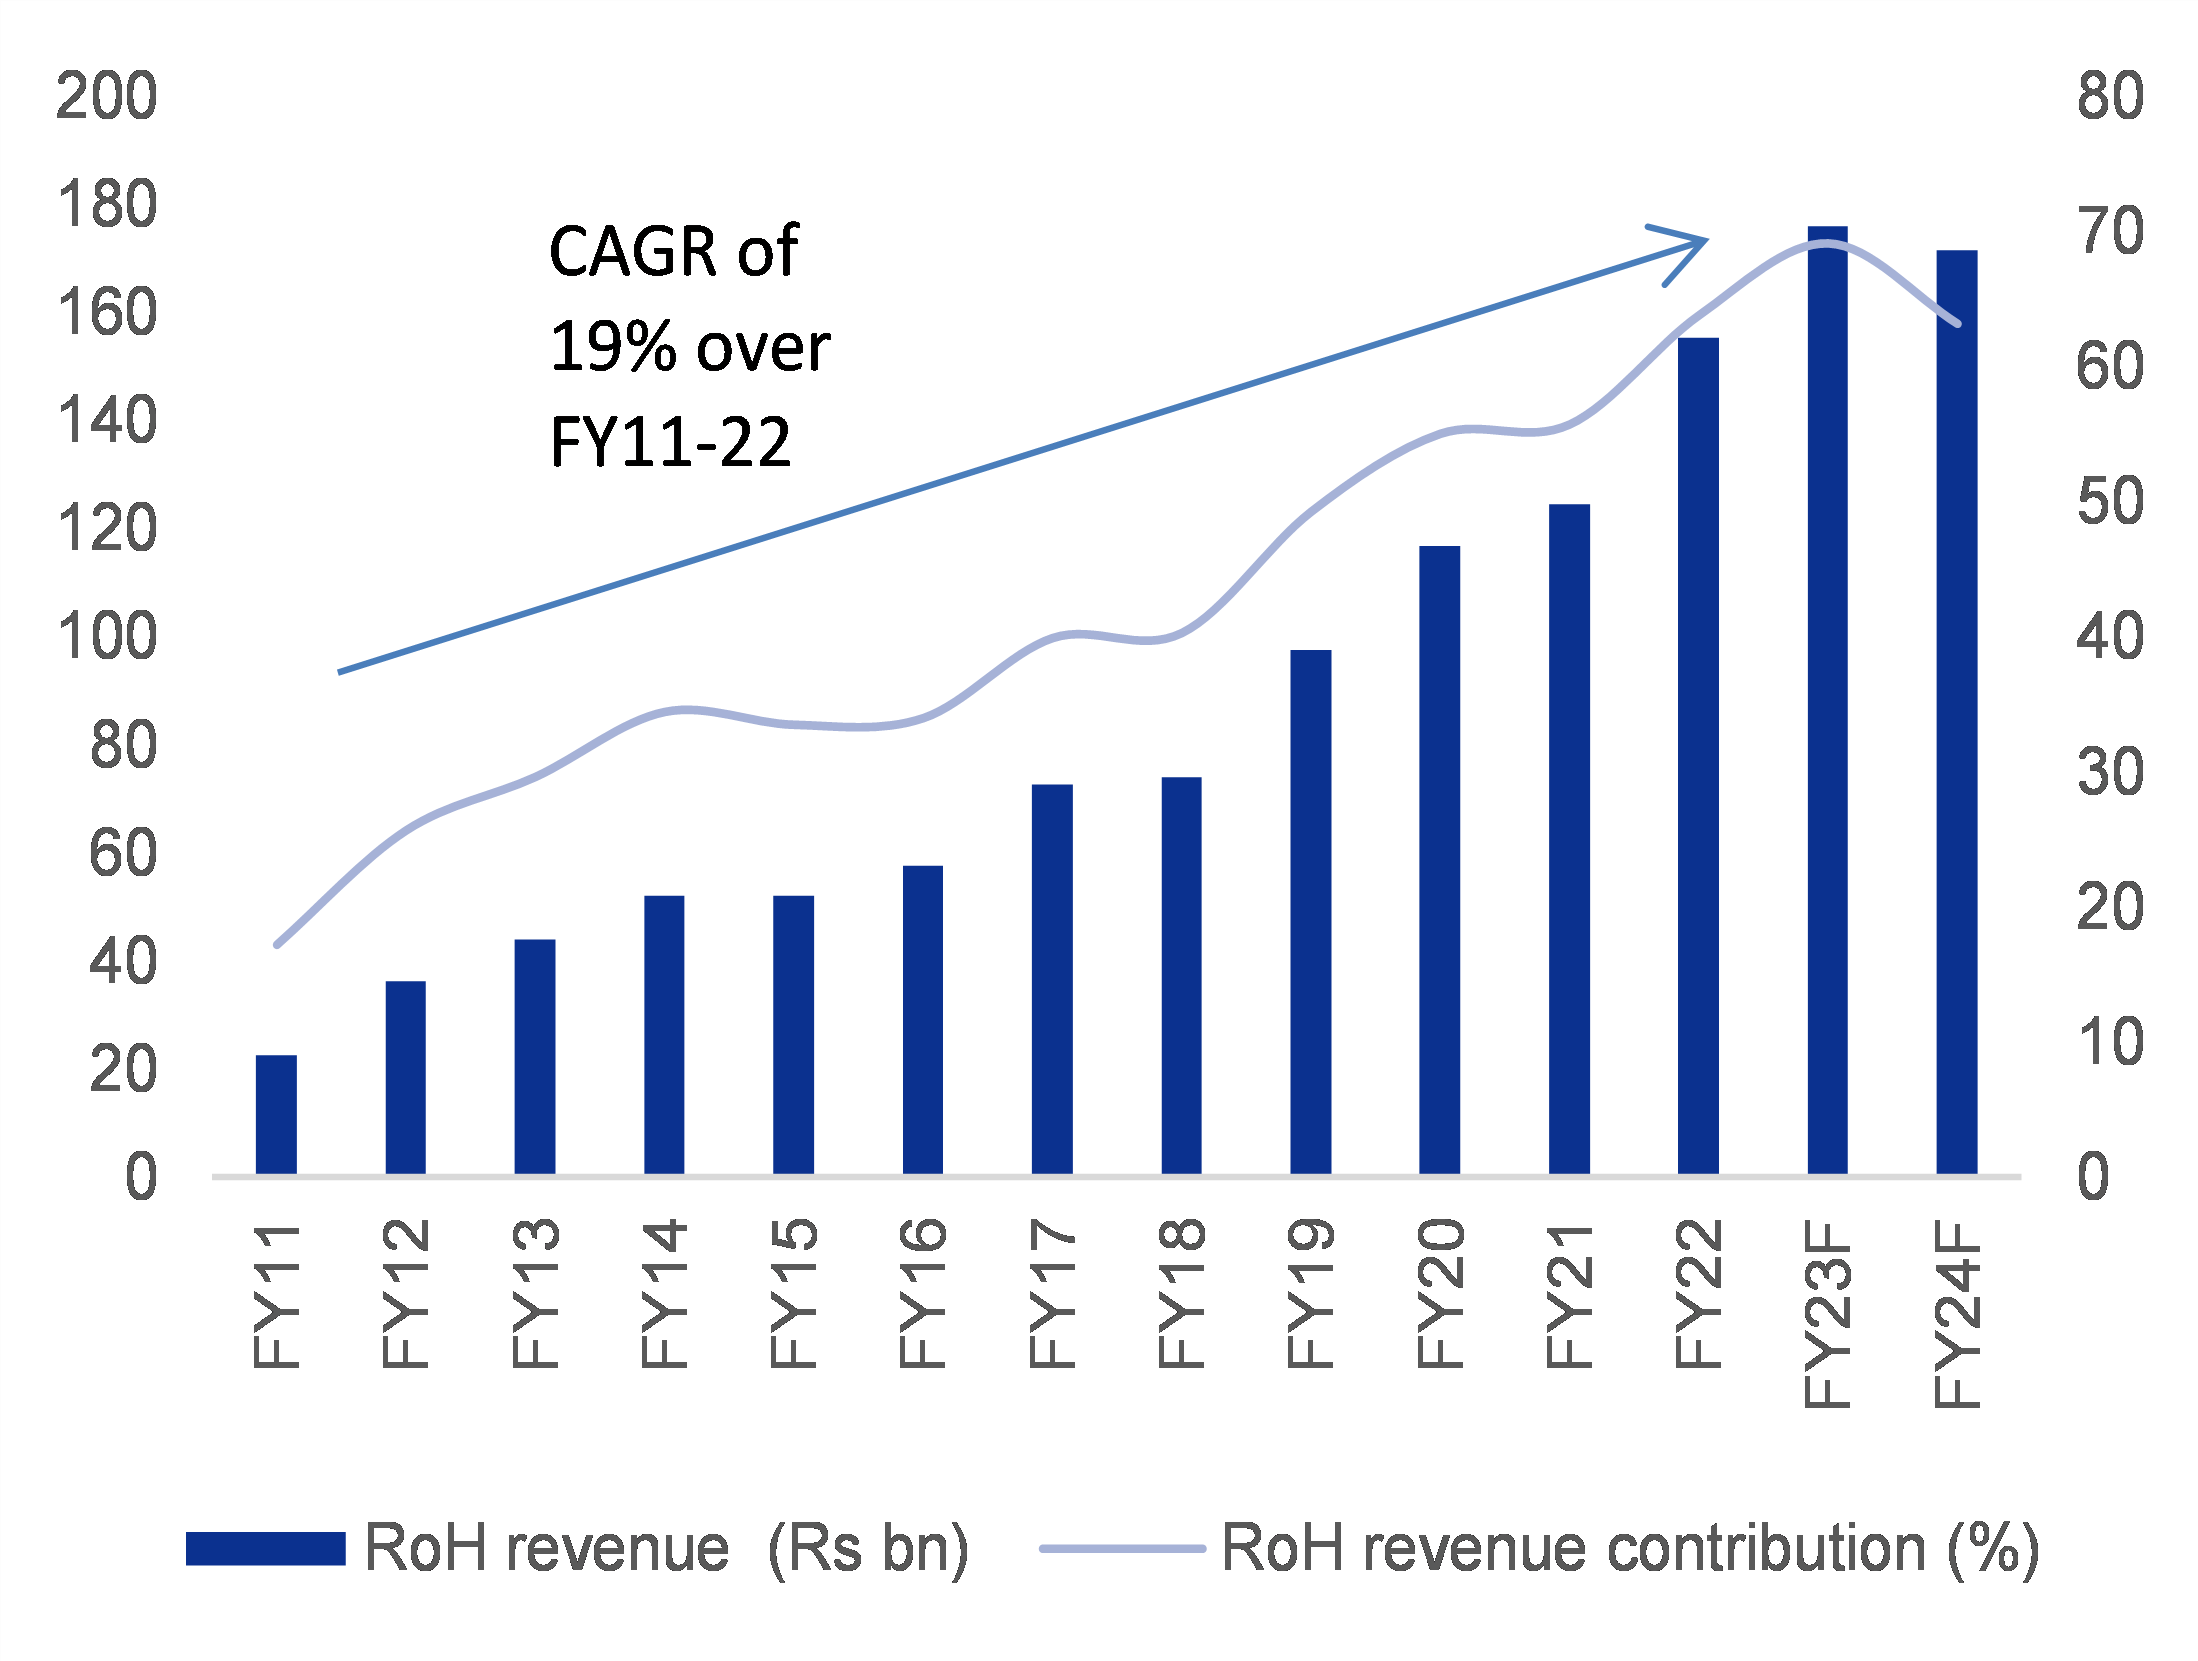
Figure 3: Services sales grew at a 19% CAGR over FY11-22, although growth may moderate over FY24F
SOURCE: INCRED RESEARCH, COMPANY REPORTS
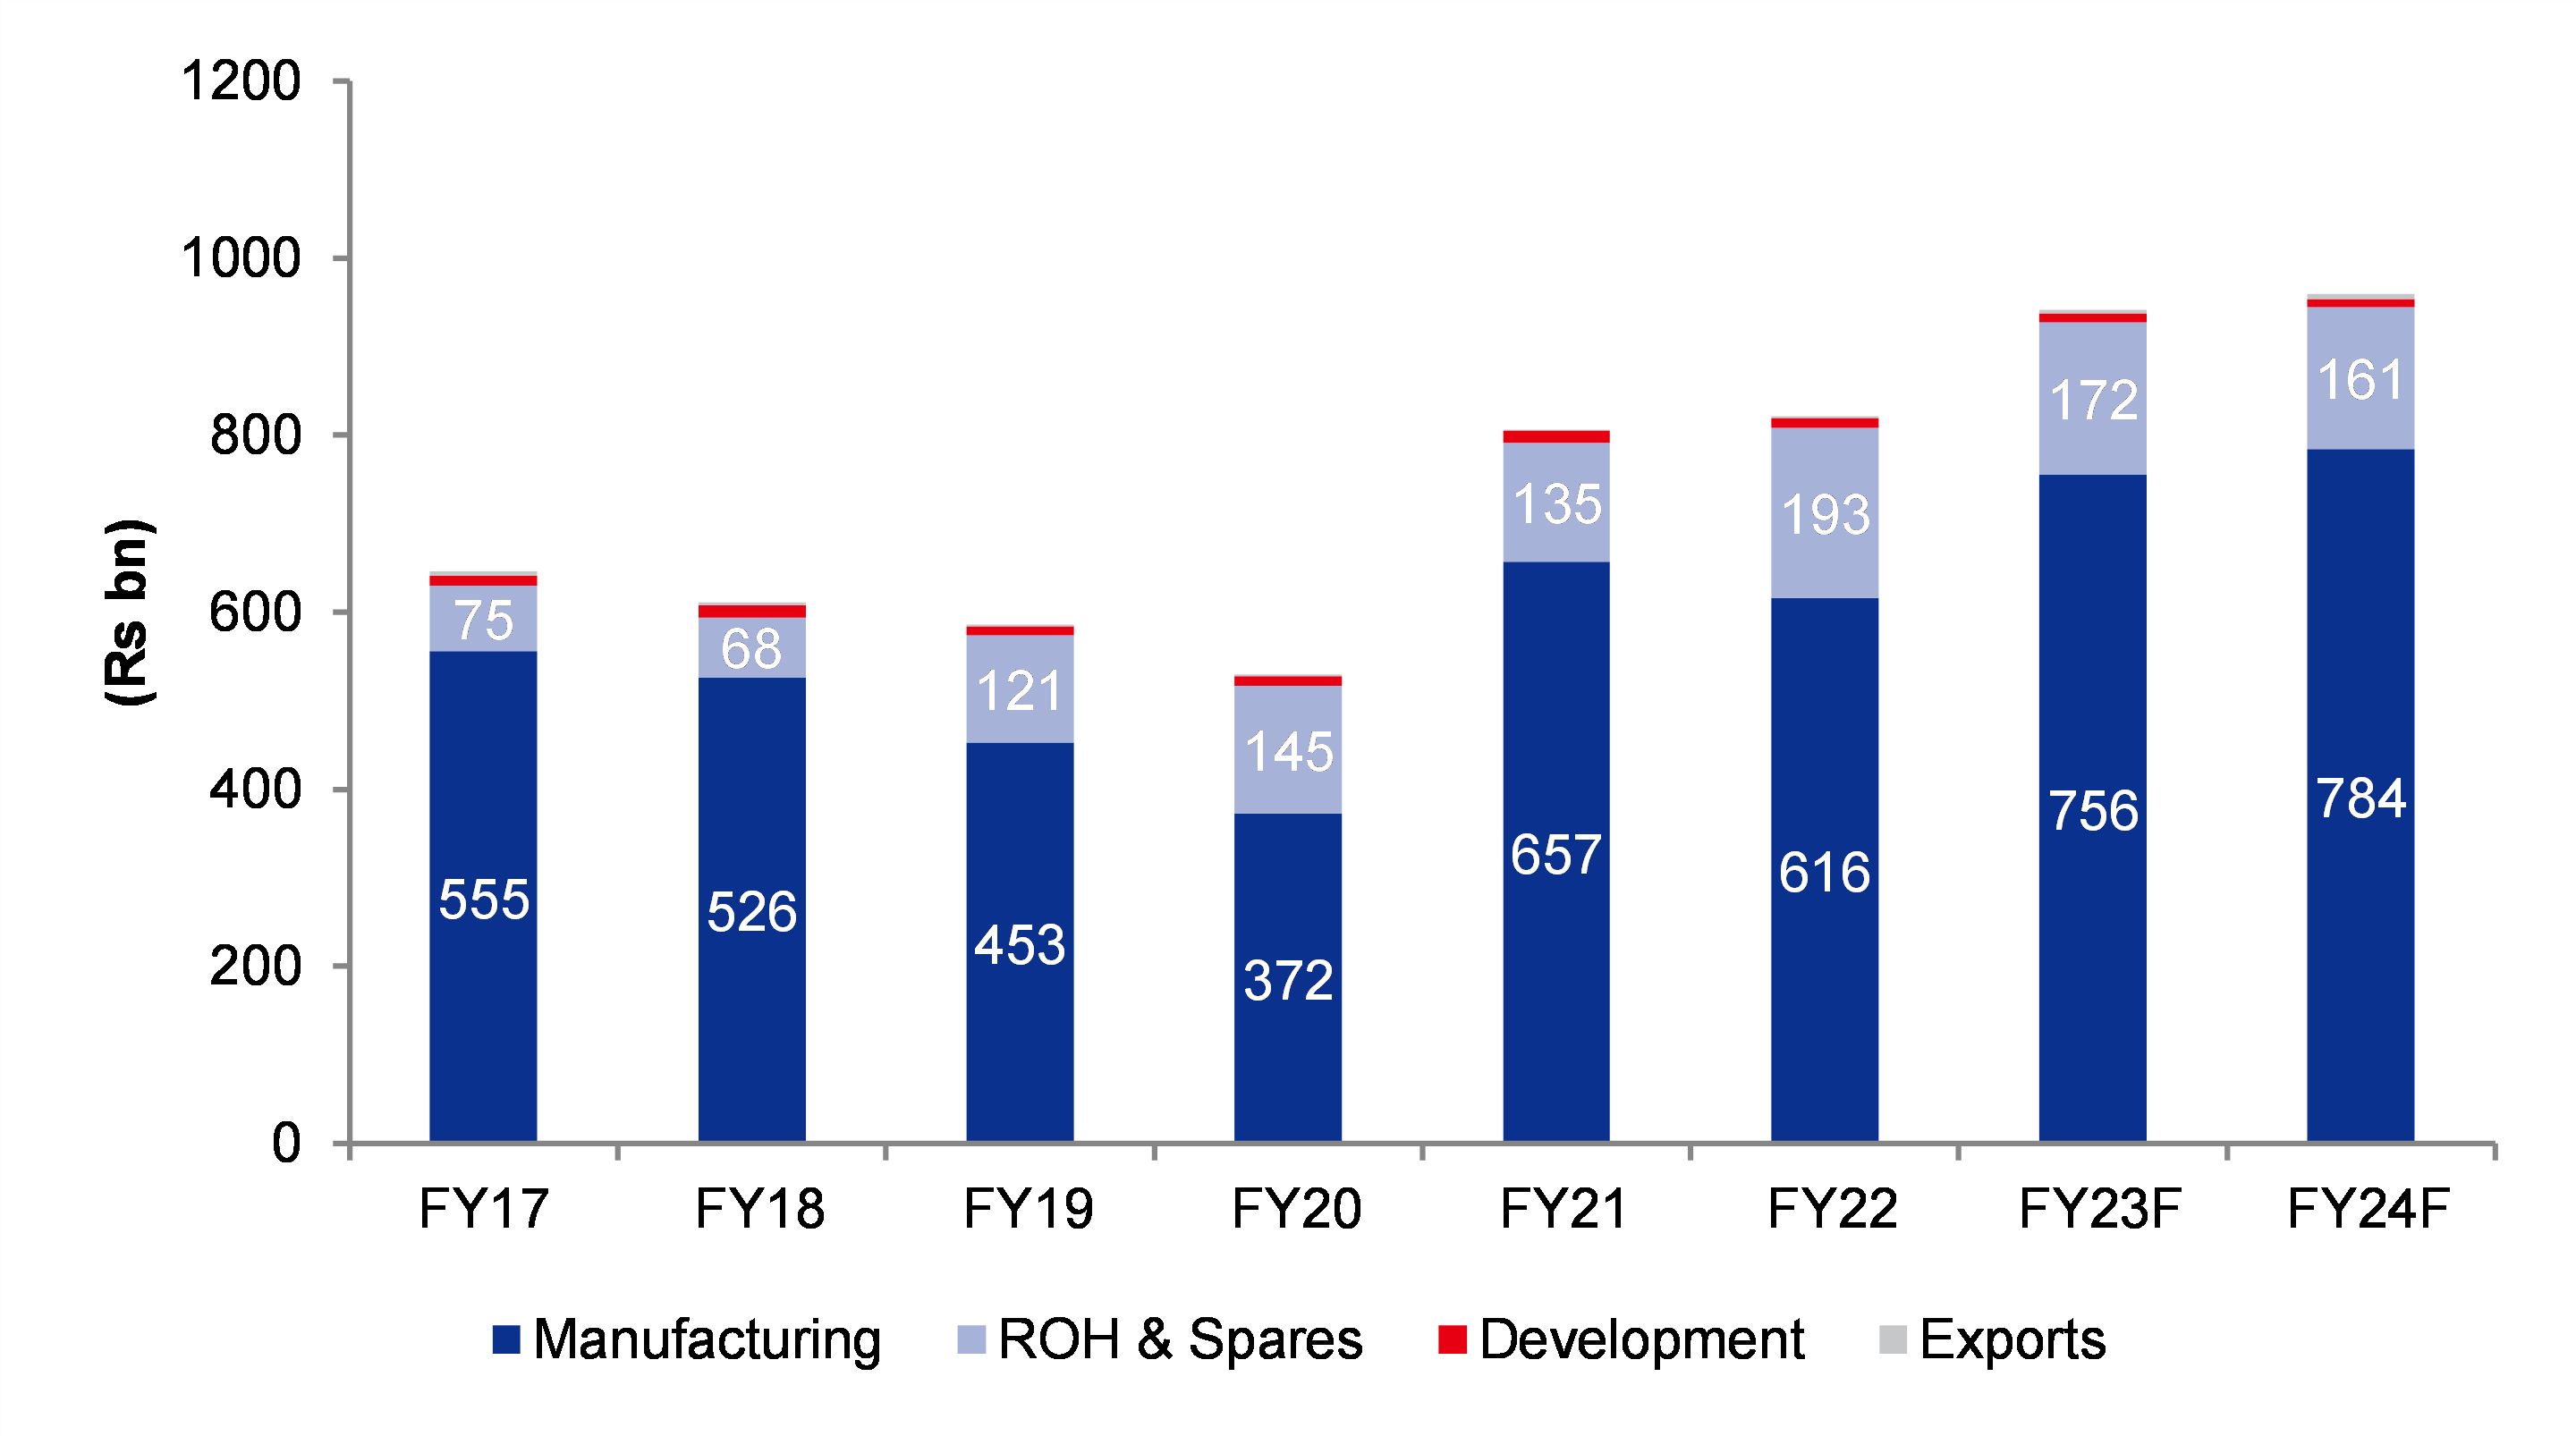
Figure 4: Large order finalization over FY21-24F to boost order backlog
SOURCE: INCRED RESEARCH, COMPANY REPORTS


Figure 5: Earnings revision summary


Old estimates

New estimates

Change (%)

(Rs m)

FY23F

FY24F

FY23F

FY24F

FY23F

FY24F

Revenue

2,57,055

2,72,610

2,58,337

2,75,432

0.5%

1.0%

EBITDA

62,340

67,437

62,892

68,659

0.9%

1.8%

Core PAT

43,302

46,618

43,702

47,769

0.9%

2.5%

SOURCE: INCRED RESEARCH, COMPANY REPORTS


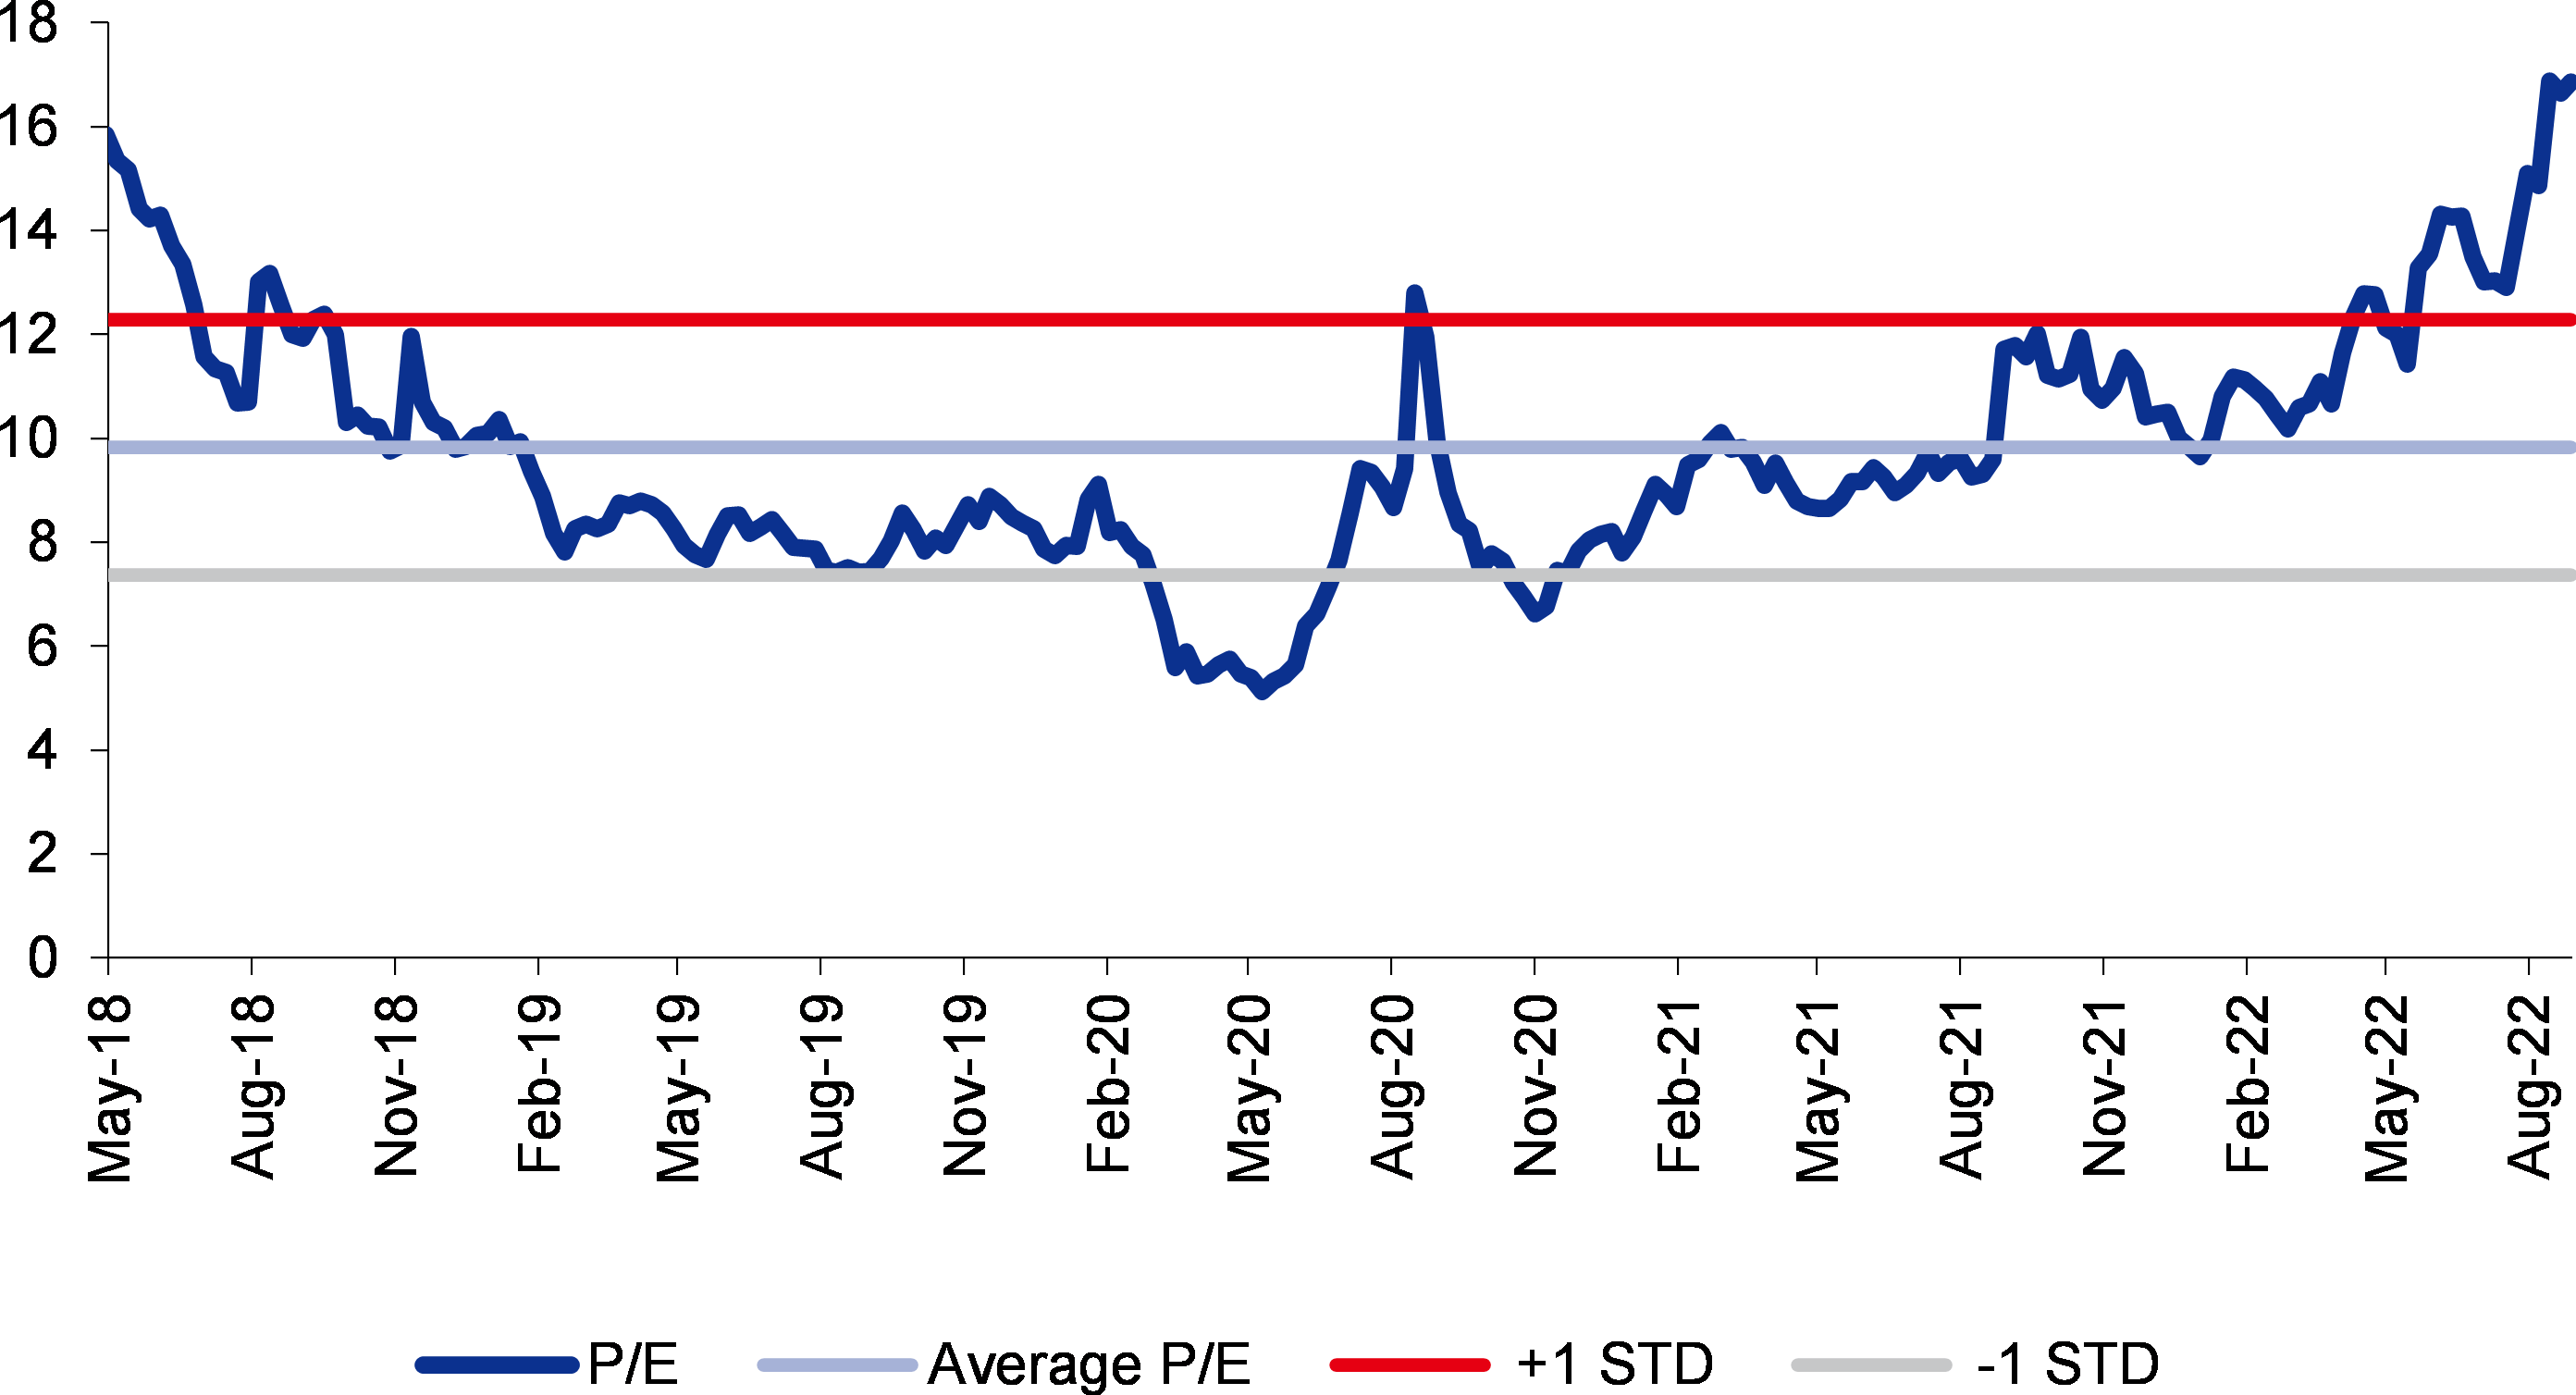
Figure 6: One-year forward P/E ratio is above +1SD
SOURCE: INCRED RESEARCH, COMPANY REPORTS


Figure 7: Sector comparison

Company

Bloomberg Ticker

Recom.

Price

TP

Mkt cap

P/E (x)

P/BV (x)

EV/EBITDA (x)

Dividend Yield (%)

Rs

Rs

(US$ m)

FY23F

FY24F

FY25F

FY23F

FY24F

FY25F

FY23F

FY24F

FY25F

FY23F

FY24F

FY25F

ABB India

ABB IN

Reduce

3,196

2,435

7,238

95

75

63

16.7

13.9

12.0

70

54

45

0.2

0.2

0.2

Bharat Heavy Electricals

BHEL IN

Reduce

59

38

2,266

-132

33

18

0.8

0.8

0.7

137

17

10

(0.4)

1.5

2.8

Cummins India

KKC IN

Add

1,207

1,350

4,134

37

31

28

6.4

5.8

5.2

31

25

22

1.5

1.6

1.6

Larsen & Toubro

LT IN

Add

1,881

1,900

32,273

25

20

18

3.2

2.9

2.6

16

14

12

1.1

1.1

1.2

Siemens India

SIEM IN

Hold

2,848

2,500

12,555

76

58

49

8.7

7.8

7.0

51

39

33

0.4

0.4

0.5

Thermax

TMX IN

Hold

2,468

2,165

3,093

61

45

37

7.2

6.4

5.6

42

31

25

0.4

0.5

0.5

Voltas

VOLT IN

Hold

992

1,020

4,080

58

47

37

5.6

5.2

4.8

44

36

29

0.7

0.8

0.8

KEC International

KECI IN 

Add

403

500

1,306

26

14

9

2.6

2.2

1.9

13

8

6

0.8

1.5

2.1

SKF

SKF IN 

Add

4,637

4,515

2,685

42

35

31

12.2

9.8

7.9

30

25

22

0.4

0.4

0.4

Schaeffler

SCHFL IN 

Add

2,999

2,900

5,580

55

47

40

12.8

11.0

9.4

36

31

27

0.5

0.6

0.7

Timken

TMKN IN 

Hold

2,967

2,320

2,827

54

46

41

10.9

8.9

7.3

35

31

28

0.1

0.1

0.1

Bharat Electronics

BHE IN 

Add

309

300

8,620

25

23

20

5.5

4.9

4.3

19

18

15

1.7

1.9

2.2

Bharat Dynamics

BDL IN 

Add

811

575

1,987

20

18

16

4.3

3.8

3.3

13

11

10

2.0

2.2

2.4

Hindustan Aeronautics

HNAL IN 

Add

2,290

2,515

9,063

18

16

14

3.4

2.9

2.6

9

8

7

1.5

1.6

1.9

SOURCE: INCRED RESEARCH, COMPANY REPORTS


BY THE NUMBERS

Profit & Loss
(Rs mn) Mar-21A Mar-22A Mar-23F Mar-24F Mar-25F
Total Net Revenues 227,546 246,202 258,337 275,432 305,905
Gross Profit 117,034 146,160 136,919 146,806 162,130
Operating EBITDA 53,469 54,128 62,892 68,659 77,900
Depreciation And Amortisation (11,776) (11,099) (11,907) (12,580) (13,420)
Operating EBIT 41,693 43,030 50,984 56,080 64,481
Financial Income/(Expense) (2,591) (581) (100) (100) (100)
Pretax Income/(Loss) from Assoc.
Non-Operating Income/(Expense) 3,587 9,863 8,172 8,572 8,872
Profit Before Tax (pre-EI) 42,689 52,312 59,057 64,552 73,253
Exceptional Items
Pre-tax Profit 42,689 52,312 59,057 64,552 73,253
Taxation (10,379) (1,447) (15,355) (16,784) (19,046)
Exceptional Income - post-tax
Profit After Tax 32,309 50,865 43,702 47,769 54,207
Minority Interests
Preferred Dividends
FX Gain/(Loss) - post tax
Other Adjustments - post-tax
Net Profit 32,309 50,865 43,702 47,769 54,207
Recurring Net Profit 32,309 50,865 43,702 47,769 54,207
Fully Diluted Recurring Net Profit 32,309 50,865 43,702 47,769 54,207
Cash Flow
(Rs mn) Mar-21A Mar-22A Mar-23F Mar-24F Mar-25F
EBITDA 53,469 54,128 62,892 68,659 77,900
Cash Flow from Invt. & Assoc. (10,760) (1,817) (3,835) (4,107) (4,647)
Change In Working Capital 91,651 12,589 (17,390) (19,706) (22,422)
(Incr)/Decr in Total Provisions 115 56
Other Non-Cash (Income)/Expense 12,414 12,863 11,907 12,580 13,420
Other Operating Cashflow 11,282 37,332
Net Interest (Paid)/Received (1,711) 3,662 8,072 8,472 8,772
Tax Paid (7,186) (10,532) (15,355) (16,784) (19,046)
Cashflow From Operations 152,696 100,958 30,147 32,169 36,433
Capex (7,619) (7,989) (12,000) (12,000) (12,000)
Disposals Of FAs/subsidiaries 12 32
Acq. Of Subsidiaries/investments (504) (2,448)
Other Investing Cashflow (4,699) (117,229) 8,172 8,572 8,872
Cash Flow From Investing (12,811) (127,634) (3,828) (3,428) (3,128)
Debt Raised/(repaid) (58,598) (91)
Proceeds From Issue Of Shares
Shares Repurchased
Dividends Paid (10,032) (13,376) (11,492) (12,561) (14,254)
Preferred Dividends
Other Financing Cashflow (2,620) (24) (100) (100) (100)
Cash Flow From Financing (71,249) (13,491) (11,592) (12,661) (14,354)
Total Cash Generated 68,637 (40,167) 14,728 16,080 18,951
Free Cashflow To Equity 81,288 (26,767) 26,320 28,742 33,305
Free Cashflow To Firm 142,477 (26,095) 26,420 28,842 33,405

BY THE NUMBERS…cont’d

Balance Sheet
(Rs mn) Mar-21A Mar-22A Mar-23F Mar-24F Mar-25F
Total Cash And Equivalents 71,663 143,436 163,820 179,900 198,851
Total Debtors 56,394 46,416 53,083 56,596 62,857
Inventories 165,603 143,636 155,710 166,014 184,381
Total Other Current Assets 119,043 138,826 145,668 155,308 172,490
Total Current Assets 412,703 472,313 518,280 557,817 618,579
Fixed Assets 95,598 92,300 92,393 91,813 90,393
Total Investments 9,891 12,941 12,941 12,941 12,941
Intangible Assets
Total Other Non-Current Assets
Total Non-current Assets 105,490 105,242 105,334 104,755 103,335
Short-term Debt
Current Portion of Long-Term Debt
Total Creditors 22,462 25,598 26,859 28,637 31,805
Other Current Liabilities 342,599 364,972 371,905 373,878 390,099
Total Current Liabilities 365,060 390,570 398,764 402,514 421,904
Total Long-term Debt 91
Hybrid Debt - Debt Component
Total Other Non-Current Liabilities
Total Non-current Liabilities 91
Total Provisions
Total Liabilities 365,151 390,570 398,764 402,514 421,904
Shareholders Equity 153,566 192,640 224,850 260,058 300,011
Minority Interests
Total Equity 153,566 192,640 224,850 260,058 300,011
Key Ratios
(Rs mn) Mar-21A Mar-22A Mar-23F Mar-24F Mar-25F
Revenue Growth 6.1% 8.2% 4.9% 6.6% 11.1%
Operating EBITDA Growth 10.0% 1.2% 16.2% 9.2% 13.5%
Operating EBITDA Margin 23.5% 22.0% 24.3% 24.9% 25.5%
Net Cash Per Share (Rs) 214.04 428.95 489.91 538.00 594.67
BVPS (Rs) 459.25 576.10 672.42 777.71 897.19
Gross Interest Cover 16.09 74.01 509.84 560.80 644.81
Effective Tax Rate 24.3% 2.8% 26.0% 26.0% 26.0%
Net Dividend Payout Ratio 31.0% 26.3% 26.3% 26.3% 26.3%
Accounts Receivables Days 138.13 76.21 70.29 72.67 71.26
Inventory Days 594.74 564.12 449.94 456.47 444.77
Accounts Payables Days (104.62) (87.67) (78.85) (78.74) (76.72)
ROIC (%) 58.2% 140.6% 106.0% 83.4% 73.1%
ROCE (%) 24.3% 24.9% 24.4% 23.1% 23.0%
Return On Average Assets 6.7% 9.4% 7.3% 7.4% 7.8%
Key Drivers
(Rs mn) Mar-21A Mar-22A Mar-23F Mar-24F Mar-25F
Manufacturing 85,640 73,750 65,540 84,940 127,450
yoy growth (%) 1 (14) (11) 30 50
RoH 124,595 155,359 175,838 171,484 158,079
yoy growth (%) 7 25 13 (2) (8)
Total Sales 227,546 247,465 258,337 275,432 305,905
Book to bill ratio 4 4 4 4 3
Order backlog 806,390 821,540 941,660 959,584 982,335
yoy growth (%) 52 2 15 2 2
EBITDA margin 23 22 24 25 25
SOURCES: INCRED RESEARCH, COMPANY REPORTS

DISCLAIMER

This report (including the views and opinions expressed therein, and the information comprised therein) has been prepared by Incred Research Services Private Ltd.(formerly known as Earnest Innovation Partners Private Limited) (hereinafter referred to as “ IRSPL”). IRSPL is registered with SEBI as a Research Analyst vide Registration No. INH000007793. Pursuant to a trademark agreement, IRSPL has adopted “Incred Equities ” as its trademark for use in this report.

The term “IRSPL” shall, unless the context otherwise requires, mean IRSPL and its affiliates, subsidiaries and related companies. This report is not directed or intended for distribution to or use by any person or entity resident in a state, country or any jurisdiction, where such distribution, publication, availability or use would be contrary to law, regulation or which would subject IRSPL and its affiliates/group companies to registration or licensing requirements within such jurisdictions.

This report is being supplied to you strictly on the basis that it will remain confidential. No part of this report may be (i) copied, photocopied, duplicated, stored or reproduced in any form by any means; or (ii) redistributed or passed on, directly or indirectly, to any other person in whole or in part, for any purpose without the prior written consent of IRSPL.

The information contained in this report is prepared from data believed to be correct and reliable at the time of issue of this report.

IRSPL is not required to issue regular reports on the subject matter of this report at any frequency and it may cease to do so or change the periodicity of reports at any time. IRSPL is not under any obligation to update this report in the event of a material change to the information contained in this report. IRSPL has not any and will not accept any, obligation to (i) check or ensure that the contents of this report remain current, reliable or relevant; (ii) ensure that the content of this report constitutes all the information a prospective investor may require; (iii) ensure the adequacy, accuracy, completeness, reliability or fairness of any views, opinions and information, and accordingly, IRSPL and its affiliates/group companies (and their respective directors, associates, connected persons and/or employees) shall not be liable in any manner whatsoever for any consequences (including but not limited to any direct, indirect or consequential losses, loss of profits and damages) of any reliance thereon or usage thereof.

Unless otherwise specified, this report is based upon reasonable sources. Such sources will, unless otherwise specified, for market data, be market data and prices available from the main stock exchange or market where the relevant security is listed, or, where appropriate, any other market. Information on the accounts and business of company(ies) will generally be based on published statements of the company(ies), information disseminated by regulatory information services, other publicly available information and information resulting from our research. Whilst every effort is made to ensure that statements of facts made in this report are accurate, all estimates, projections, forecasts, expressions of opinion and other subjective judgments contained in this report are based on assumptions considered to be reasonable as of the date of the document in which they are contained and must not be construed as a representation that the matters referred to therein will occur. Past performance is not a reliable indicator of future performance. The value of investments may go down as well as up and those investing may, depending on the investments in question, lose more than the initial investment. No report shall constitute an offer or an invitation by or on behalf of IRSPL and its affiliates/group companies to any person to buy or sell any investments.

The opinions expressed are based on information which are believed to be accurate and complete and obtained through reliable public or other non-confidential sources at the time made. (Information barriers and other arrangements may be established where necessary to prevent conflicts of interests arising. However, the analyst(s) may receive compensation that is based on his/their coverage of company(ies) in the performance of his/their duties or the performance of his/their recommendations. In reviewing this report, an investor should be aware that any or all of the foregoing, among other things, may give rise to real or potential conflicts of interest. Additional information is, subject to the duties of confidentiality, available on request.

The report is not a “prospectus” as defined under Indian Law, including the Companies Act, 2013, and is not, and shall not be, approved by, or filed or registered with, any Indian regulator, including any Registrar of Companies in India, SEBI, any Indian stock exchange, or the Reserve Bank of India. No offer, or invitation to offer, or solicitation of subscription with respect to any such securities listed or proposed to be listed in India is being made, or intended to be made, to the public, or to any member or section of the public in India, through or pursuant to this report.

The research analysts, strategists or economists principally responsible for the preparation of this research report are segregated from the other activities of IRSPL. Information barriers and other arrangements have been established, as required, to prevent any conflicts of interests.

The research analysts, strategists or economists principally responsible for the preparation of this research report are segregated from the other activities of IRSPL. Information barriers and other arrangements have been established, as required, to prevent any conflicts of interests.

IRSPL may have issued other reports (based on technical analysis, event specific, short term views etc.) that are inconsistent with and reach different conclusion from the information presented in this report.

Holding of Analysts/Relatives of Analysts, IRSPL and Associates of IRSPL in the covered securities, as on the date of publishing of this report

Analyst/ Relative Entity/ Associates
any financial interests in the company covered in this report (subject company) and nature of such financial interest NO NO
actual/beneficial ownership of 1% or more in securities of the subject company at the end of the month immediately preceding the date of publication of the research report or date of the public appearance; NO NO
any other material conflict of interest at the time of publication of the research report or at the time of public appearance NO NO
received any compensation from the subject company in the past twelve months for investment banking or merchant banking or brokerage services or investment advisory or depository or distribution from the subject company in the last twelve months for products/services other than investment banking or merchant banking or broker- age services or investment advisory or depository or distribution from the subject company in the last twelve months NO NO
managed or co-managed public offering of securities for the subject company in the last twelve months NO NO
received any compensation or other benefits from the subject company or third party in connection with the research report NO NO
served as an officer, director or employee of the subject company NO NO
been engaged in market making activity for the subject company NO NO
Analyst declaration
  • The analyst responsible for the production of this report hereby certifies that the views expressed herein accurately and exclusively reflect his or her personal views and opinions about any and all of the issuers or securities analysed in this report and were prepared independently and autonomously in an unbiased manner.
  • No part of the compensation of the analyst(s) was, is, or will be directly or indirectly related to the inclusion of specific recommendations(s) or view(s) in this report or based any specific investment banking transaction.
  • The analyst(s) has(have) not had any serious disciplinary action taken against him/her(them). • The analyst, strategist, or economist does not have any material conflict of interest at the time of
  • publication of this report.
  • The analyst(s) has(have) received compensation based upon various factors, including quality, accuracy and value of research, overall firm performance, client feedback and competitive factors.

IRSPL and/or its affiliates and/or its Directors/employees may own or have positions in securities of the company(ies) covered in this report or any securities related thereto and may from time to time add to or dispose of, or may be materially interested in, any such securities.

IRSPL and/or its affiliates and/or its Directors/employees may do and seek to do business with the company(ies) covered in this research report and may from time to time (a) buy/sell the securities covered in this report, from time to time and/or (b) act as market maker or have assumed an underwriting commitment in securities of such company(ies), and/or (c) may sell them to or buy them from customers on a principal basis and/or (d) may also perform or seek to perform significant investment banking, advisory, underwriting or placement services for or relating to such company(ies) and/or (e) solicit such investment, advisory or other services from any entity mentioned in thisreport and/or (f) act as a lender/borrower to such company and may earn brokerage or other compensation. However, Analysts are forbidden to acquire, on their own account or hold securities (physical or uncertificated, including derivatives) of companies in respect of which they are compiling and producing financial recommendations or in the result of which they play a key part.