* price as on January 01, 0001
India
Consensus ratings*: Buy 18 Hold 5 Sell 1
Previous target: 214
Up/downside: 34.4%
Reuters
Bloomberg: EXID IN
Market cap: US$1,869m
Rs135,745m
Average daily turnover: US$4.6m
Current shares o/s: 850.0m
Free float: 54.0%
*Source: Bloomberg

Key changes in this note

Net sales raised by 8-10% for FY23F-24F.

EBITDA cut by 2-7% for FY23F-24F.

EPS cut by 4-10% for FY23F-24F.

*Source: Bloomberg

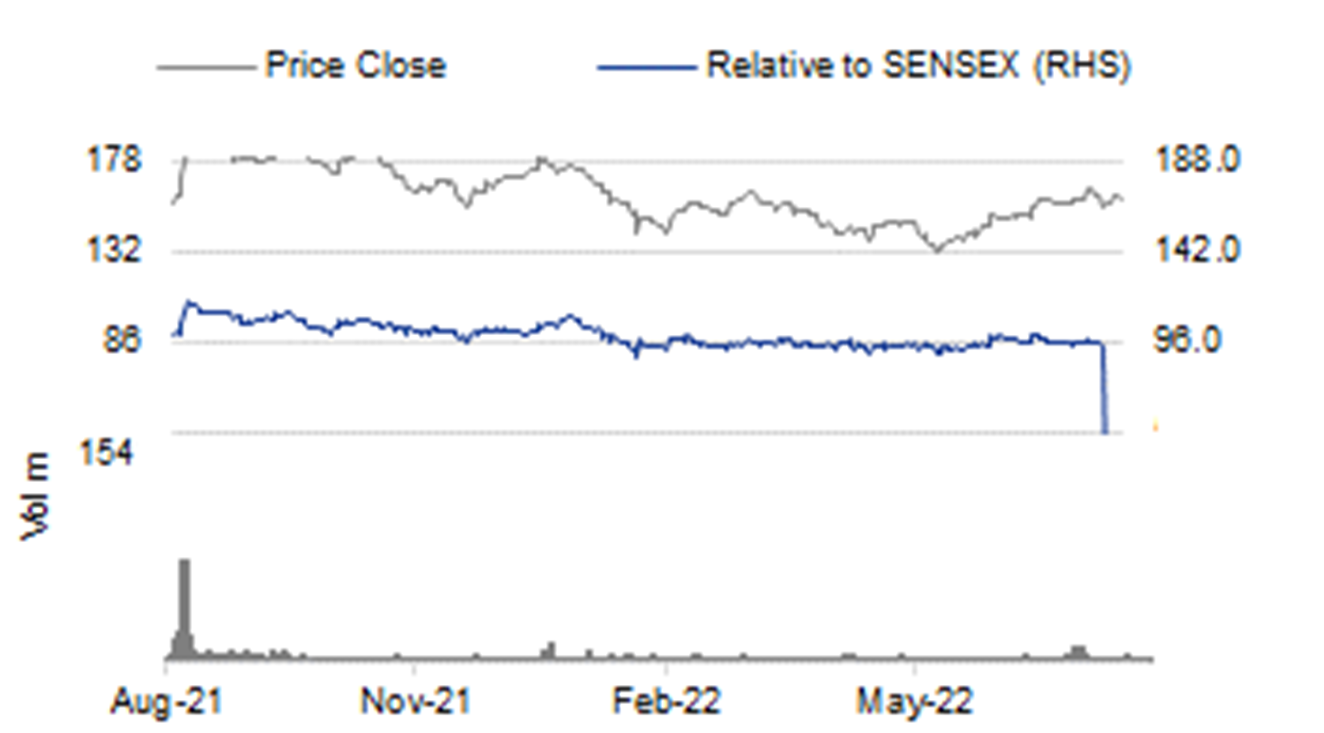
Price performance
1M 3M 12M
Absolute (%) 0.8 10.3 1.3
Relative (%) 0.1 6.4 (0.6)
Major shareholders
% held
Raheja Family 46.0
LIC 5.5
ICICI Prudential Mutual Fund 2.5
Analyst(s)

Pramod AMTHE

T (91) 22 4161 1541
E pramod.amthe@incredcapital.com

Hitesh THAKURANI

T (91) 22 4161 1554
E hitesh.thakurani@incredcapital.com

Sales growth momentum fails to boost EPS

Strong sales momentum, aided by the industrial division and exports, is much ahead of peers which is impressive, leading to an upgrade in sales estimates.

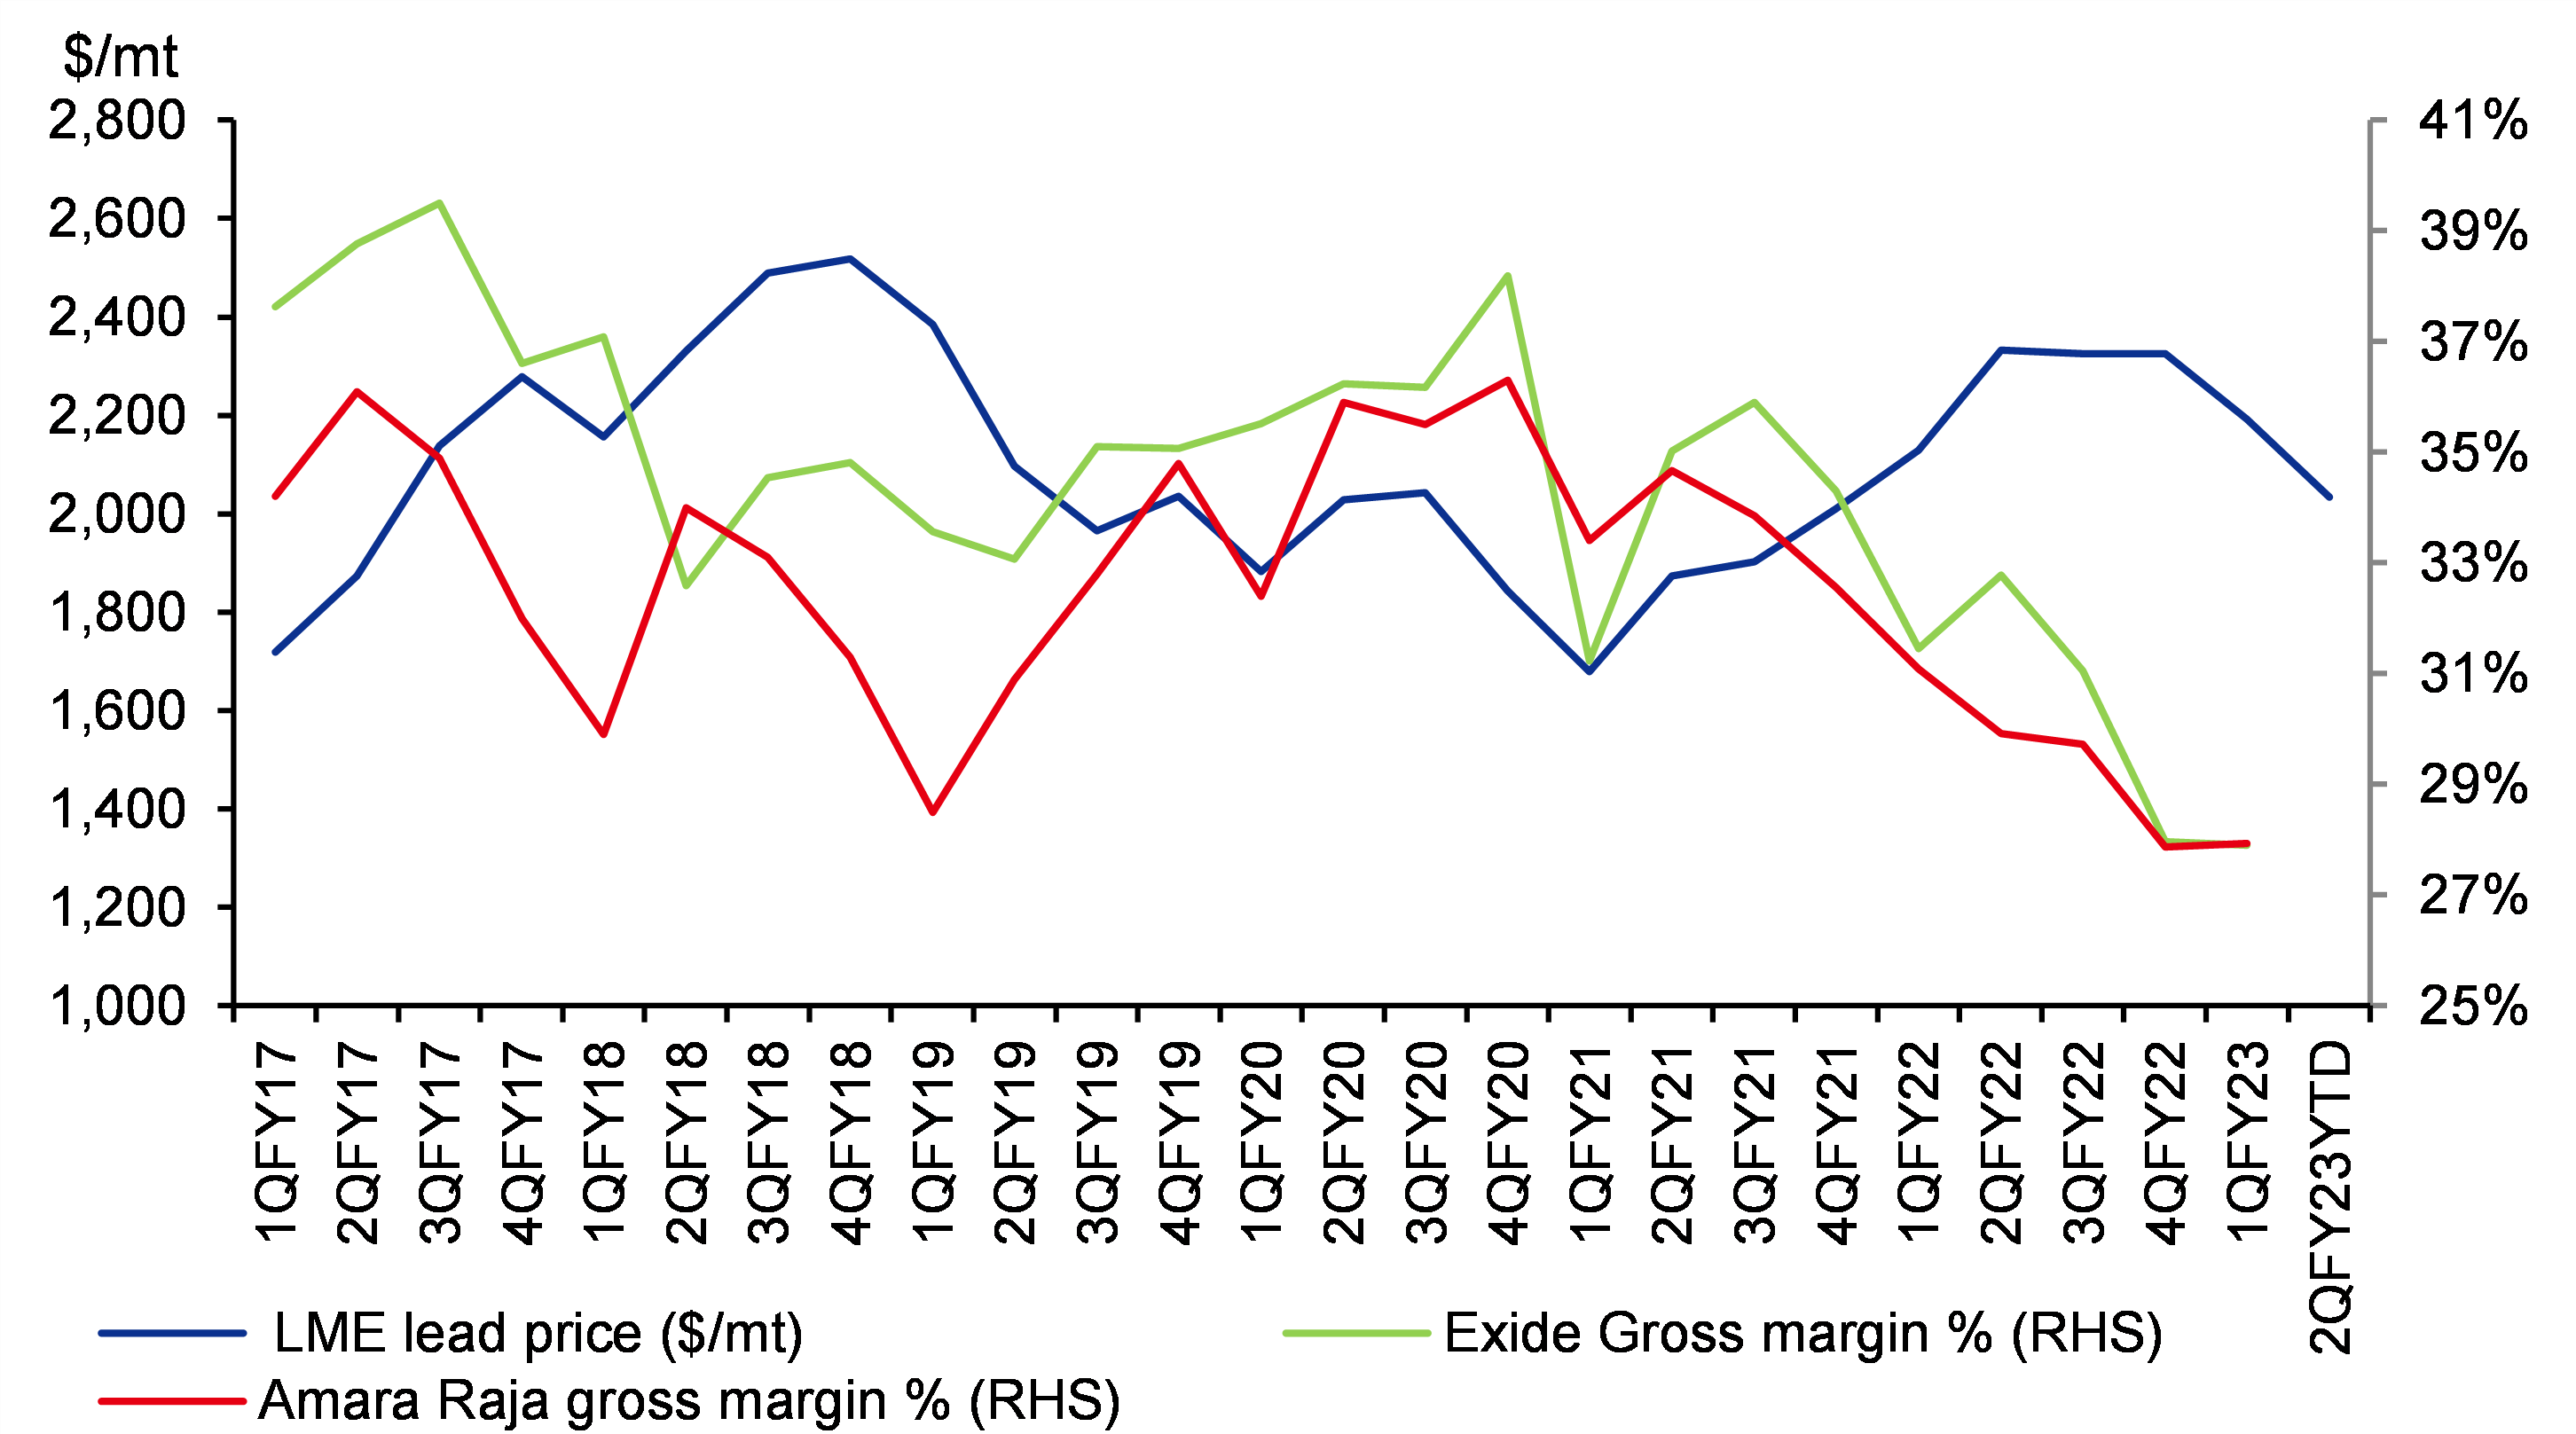
However, prolonged lead cost pressure on EBITDA margin led to a cut in EPS.

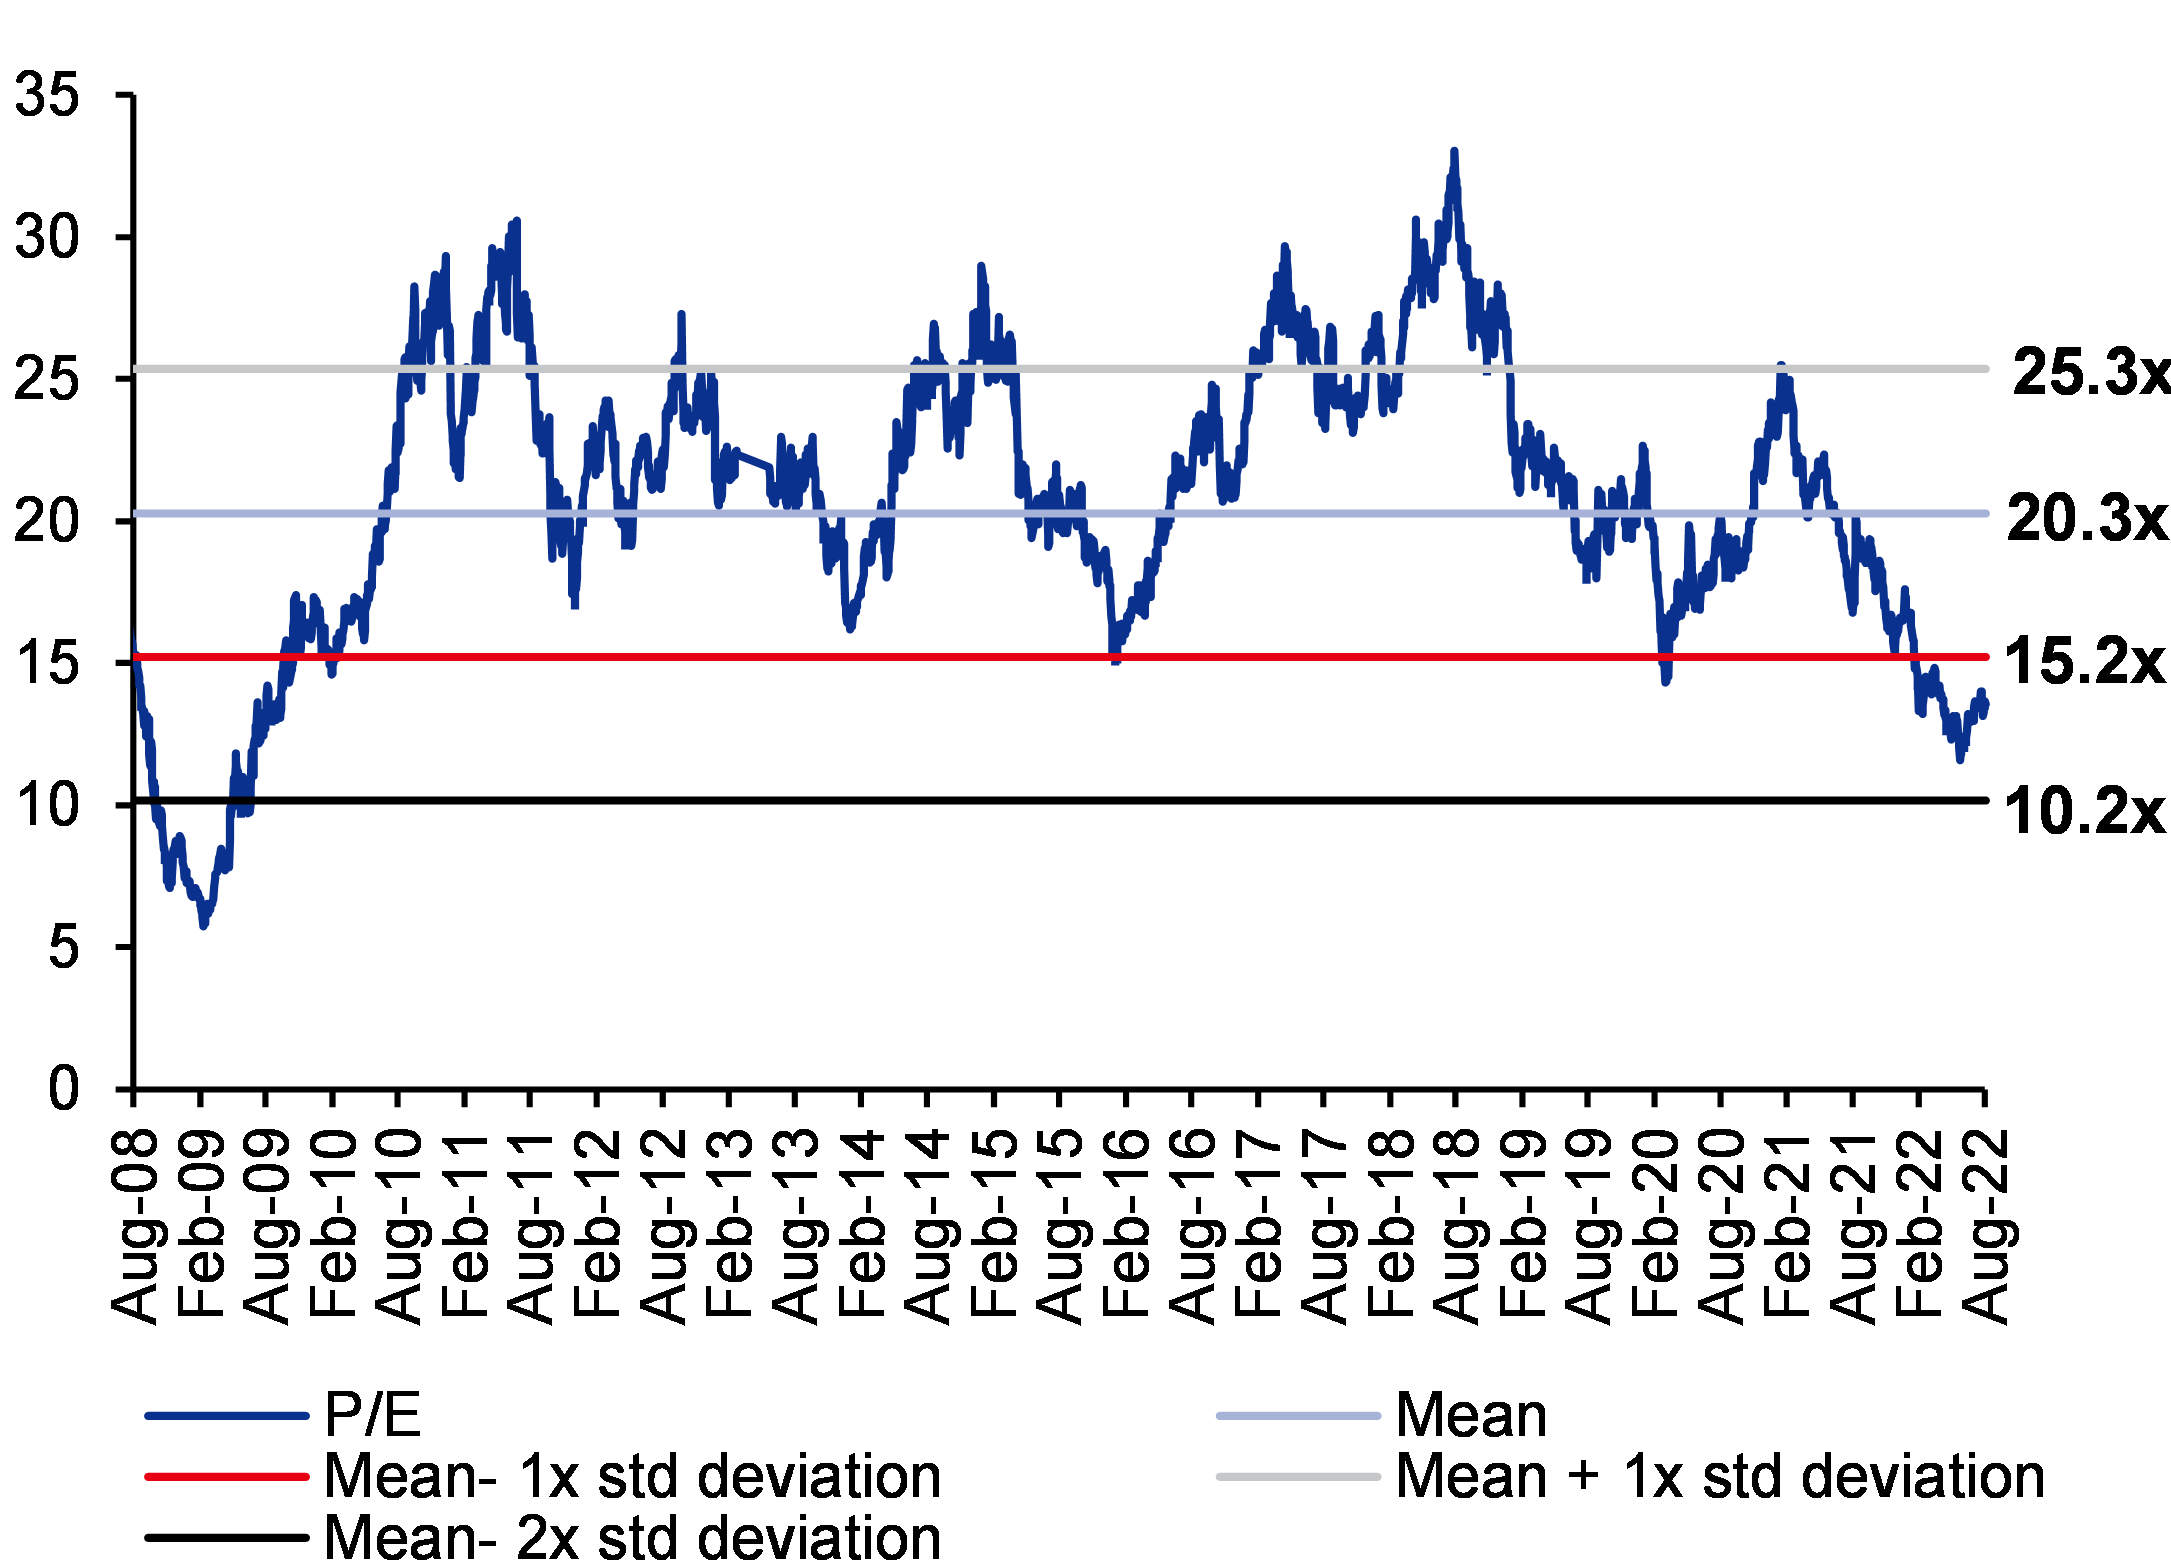
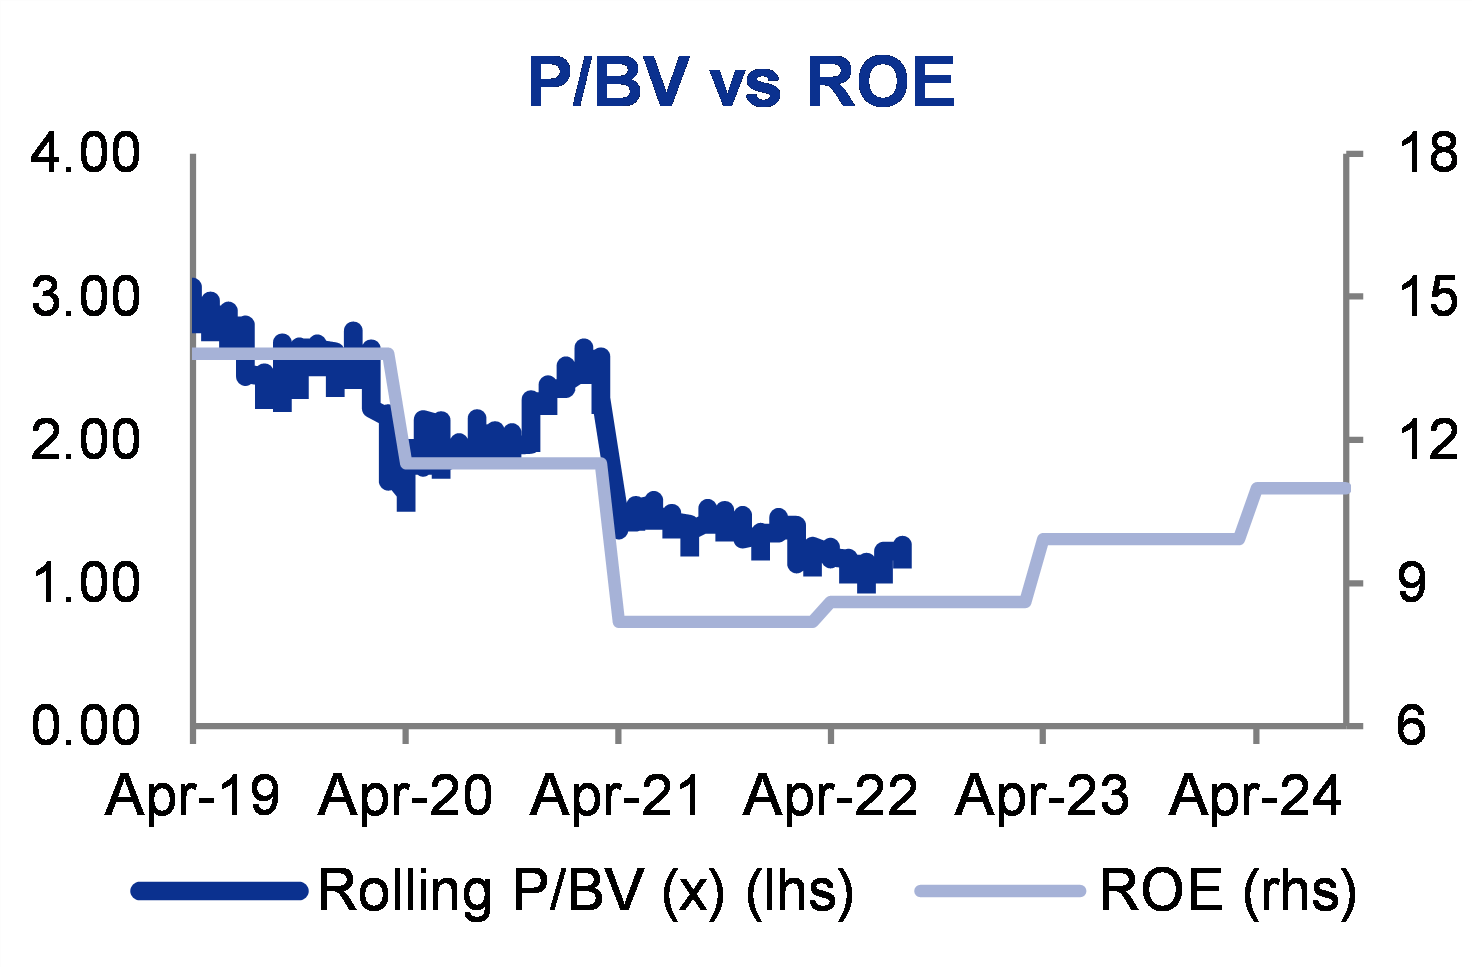
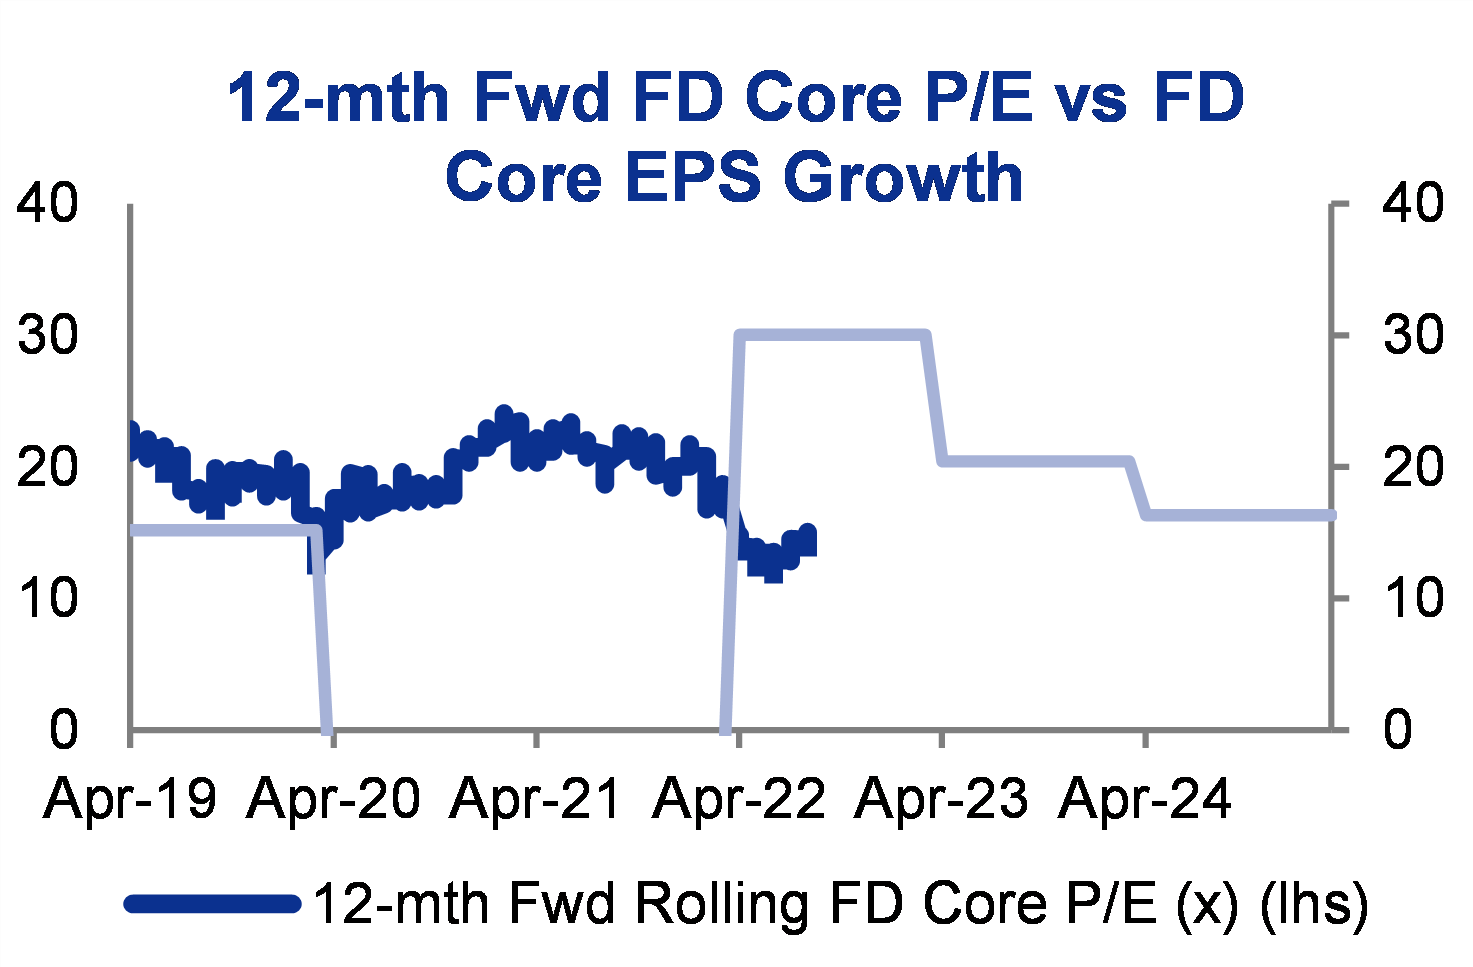
With P/E and P/BV valuation below 15-year -1SD and -2SD, respectively, we feel the lithium-ion battery risk is well captured. Retain Add rating on the stock.

Strong sales momentum for the year

Exide Industries’ 1QFY23 EBITDA was 8% above ours and Bloomberg consensus estimate at Rs3.9bn, up 48% yoy and 11% qoq. Sales growth revival (up 14% qoq) is key highlight of the quarter, beating our/Bloomberg consensus estimates by a big margin. This helped overcome EBITDA margin disappointment (210bp) because of higher raw material cost. EPS at Rs2.66 showed a growth of 49% qoq, beating our estimate by 11% and 21% Bloomberg consensus estimate, aided by higher other income.

FY22 annual report highlights strong growth in exports & industrials

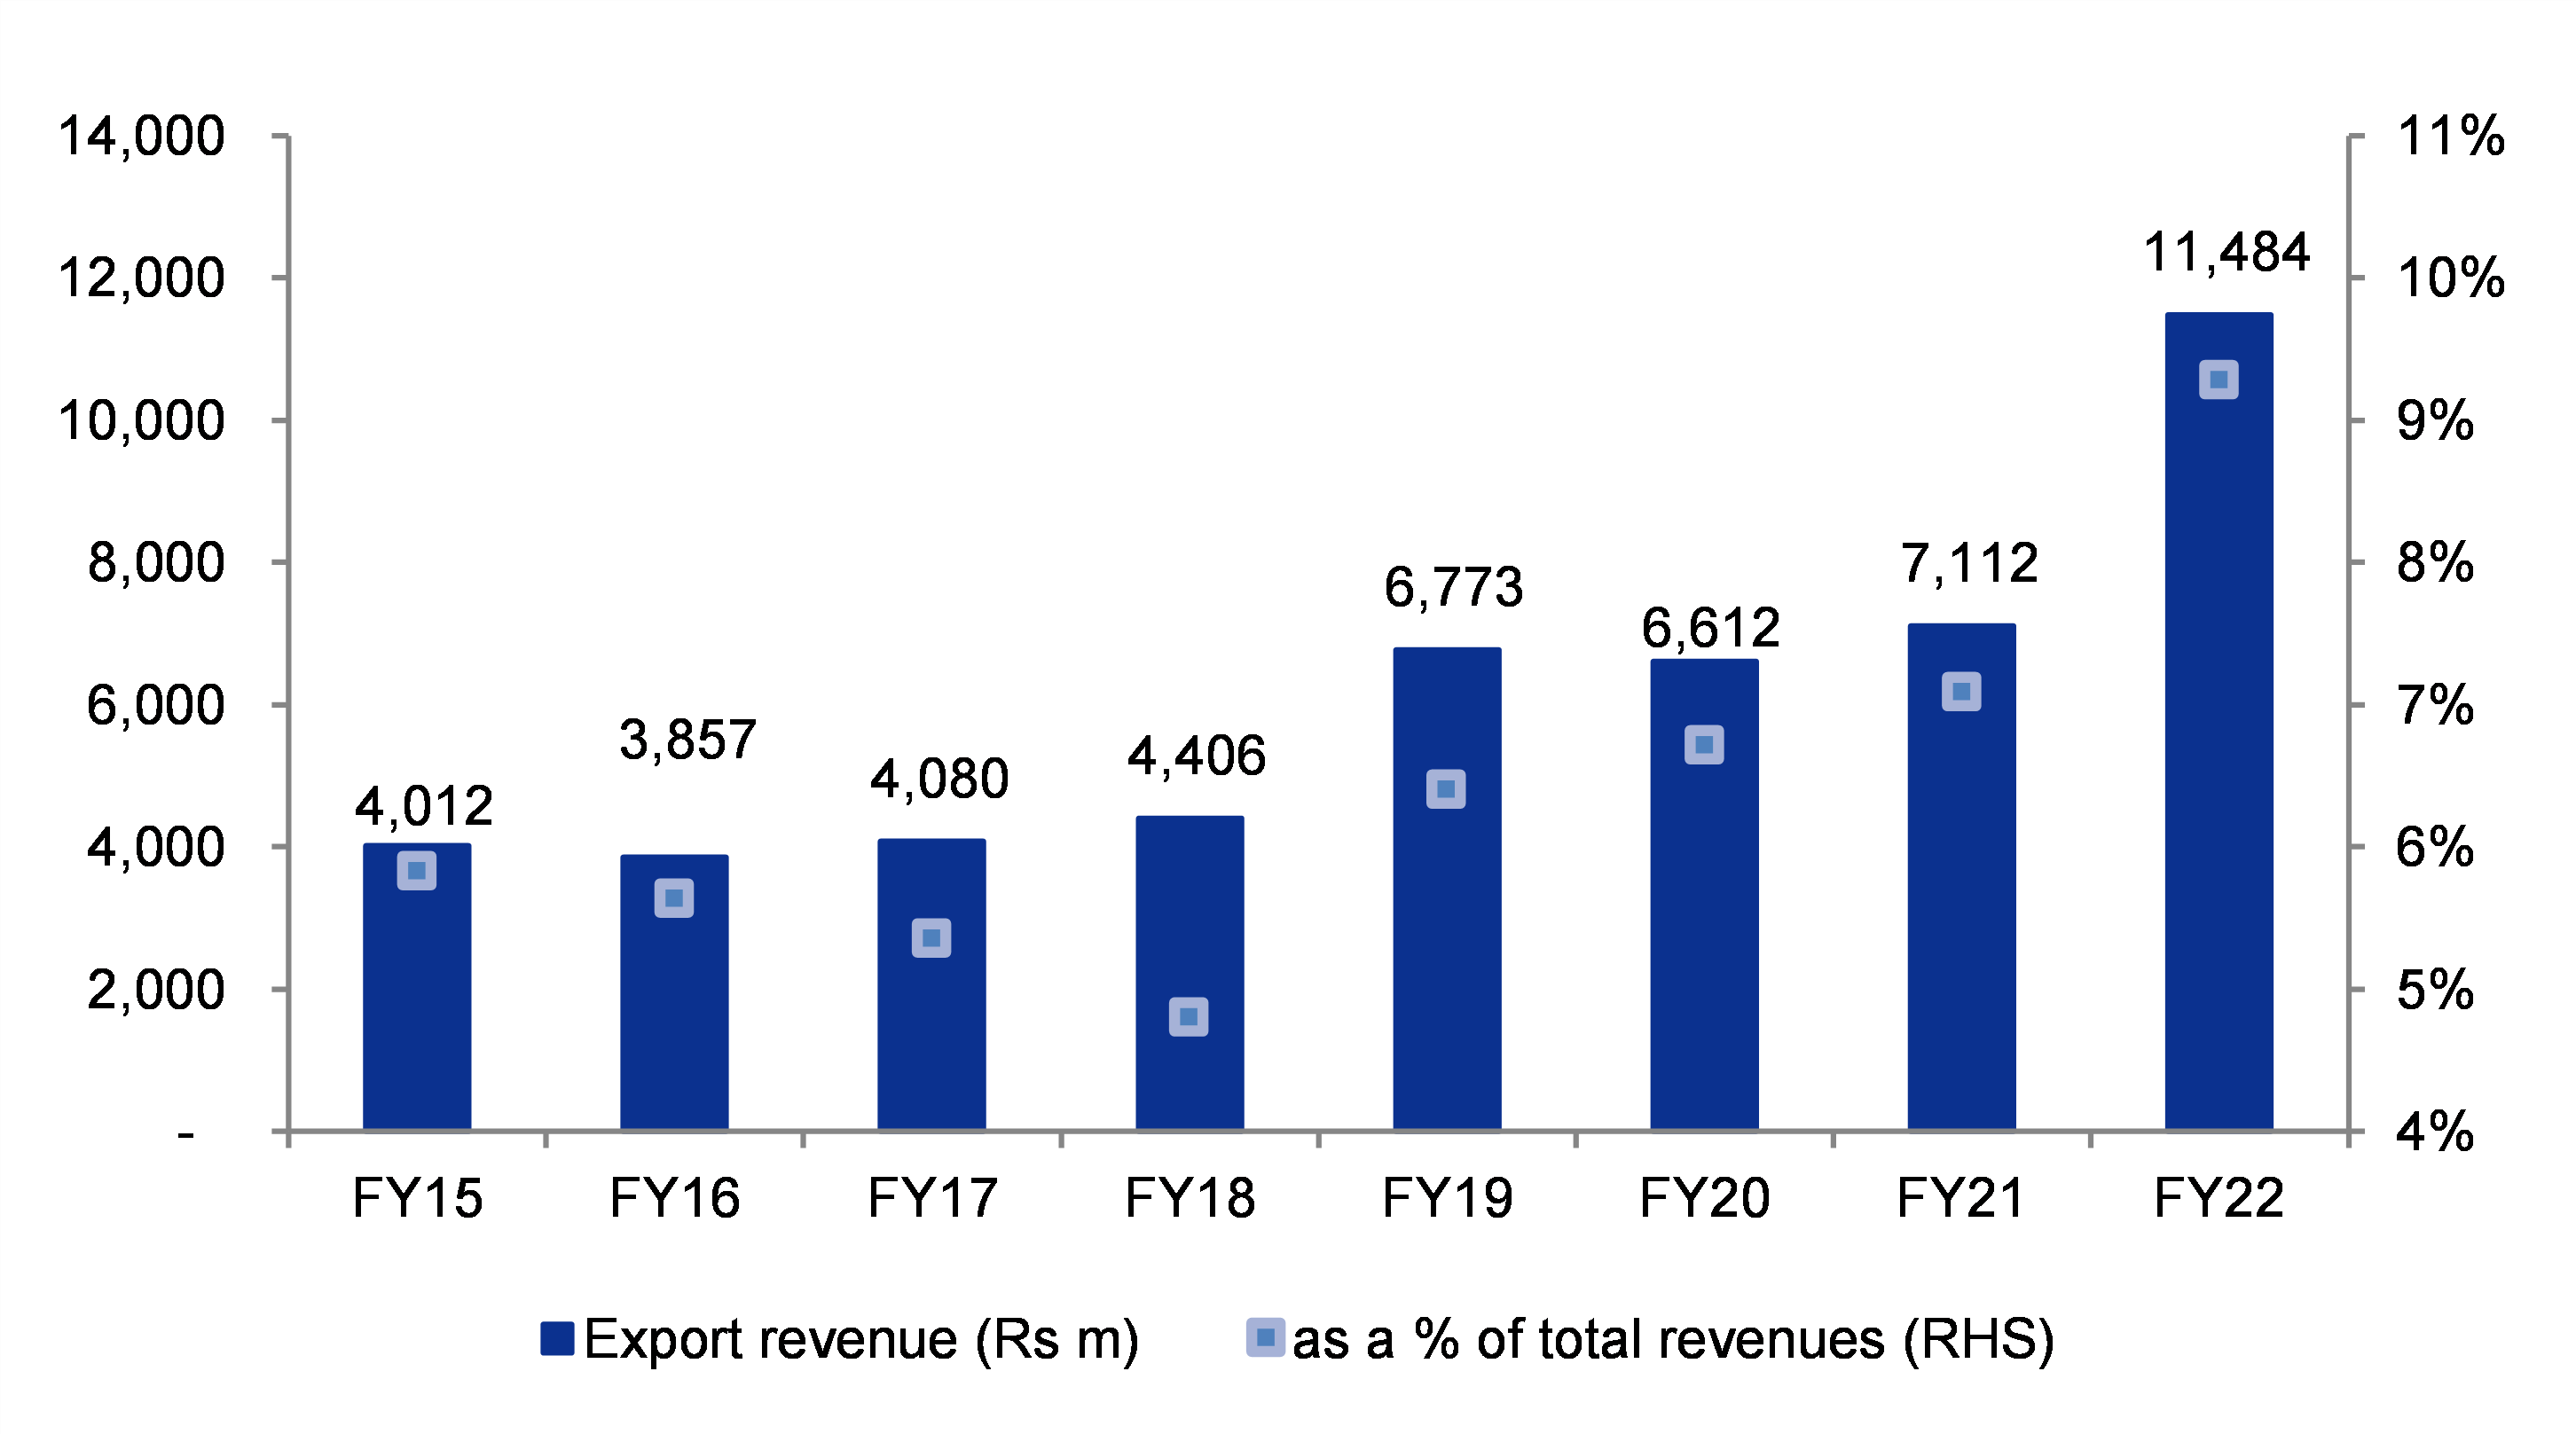
Management highlighted about the company’s higher exports to West Asia, Africa, America, and other regions, a growth of 60% yoy to Rs11.5bn in FY22. Exports through its collaborator East Penn helped expand in North American markets with a rise in market share. UPS vertical grew 30% yoy in FY22 on the back of the government’s digitalization push, growth in e-commerce, and the company’s strong service network to support sales. In telecom vertical, sales nearly doubled yoy as it achieved a higher market share because of optimized product portfolio in FY22.   

Margin pressure fails to negate sales momentum benefit

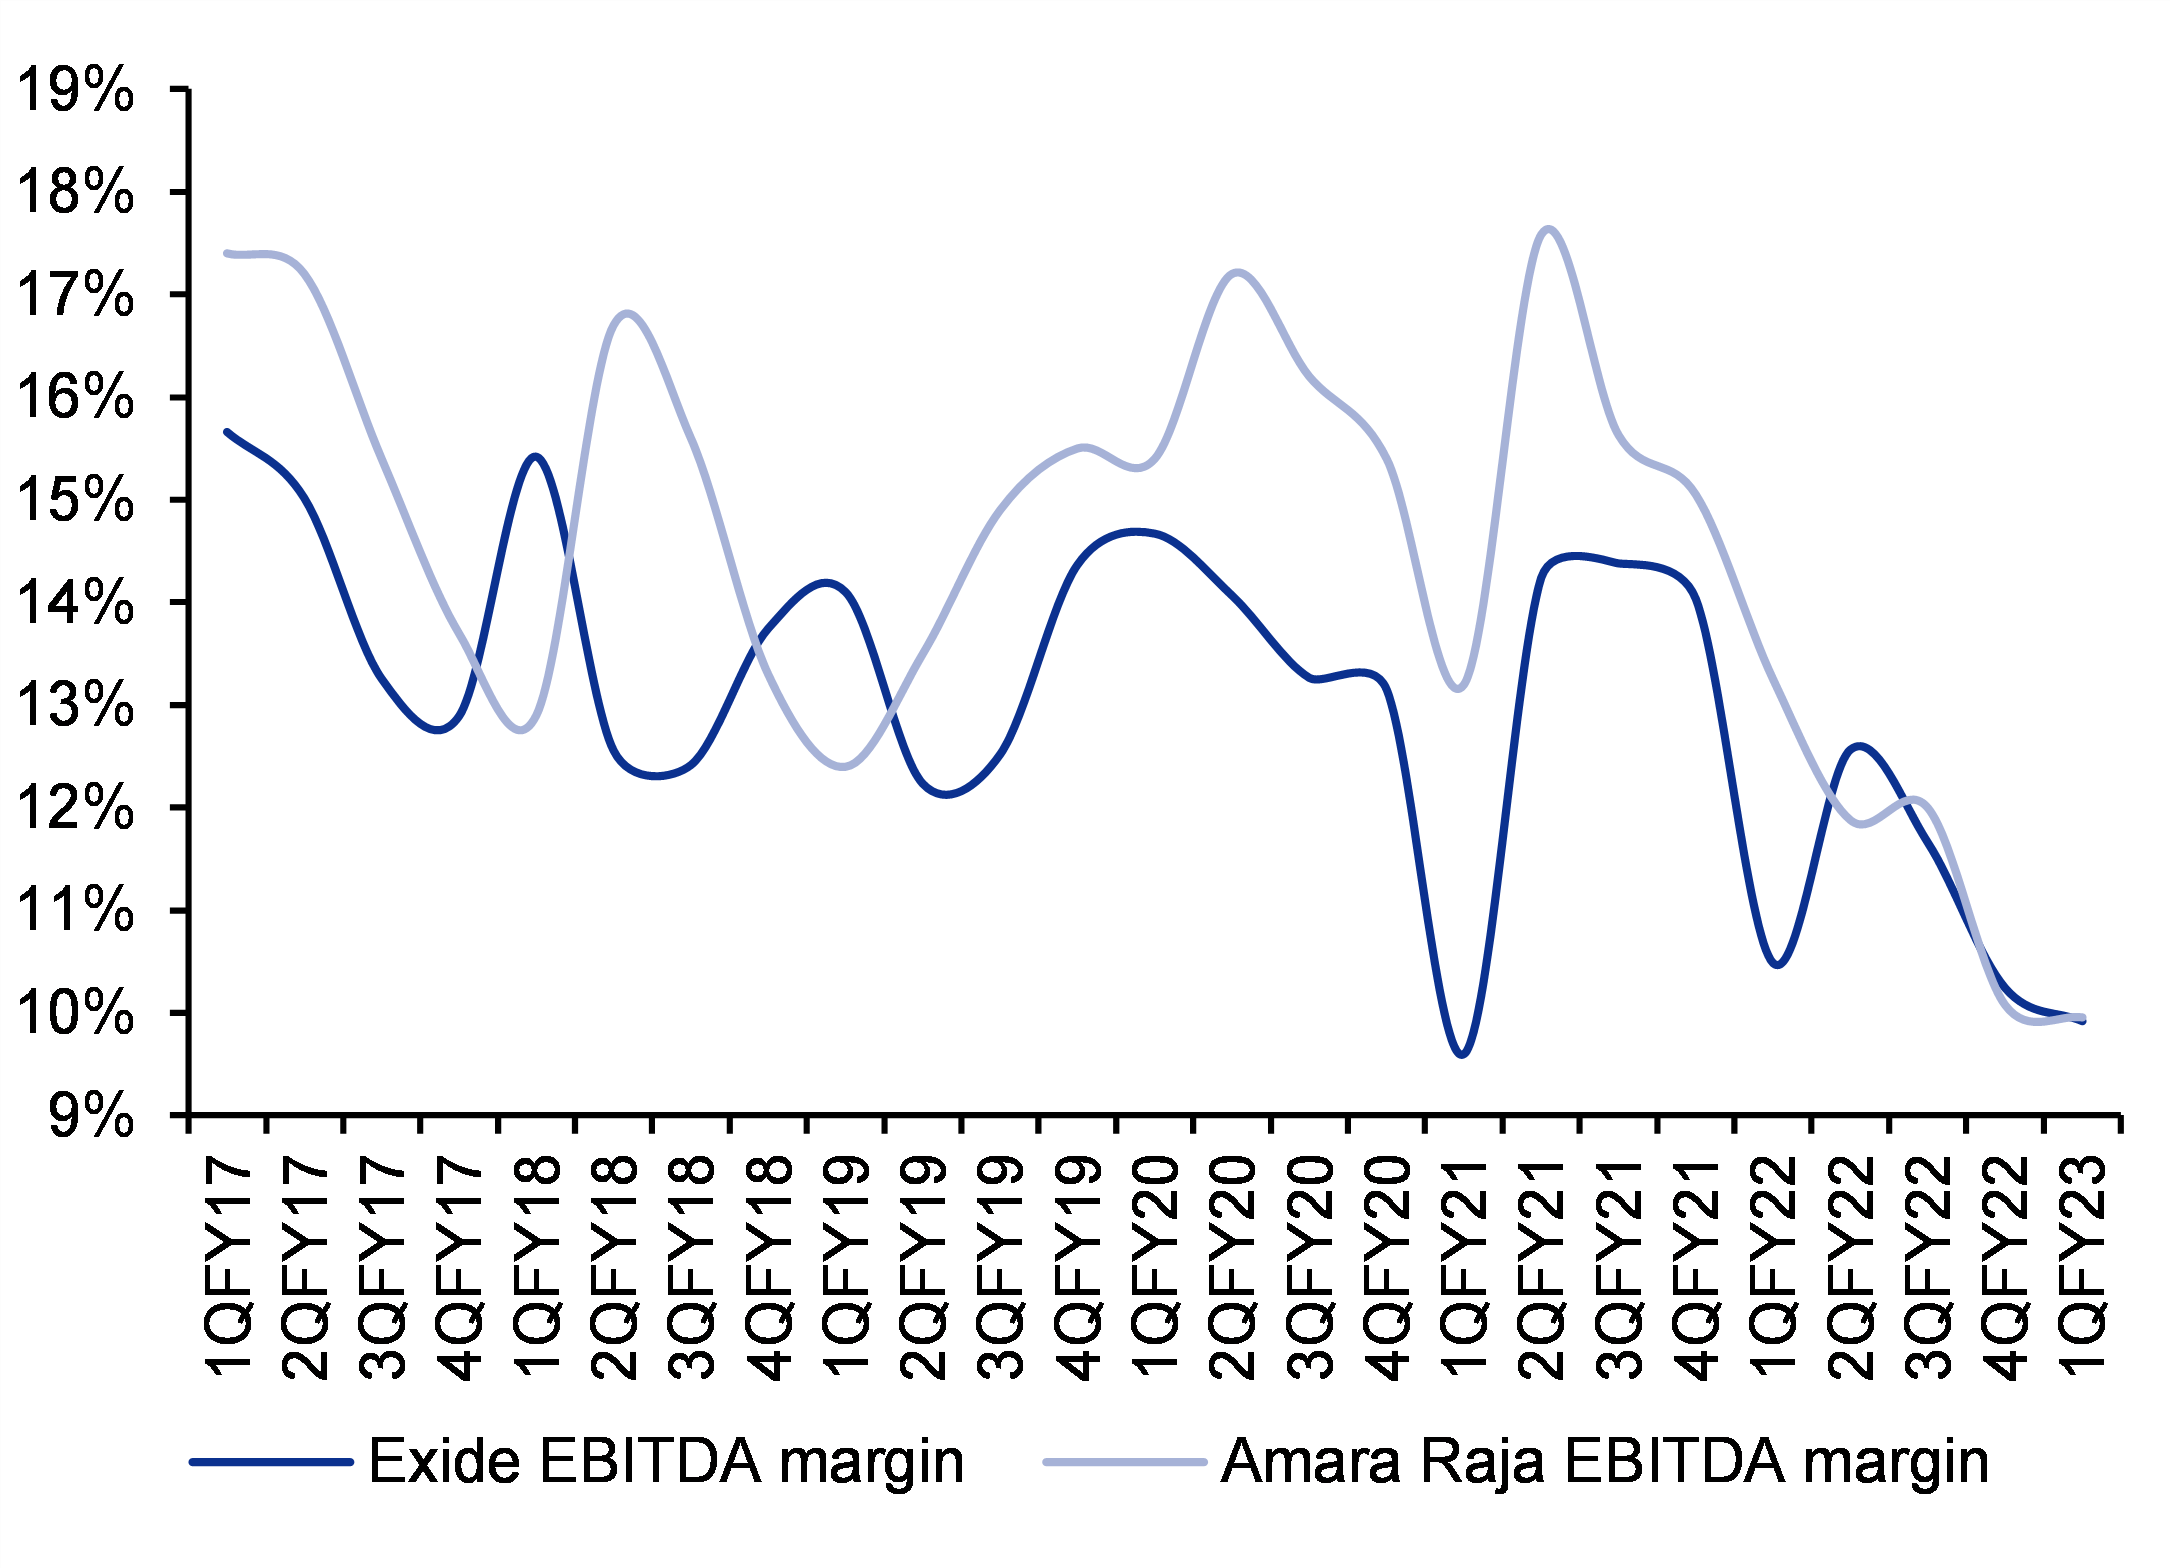
Sales momentum of Exide Industries in the recent quarter was impressive as it beat lead competitor Amara Raja Batteries by a wide margin (Fig. 1). Favourable tailwinds in the industrial division seem to favour the company. However, a gradual pass-through of the rise in lead cost impacted EBITDA margin, leading to a cut in our FY23F-24F EBITDA estimates by 2-7%, despite a 8-10% upgrade in sales estimates. Building in higher interest cost leads to a cut in our EPS estimates by 4-10% for FY23F-24F.  

Maintain Add rating on the stock

We retain Add rating on Exide Industries as its lead-acid battery business continues to generate healthy cashflow, while expansion into lithium-ion battery-making will provide option value for the new electric vehicle or EV business. Considering that the stock’s valuation is very attractive at a 15-year low P/E (-1 SD level) and P/BV (-2 SD level), we roll forward our SOTP-based target price to Rs215 (Rs214 earlier), where the core battery business is valued at 12x one-year EPS and the insurance business is valued at the CMP of HDFC Life Insurance, or Rs46.5 per share, at a 20% holding discount for Exide Industries’ shareholders. Downside risks: Loss of pricing power in lead-acid battery business, and long gestation period for profitability in the new lithium-ion battery business.

Financial Summary
Mar-21A Mar-22A Mar-23F Mar-24F Mar-25F
Revenue (Rsm) 100,408 123,817 145,253 161,010 175,931
Operating EBITDA (Rsm) 13,556 13,956 16,122 18,916 21,674
Net Profit (Rsm) 7,583 7,158 9,307 11,202 13,027
Core EPS (Rs) 8.9 8.4 10.9 13.2 15.3
Core EPS Growth (10.5%) (5.6%) 30.0% 20.4% 16.3%
FD Core P/E (x) 17.90 18.96 14.59 12.12 10.42
DPS (Rs) 3.0 5.0 6.0 7.0 8.0
Dividend Yield 1.88% 3.13% 3.76% 4.38% 5.01%
EV/EBITDA (x) 7.69 5.28 4.53 3.63 2.91
P/FCFE (x) 121.53 34.27 33.04 24.71 18.70
Net Gearing (1.3%) (1.5%) (0.7%) (0.2%) (0.6%)
P/BV (x) 1.97 1.28 1.23 1.18 1.12
ROE 11.5% 8.2% 8.6% 9.9% 11.0%
% Change In Core EPS Estimates (10.50%) (3.71%)
InCred Research/Consensus EPS (x)
INCRED RESEARCH ESTIMATES, COMPANY REPORTS, PRICED AS AT January 01, 0001

Sales growth momentum fails to boost EPS

Industry trends from annual reports of Exide Industries & Amara Raja Batteries

·         Shrinking market for lead-acid batteries: Management expects telecom tower companies to continue to use VRLA (Valve Regulated Lead Acid) batteries, at least for the next two to three years, while running pilot programs for lithium-ion cell batteries. With 5G telecom services to be launched in India soon, the requirement may move in favour of lithium-ion batteries as cell cost reduces, thus posing a threat to existing lead-acid battery players. The replacement of old air-conditioned rail coaches to LHB (Linke Hofmann Busch) rakes by Indian Railways would result in requirement of only a few batteries for running electric utilities. This would further reduce the market for lead-acid batteries. In the material handling equipment segment, replacement of lead-acid batteries with lithium-ion batteries and cheap lead-acid batteries offered by small competitors remain as threats in this market.

·         Case for lead-acid batteries to survive: Amara Raja Batteries (ARBL) stated that electric vehicles still require lead-acid batteries to meet low-voltage electrical requirements. Also, these electrical features are increasing in modern vehicles. ARBL’s management stated that lead-acid batteries are the safest and most dependable power source for critical functions in a vehicle and hence, these batteries will remain. The demand for reliable power solutions has also been increasing with the need for technology, automation, and uninterrupted communication.

·         Industry consolidation: ARBL expects consolidation opportunities in the near term, with respect to the lead-acid battery business.

·         UPS: Pent-up demand after the second wave of Covid-19 pandemic resulted in healthy overall demand in the UPS segment. The OEM business growth was lower due to lack of government/ private project orders but was boosted by rising demand from various sectors such as healthcare, education, and construction as the country’s economy reopened.

·         Telecom: Demand was a mix of increment in O&M (Operations & Maintenance) replacement, energy-saving projects and new site rollouts.

·         Renewable energy: The delay in signing of power sale agreements (PSAs) and lack of clarity regarding applicable duties led to a slowdown in tender and auction activity. The industry faces headwinds because of rapid technology changes, falling cost of renewable energy sources, and rising battery storage system competitiveness.

Exide Industries’ FY22 annual report highlights  

·         Outlook: Management indicated that the company is well positioned considering that the Exide brand continues to strengthen its leadership position while the SF and Dynex brands are witnessing rapid growth. It expects the industrial UPS business to grow in double digits in FY23F, led by the upcoming NXT+ range of products and the stage set by higher government and private spending on infrastructure projects over the last few years. Management expects end-user verticals, which represent a reasonable share of the industrial business, to continue to achieve high growth. For the solar vertical, it expects new products and a large trade network to ensure brand presence and gain market share in the emerging Grid Tie segment. It mentioned that the company’s outlook on the infra power and projects segment is promising as it has been awarded a contract for providing batteries for a nuclear plant. Management indicated that the company is well positioned to secure export orders for submarine batteries in the near term. It foresees strong demand for the traction vertical continuing in FY23F. Management expects a huge opportunity in the 2V standby business in the Middle East, Asia, Africa, and South-East Asian markets while the 12V business is also expected to expand globally. The company cautioned about higher input cost, uncertainty regarding the timely availability of imported components and  ocean freight cost hurting margins.

·         Business plan: Management plans to focus on enhancing the product portfolio, strengthen the company’s position in the domestic market, increase penetration in existing export markets as well as explore new geographies. It targets to increase operational efficiency by revamping the company’s distribution model with a supply chain transformation project. Going ahead, it seeks to improve the product mix towards more premium products to achieve higher growth and better margins. It will also focus on enriching the mix towards the replacement market for IUPS (Industrial Uninterruptible Power Supply) and traction verticals.

·         Product launches in the replacement market: Recent product launches like Exide Integra (lithium-ion battery-based home power back-up system) and Exide Mileage ISS (Idle Start Stop) has strengthened the company’s position in the replacement market.

·         Exports: The company reported higher exports to West Asia, Africa, America, and other regions. There was a degrowth in Southeast Asia as the Covid-19 pandemic slowed down business. Exports through its collaborator East Penn helped the company to expand in North American markets with a rise in market share. It will continue to expand distribution network and add manpower to export markets. The company made significant inroads into the Gulf Cooperation Council (GCC) countries to become a leading supplier of batteries to the region. It will seek to launch new products and technology, explore private labelling and contract manufacturing possibilities along with investment in brand development. The company started exports to newer markets such as France and South Korea in FY22.

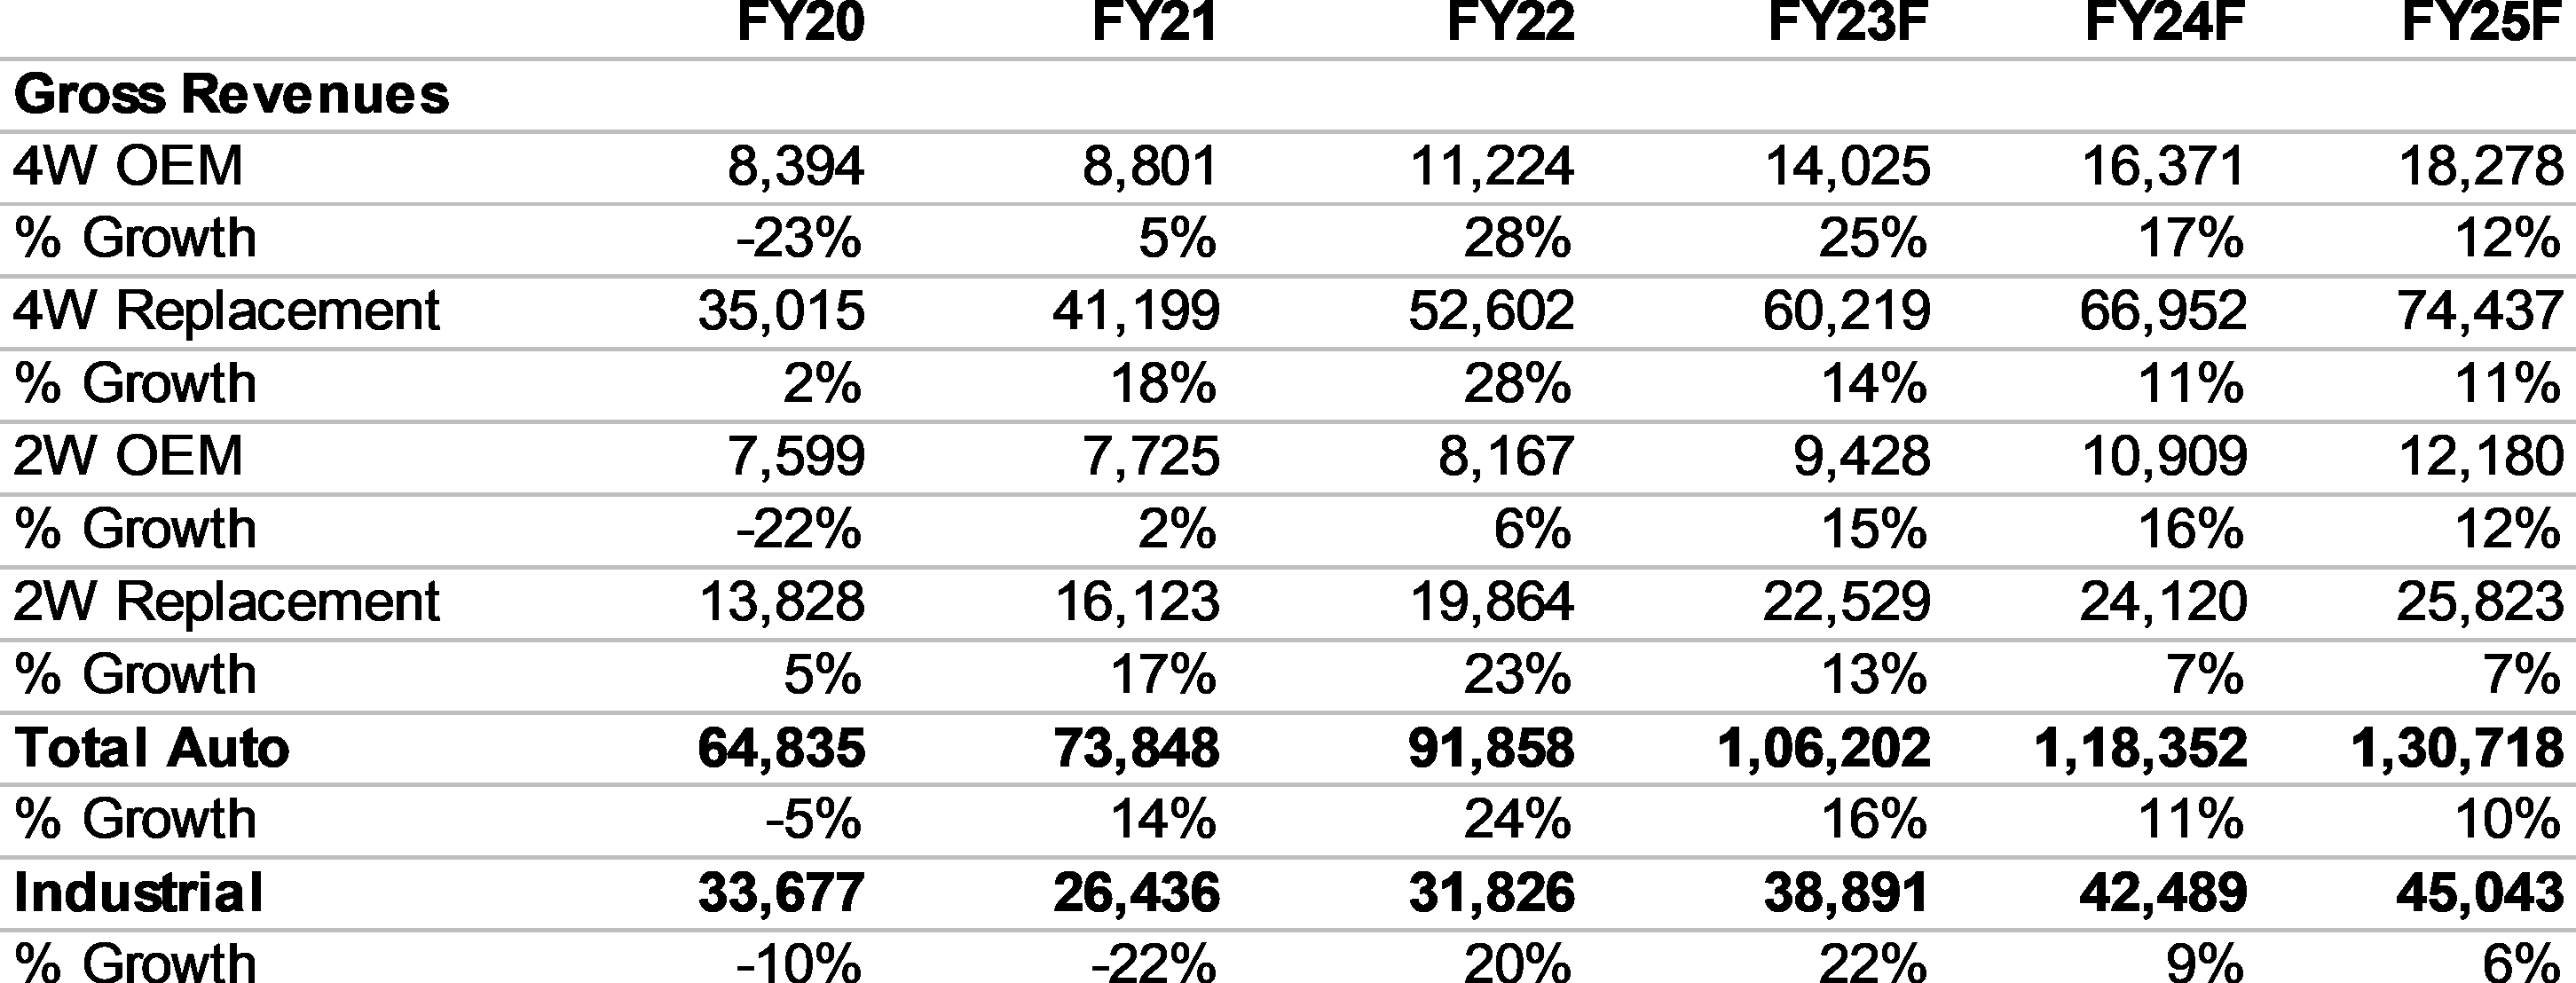
·         Industrial batteries: This division contributed 28% to overall revenue in FY22. Healthy demand and double-digit yoy growth was witnessed in segments like IUPS, telecom and traction.

o    UPS: IUPS vertical grew 30% yoy on the back of the government’s  digitalization push, growth in e-commerce, and the company’s strong service network to support sales.

o    Telecom: This vertical nearly doubled its revenue yoy as it achieved a higher market share because of an optimized product portfolio, enhanced quality and strong customer connect.

o    Infra power and projects: The company received large orders in this vertical. Management mentioned that the order book remains robust. It expects the infra power and projects business to do well due to the approval for several metro rail projects across India.

o    Traction: The domestic traction business did well on the back of India’s warehousing boom propelled by high growth in the e-commerce space and modern logistic hubs across the country. In the traction vertical, the company consolidated its high market share as it plans to roll out its ORC (Opportunity Rapid Charge) batteries that can be charged faster and intermittently enable double-shift operation with a single battery. It has also planned improved quality traction batteries which offer a higher level of corrosion resistance. There batteries are currently in the validation phase and would enable the company to compete against global players in the market, thereby substituting imports.

o    Submarine batteries: Production capacity utilization and sales of submarine batteries were subdued in FY22 because of lack of adequate demand and the delay in two export orders due to the pandemic. The company secured an export order for mini-submarine batteries in FY22. It received an order from the Indian Navy to build submarine batteries along with a full set of accessories and spares for a nuclear submarine. The company has indicated to the Indian Navy that it is prepared to use its surplus capacity to produce submarine batteries, and that it will deliver a set of Type-I submarine batteries along with accessories and spares in FY23F.

o    Railways: The Indian Railways is running a trial with lithium-ion cells for its applications, in which the company is actively engaged.

·         EV batteries: The company is already supplying lithium-ion battery modules and packs through its subsidiary Exide Leclanche Energy Pvt. Ltd (known as Nexcharge). Management stated that the company has gained experience in Indian climatic conditions and safety requirements as it sets up its lithium- ion battery pack and module facility. Exide Industries will be foraying into lithium-ion cell manufacturing through its wholly-owned subsidiary, Exide Energy Solutions.

·         Nexcharge update: Nexcharge started commercial production in FY22, and it has onboarded a few marquee customers including a global CV manufacturer and large producers of electric two-wheelers in India. The facility manufactures batteries of various chemistries such as Nickel-Manganese- Cobalt (NMC), Lithium-Iron-Phosphate (LFP) and Lithium-Titanium-Oxide (LTO), as well as modules and racks along with BMS (Battery Management System). The production lines are fungible towards different shapes and sizes. The facility has three production lines for module assembly - for cylindrical, pouch and prismatic cells. It has two lines for pack assembly for high and low voltage packs. It also has 20 testers for capacity measurement. The subsidiary is also in the process of developing a battery with many built-in protection mechanisms that would control and safeguard it from extreme climatic conditions as well as protect it from misuse. It is engaged with several marquee clients in the EV, telecom, and power sectors.

·         Exide Energy Solutions (EESL): The subsidiary plans to set up a multi-gigawatt greenfield project for manufacturing lithium-ion battery cells in multiple formats. It will also manufacture, assemble, and sell battery modules and packs. Total project capacity will be 12GWh and it is expected to be completed in phases over 8-10 years. The company has procured 80 acres of land for the purpose. The company’s board has approved a plan to set up a multi-GWh lithium-ion cell manufacturing facility through EESL.

·         SVOLT collaboration: The company has entered into a multi-year technical collaboration agreement with SVOLT for lithium-ion cell manufacturing. SVOLT would grant Exide Industries an irrevocable right and license to use, exploit and commercialize necessary technology and knowhow for lithium-ion cell manufacturing in India. SVOLT will also support the setting up of a manufacturing plant on a turnkey basis.

·         Production capacity: The company expanded its small-VRLA and medium-VRLA capacities at its Hosur plant by 18-20%. Its traction cell-making capacity at the Haldia plant has been expanded by 30% to cater to export market.

Figure 1: Exide Industries’ revenue growth improves over Amara Raja Batteries in recent quarters
SOURCE: INCRED RESEARCH, COMPANY REPORTS  


Figure 2: Exports post a sharp jump aided by western countries and Eastern Penn
SOURCE: INCRED RESEARCH, COMPANY REPORTS  


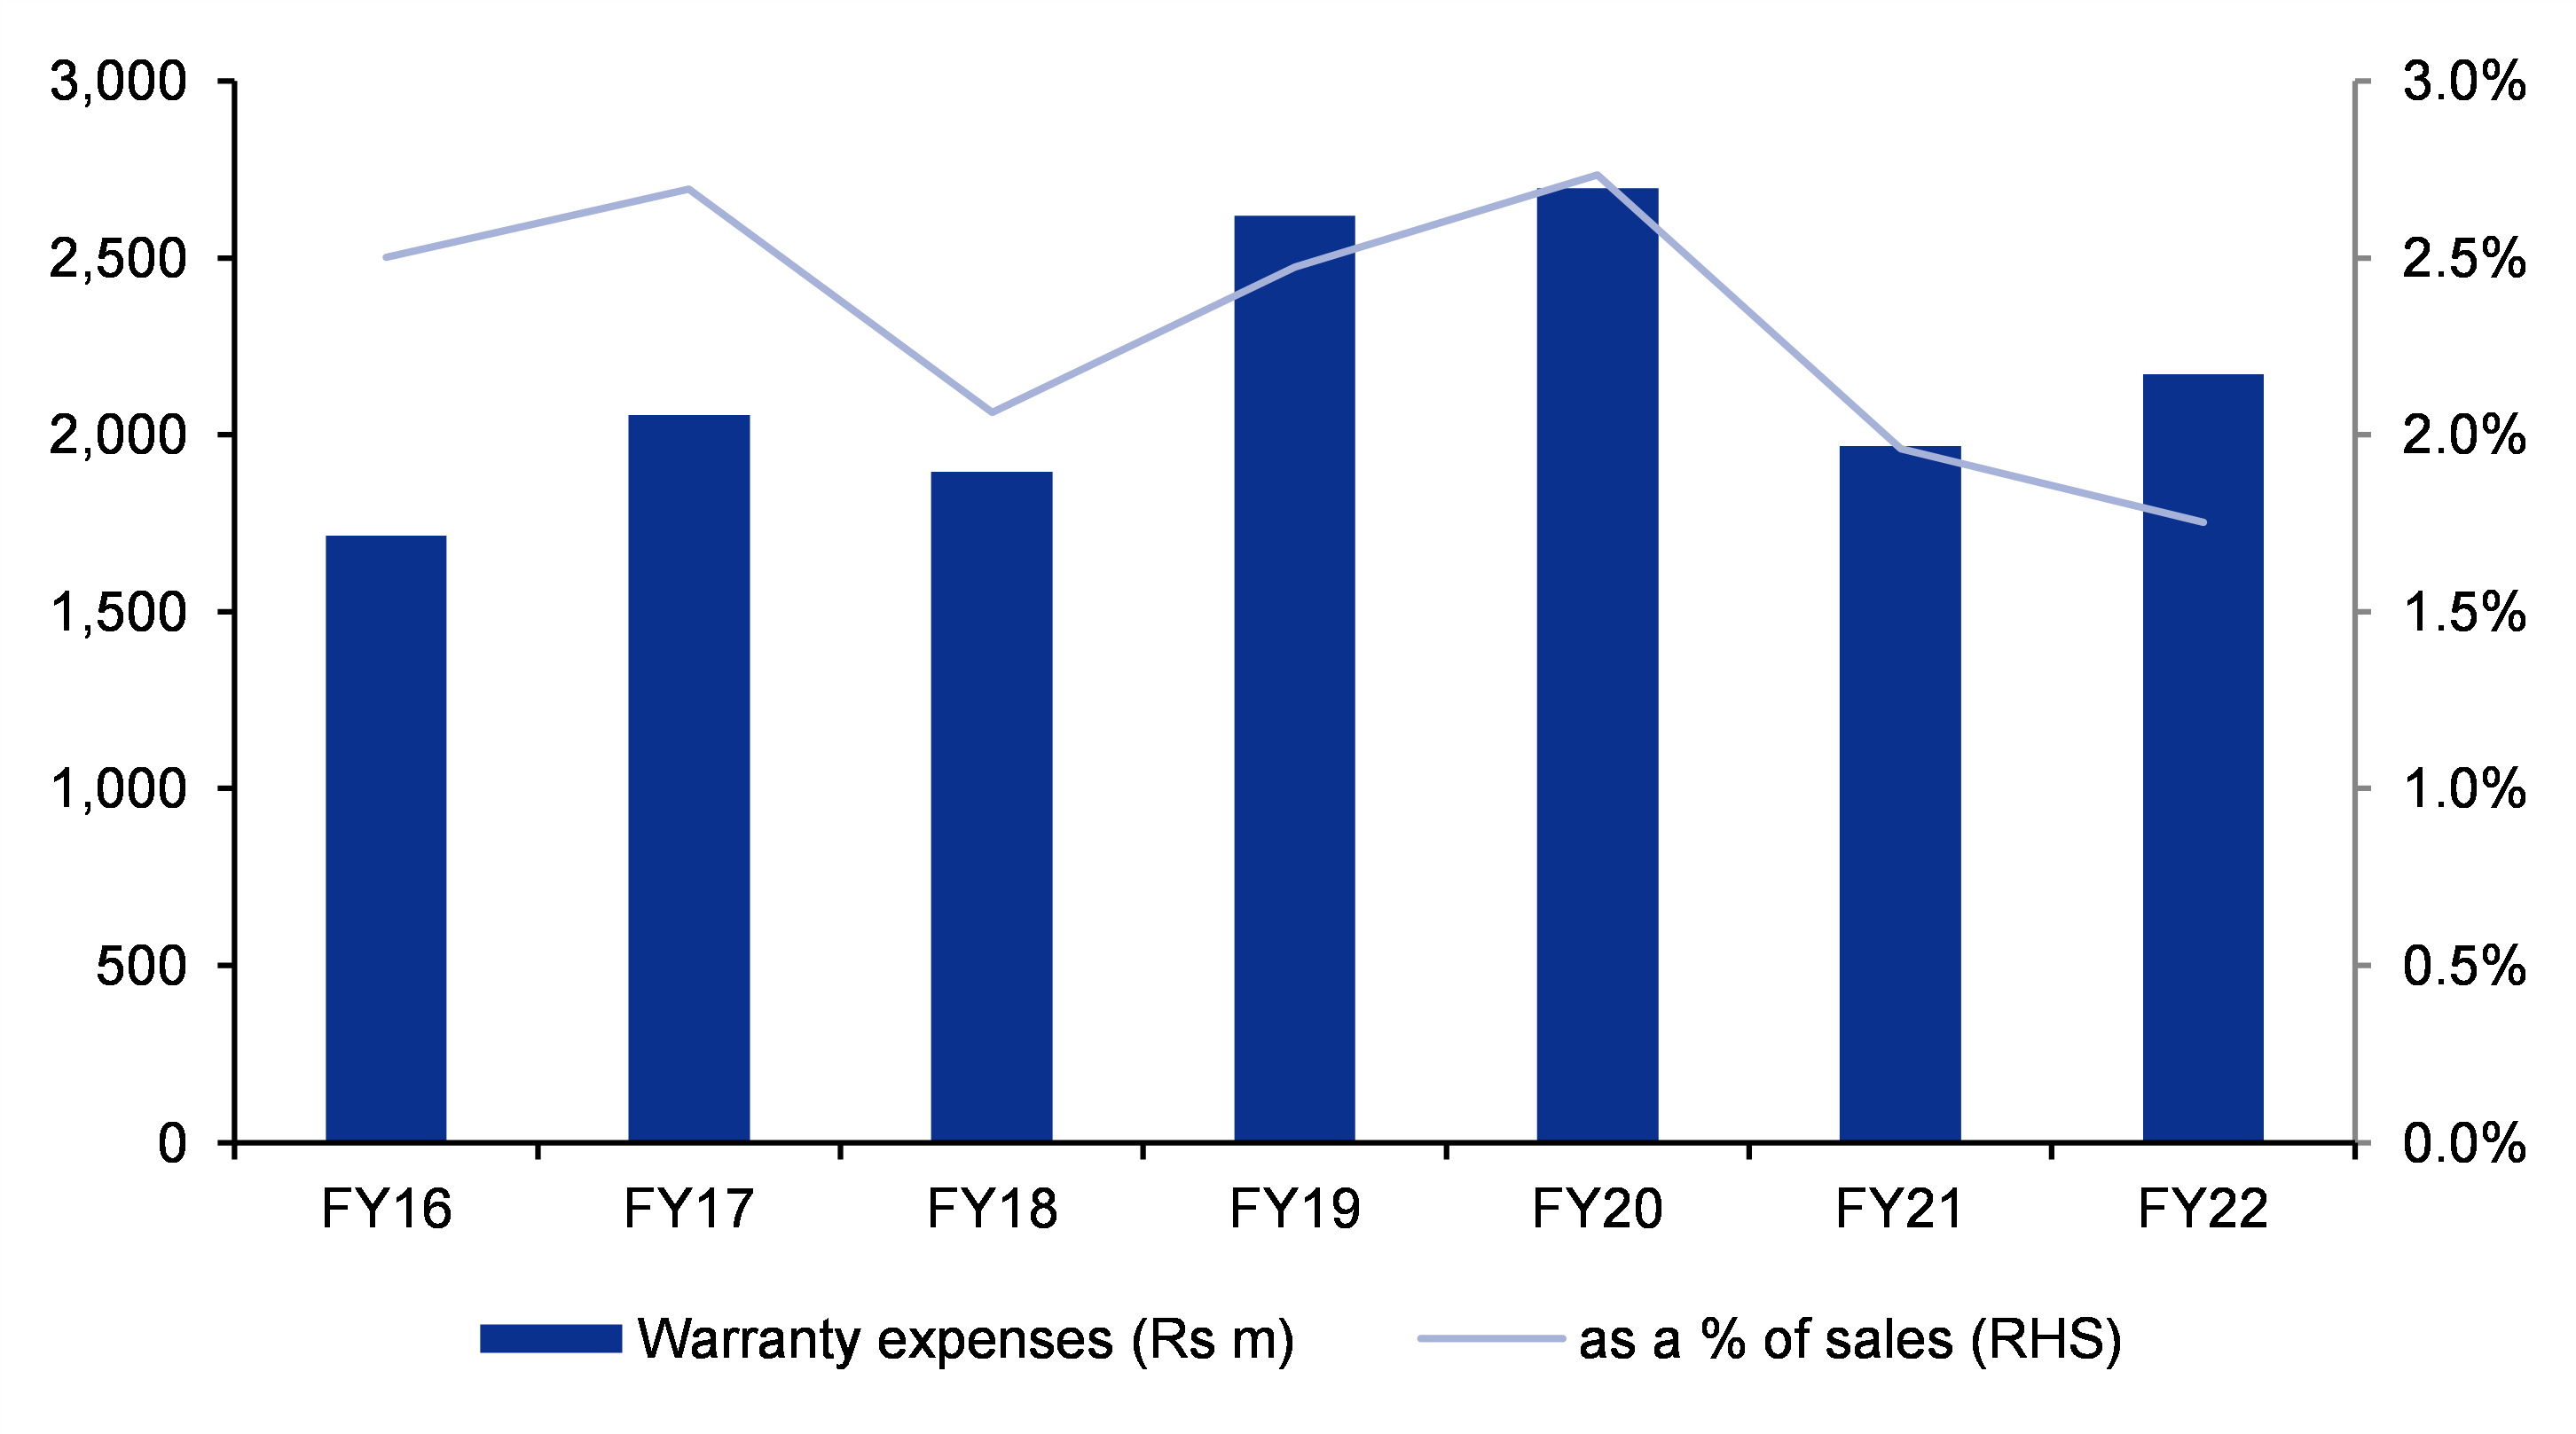
Figure 3: Warranty expenses under check
SOURCE: INCRED RESEARCH, COMPANY REPORTS  


Figure 4: Gross margin under severe pressure from rising cost of lead
SOURCE: INCRED RESEARCH, COMPANY REPORTS  


Figure 5: A similar trend is seen in EBITDA margin
SOURCE: INCRED RESEARCH, COMPANY REPORTS  


Figure 6: Revision in annual earnings
SOURCE: INCRED RESEARCH ESTIMATES, COMPANY REPORTS  


Figure 7: Key drivers (Rs m)
SOURCE: INCRED RESEARCH ESTIMATES, COMPANY REPORTS  


Figure 8: Exide Industries’ target price calculation methodology
SOURCE: INCRED RESEARCH ESTIMATES, COMPANY REPORTS  


Figure 9: Forward P/E valuation below mean level
SOURCE: BLOOMBERG, INCRED RESEARCH ESTIMATES, COMPANY REPORTS  


BY THE NUMBERS

Profit & Loss
(Rs mn) Mar-21A Mar-22A Mar-23F Mar-24F Mar-25F
Total Net Revenue 100,408 123,817 145,253 161,010 175,931
Gross Profit 34,613 38,065 44,828 52,128 58,209
Operating EBITDA 13,556 13,956 16,122 18,916 21,674
Depreciation And Amortisation (3,794) (4,126) (4,819) (5,302) (5,782)
Operating EBIT 9,762 9,830 11,303 13,614 15,891
Financial Income/(Expense) (238) (384) (140) (100) (80)
Pretax Income/(Loss) from Assoc.
Non-Operating Income/(Expense) 654 803 924 1,035 1,107
Profit Before Tax (pre-EI) 10,179 10,249 12,087 14,548 16,919
Exceptional Items
Pre-tax Profit 10,179 10,249 12,087 14,548 16,919
Taxation (2,596) (3,091) (2,780) (3,346) (3,891)
Exceptional Income - post-tax
Profit After Tax 7,583 7,158 9,307 11,202 13,027
Minority Interests
Preferred Dividends
FX Gain/(Loss) - post tax
Other Adjustments - post-tax
Net Profit 7,583 7,158 9,307 11,202 13,027
Recurring Net Profit 7,583 7,158 9,307 11,202 13,027
Fully Diluted Recurring Net Profit 7,583 7,158 9,307 11,202 13,027
Cash Flow
(Rs mn) Mar-21A Mar-22A Mar-23F Mar-24F Mar-25F
EBITDA 13,556 13,956 16,122 18,916 21,674
Cash Flow from Invt. & Assoc.
Change In Working Capital 3,862 (4,480) (4,339) (1,794) (1,489)
(Incr)/Decr in Total Provisions 1,956 1,189 450 388 517
Other Non-Cash (Income)/Expense 14 (979)
Other Operating Cashflow 39,678
Net Interest (Paid)/Received 417 419 784 935 1,027
Tax Paid (2,858) (3,466) (2,659) (3,201) (3,722)
Cashflow From Operations 16,947 46,316 10,358 15,244 18,007
Capex (5,812) (6,543) (4,500) (4,500) (5,500)
Disposals Of FAs/subsidiaries
Acq. Of Subsidiaries/investments (10,017) (35,813) (1,750) (5,250) (5,250)
Other Investing Cashflow
Cash Flow From Investing (15,830) (42,355) (6,250) (9,750) (10,750)
Debt Raised/(repaid)
Proceeds From Issue Of Shares
Shares Repurchased
Dividends Paid (2,550) (4,250) (5,100) (5,950) (6,800)
Preferred Dividends
Other Financing Cashflow
Cash Flow From Financing (2,550) (4,250) (5,100) (5,950) (6,800)
Total Cash Generated (1,433) (289) (992) (456) 457
Free Cashflow To Equity 1,117 3,961 4,108 5,494 7,257
Free Cashflow To Firm 1,355 4,345 4,248 5,594 7,337

BY THE NUMBERS…cont’d

Balance Sheet
(Rs mn) Mar-21A Mar-22A Mar-23F Mar-24F Mar-25F
Total Cash And Equivalents 914 1,612 732 226 733
Total Debtors 10,153 13,115 15,228 16,498 17,024
Inventories 23,462 24,585 28,653 29,996 31,812
Total Other Current Assets 2,449 1,962 2,100 2,400 2,600
Total Current Assets 36,978 41,273 46,713 49,120 52,169
Fixed Assets 28,724 31,140 30,821 30,018 29,736
Total Investments 30,586 60,434 61,934 66,934 71,934
Intangible Assets
Total Other Non-Current Assets
Total Non-current Assets 59,310 91,574 92,755 96,953 101,670
Short-term Debt
Current Portion of Long-Term Debt
Total Creditors 16,483 16,175 17,908 18,527 19,280
Other Current Liabilities 6,856 8,009 8,410 8,830 9,272
Total Current Liabilities 23,338 24,185 26,318 27,358 28,552
Total Long-term Debt
Hybrid Debt - Debt Component
Total Other Non-Current Liabilities
Total Non-current Liabilities
Total Provisions 4,015 2,607 2,888 3,201 3,546
Total Liabilities 27,353 26,792 29,205 30,558 32,098
Shareholders’ Equity 68,935 106,056 110,263 115,515 121,742
Minority Interests
Total Equity 68,935 106,056 110,263 115,515 121,742
Key Ratios
(Rs mn) Mar-21A Mar-22A Mar-23F Mar-24F Mar-25F
Revenue Growth 1.9% 23.3% 17.3% 10.8% 9.3%
Operating EBITDA Growth (0.7%) 3.0% 15.5% 17.3% 14.6%
Operating EBITDA Margin 13.5% 11.3% 11.1% 11.7% 12.3%
Net Cash Per Share (Rs) 1.07 1.90 0.86 0.27 0.86
BVPS (Rs) 81.10 124.77 129.72 135.90 143.23
Gross Interest Cover 41.07 25.58 80.73 136.14 198.64
Effective Tax Rate 25.5% 30.2% 23.0% 23.0% 23.0%
Net Dividend Payout Ratio 33.6% 59.4% 54.8% 53.1% 52.2%
Accounts Receivables Days 30.95 30.66 32.48 32.79 31.56
Inventory Days 125.89 102.25 96.75 98.30 95.82
Accounts Payables Days 74.46 69.50 61.94 61.07 58.61
ROIC (%) 21.5% 23.7% 24.2% 27.0% 30.8%
ROCE (%) 13.9% 10.8% 10.2% 11.7% 13.0%
Return On Average Assets 8.8% 6.6% 6.9% 7.9% 8.7%
Key Drivers
(Rs mn) Mar-21A Mar-22A Mar-23F Mar-24F Mar-25F
Unit sales growth (%, main prod./serv.) 4.9% 8.1% 9.5% 9.8% 8.4%
Unit sales growth (%,2ndary prod/serv.) (21.5%) 20.4% 22.2% 9.2% 6.0%
SOURCES: INCRED RESEARCH, COMPANY REPORTS

DISCLAIMER

This report (including the views and opinions expressed therein, and the information comprised therein) has been prepared by Incred Research Services Private Ltd.(formerly known as Earnest Innovation Partners Private Limited) (hereinafter referred to as “ IRSPL”). IRSPL is registered with SEBI as a Research Analyst vide Registration No. INH000007793. Pursuant to a trademark agreement, IRSPL has adopted “Incred Equities ” as its trademark for use in this report.

The term “IRSPL” shall, unless the context otherwise requires, mean IRSPL and its affiliates, subsidiaries and related companies. This report is not directed or intended for distribution to or use by any person or entity resident in a state, country or any jurisdiction, where such distribution, publication, availability or use would be contrary to law, regulation or which would subject IRSPL and its affiliates/group companies to registration or licensing requirements within such jurisdictions.

This report is being supplied to you strictly on the basis that it will remain confidential. No part of this report may be (i) copied, photocopied, duplicated, stored or reproduced in any form by any means; or (ii) redistributed or passed on, directly or indirectly, to any other person in whole or in part, for any purpose without the prior written consent of IRSPL.

The information contained in this report is prepared from data believed to be correct and reliable at the time of issue of this report.

IRSPL is not required to issue regular reports on the subject matter of this report at any frequency and it may cease to do so or change the periodicity of reports at any time. IRSPL is not under any obligation to update this report in the event of a material change to the information contained in this report. IRSPL has not any and will not accept any, obligation to (i) check or ensure that the contents of this report remain current, reliable or relevant; (ii) ensure that the content of this report constitutes all the information a prospective investor may require; (iii) ensure the adequacy, accuracy, completeness, reliability or fairness of any views, opinions and information, and accordingly, IRSPL and its affiliates/group companies (and their respective directors, associates, connected persons and/or employees) shall not be liable in any manner whatsoever for any consequences (including but not limited to any direct, indirect or consequential losses, loss of profits and damages) of any reliance thereon or usage thereof.

Unless otherwise specified, this report is based upon reasonable sources. Such sources will, unless otherwise specified, for market data, be market data and prices available from the main stock exchange or market where the relevant security is listed, or, where appropriate, any other market. Information on the accounts and business of company(ies) will generally be based on published statements of the company(ies), information disseminated by regulatory information services, other publicly available information and information resulting from our research. Whilst every effort is made to ensure that statements of facts made in this report are accurate, all estimates, projections, forecasts, expressions of opinion and other subjective judgments contained in this report are based on assumptions considered to be reasonable as of the date of the document in which they are contained and must not be construed as a representation that the matters referred to therein will occur. Past performance is not a reliable indicator of future performance. The value of investments may go down as well as up and those investing may, depending on the investments in question, lose more than the initial investment. No report shall constitute an offer or an invitation by or on behalf of IRSPL and its affiliates/group companies to any person to buy or sell any investments.

The opinions expressed are based on information which are believed to be accurate and complete and obtained through reliable public or other non-confidential sources at the time made. (Information barriers and other arrangements may be established where necessary to prevent conflicts of interests arising. However, the analyst(s) may receive compensation that is based on his/their coverage of company(ies) in the performance of his/their duties or the performance of his/their recommendations. In reviewing this report, an investor should be aware that any or all of the foregoing, among other things, may give rise to real or potential conflicts of interest. Additional information is, subject to the duties of confidentiality, available on request.

The report is not a “prospectus” as defined under Indian Law, including the Companies Act, 2013, and is not, and shall not be, approved by, or filed or registered with, any Indian regulator, including any Registrar of Companies in India, SEBI, any Indian stock exchange, or the Reserve Bank of India. No offer, or invitation to offer, or solicitation of subscription with respect to any such securities listed or proposed to be listed in India is being made, or intended to be made, to the public, or to any member or section of the public in India, through or pursuant to this report.

The research analysts, strategists or economists principally responsible for the preparation of this research report are segregated from the other activities of IRSPL. Information barriers and other arrangements have been established, as required, to prevent any conflicts of interests.

The research analysts, strategists or economists principally responsible for the preparation of this research report are segregated from the other activities of IRSPL. Information barriers and other arrangements have been established, as required, to prevent any conflicts of interests.

IRSPL may have issued other reports (based on technical analysis, event specific, short term views etc.) that are inconsistent with and reach different conclusion from the information presented in this report.

Holding of Analysts/Relatives of Analysts, IRSPL and Associates of IRSPL in the covered securities, as on the date of publishing of this report

Analyst/ Relative Entity/ Associates
any financial interests in the company covered in this report (subject company) and nature of such financial interest NO NO
actual/beneficial ownership of 1% or more in securities of the subject company at the end of the month immediately preceding the date of publication of the research report or date of the public appearance; NO NO
any other material conflict of interest at the time of publication of the research report or at the time of public appearance NO NO
received any compensation from the subject company in the past twelve months for investment banking or merchant banking or brokerage services or investment advisory or depository or distribution from the subject company in the last twelve months for products/services other than investment banking or merchant banking or broker- age services or investment advisory or depository or distribution from the subject company in the last twelve months NO NO
managed or co-managed public offering of securities for the subject company in the last twelve months NO NO
received any compensation or other benefits from the subject company or third party in connection with the research report NO NO
served as an officer, director or employee of the subject company NO NO
been engaged in market making activity for the subject company NO NO
Analyst declaration
  • The analyst responsible for the production of this report hereby certifies that the views expressed herein accurately and exclusively reflect his or her personal views and opinions about any and all of the issuers or securities analysed in this report and were prepared independently and autonomously in an unbiased manner.
  • No part of the compensation of the analyst(s) was, is, or will be directly or indirectly related to the inclusion of specific recommendations(s) or view(s) in this report or based any specific investment banking transaction.
  • The analyst(s) has(have) not had any serious disciplinary action taken against him/her(them). • The analyst, strategist, or economist does not have any material conflict of interest at the time of
  • publication of this report.
  • The analyst(s) has(have) received compensation based upon various factors, including quality, accuracy and value of research, overall firm performance, client feedback and competitive factors.

IRSPL and/or its affiliates and/or its Directors/employees may own or have positions in securities of the company(ies) covered in this report or any securities related thereto and may from time to time add to or dispose of, or may be materially interested in, any such securities.

IRSPL and/or its affiliates and/or its Directors/employees may do and seek to do business with the company(ies) covered in this research report and may from time to time (a) buy/sell the securities covered in this report, from time to time and/or (b) act as market maker or have assumed an underwriting commitment in securities of such company(ies), and/or (c) may sell them to or buy them from customers on a principal basis and/or (d) may also perform or seek to perform significant investment banking, advisory, underwriting or placement services for or relating to such company(ies) and/or (e) solicit such investment, advisory or other services from any entity mentioned in thisreport and/or (f) act as a lender/borrower to such company and may earn brokerage or other compensation. However, Analysts are forbidden to acquire, on their own account or hold securities (physical or uncertificated, including derivatives) of companies in respect of which they are compiling and producing financial recommendations or in the result of which they play a key part.