* price as on January 01, 0001
India
Consensus ratings*: Buy 20 Hold 4 Sell 4
Previous target: 4,523
Up/downside: 10.4%
Reuters
Bloomberg: COFORGE IN
Market cap: US$3,236m
Rs234,980m
Average daily turnover: US$27.2m
Current shares o/s: 62.2m
Free float: 50.0%
*Source: Bloomberg

Key changes in this note

Lower FY22-24F revenue CAGR by 1.8%.

Lower FY22-24F EBIT CAGR by 2.5%.

Lower FY22-24F PAT CAGR by 1%.

*Source: Bloomberg

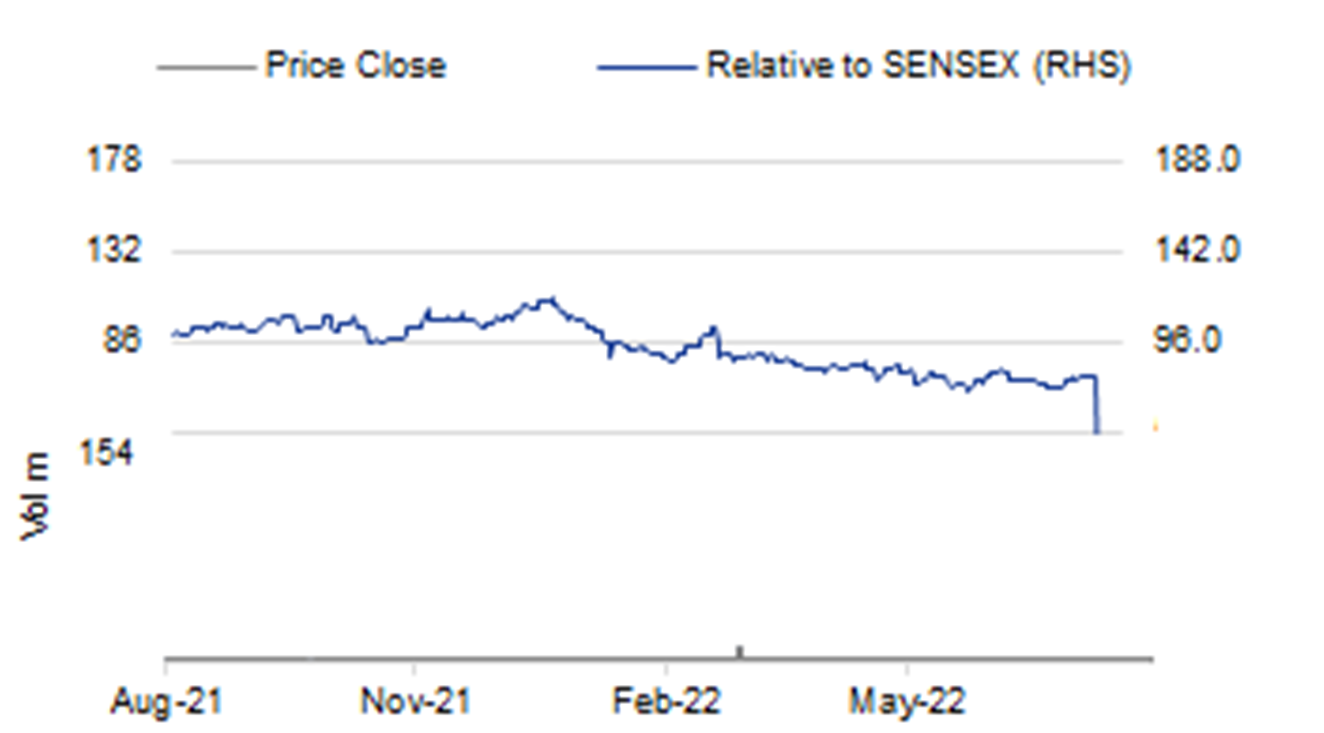
Price performance
1M 3M 12M
Absolute (%) 10.1 3.6 (17.8)
Relative (%) 0.0 (7.5) (24.0)
Major shareholders
% held
Axis long term equity fund 6.5
UTI FLEXI CAP FUND 3.9
LIC 3.8
Analyst(s)

Abhishek SHINDADKAR

T (91) 22 4161 1543
E abhishek.shindadkr@incredcapital.com

Tushar WAVHAL

T (91) 22 4161 1544
E tushar.wavhal@incredcapital.com

FY22 annual report analysis

OCF/EBITDA was at 69.5% in FY22 vs. 97.8% in FY21; payout stays healthy.

Contingent liabilities up 207.3% yoy at Rs1,131m (Rs18 per share).

Median remuneration of employees increased by 27.2% in FY22.

Summary

Coforge Limited’s (COFORGE IN) FY22 annual report highlights a) investments in next generation digital capabilities with service offering focus on product engineering, data & integration, cloud and business process operations, b) expanding partnerships with leading product & platform providers, c) focus on large deals, d) deep domain expertise in chosen verticals, and e) building of Centre of Excellence (CoE) in emerging technologies to augment capabilities and drive significant mindshare and wallet share. Other notable highlights include a) employee expenses up 36.2% yoy (59.6% of revenue vs. 60.4% in FY21), b) professional charges up 70.9% yoy (10.2% vs. 8.2%), c) production expenses (including third-party license cost) up 41.7% yoy (3.7% vs. 3.6%), and d) operating cash flow (OCF) before working capital change up 33.3% but increased working capital limits OCF growth (up 0.4% in FY22).

CEO compensation up 50.2% yoy – 3.4% of FY22 PAT vs 3.3% in FY21

Mr. Sudhir Singh’s (executive director & CEO) overall salary was Rs223m (vs. Rs148.4m in FY21) comprising Rs45.4m as salary (vs. Rs35.6m in FY21), Rs104.2m as stock options (vs. Rs77.1m in FY21), Rs69.6m as performance-linked bonus (vs. Rs33m in FY21) and the rest as others.

Adjusting estimates to factor in cross-currency & macro headwinds

We now model FY22-24F US$ revenue CAGR of 17.2% vs. 19% earlier, primarily to account for cross-currency headwinds and uncertain macro environment. Our discussions suggest that growth would be led by financial services and transportation verticals and aided by recovery in the insurance vertical. We also adjust our FY22-24F average EBIT margin to 17.8% vs. 18.4% earlier to account for growth moderation and elevated supply cost. This drives a change in FY22-24F PAT CAGR by 100bp to 23.8%.

Retain Add rating with a lower target price of Rs4,258

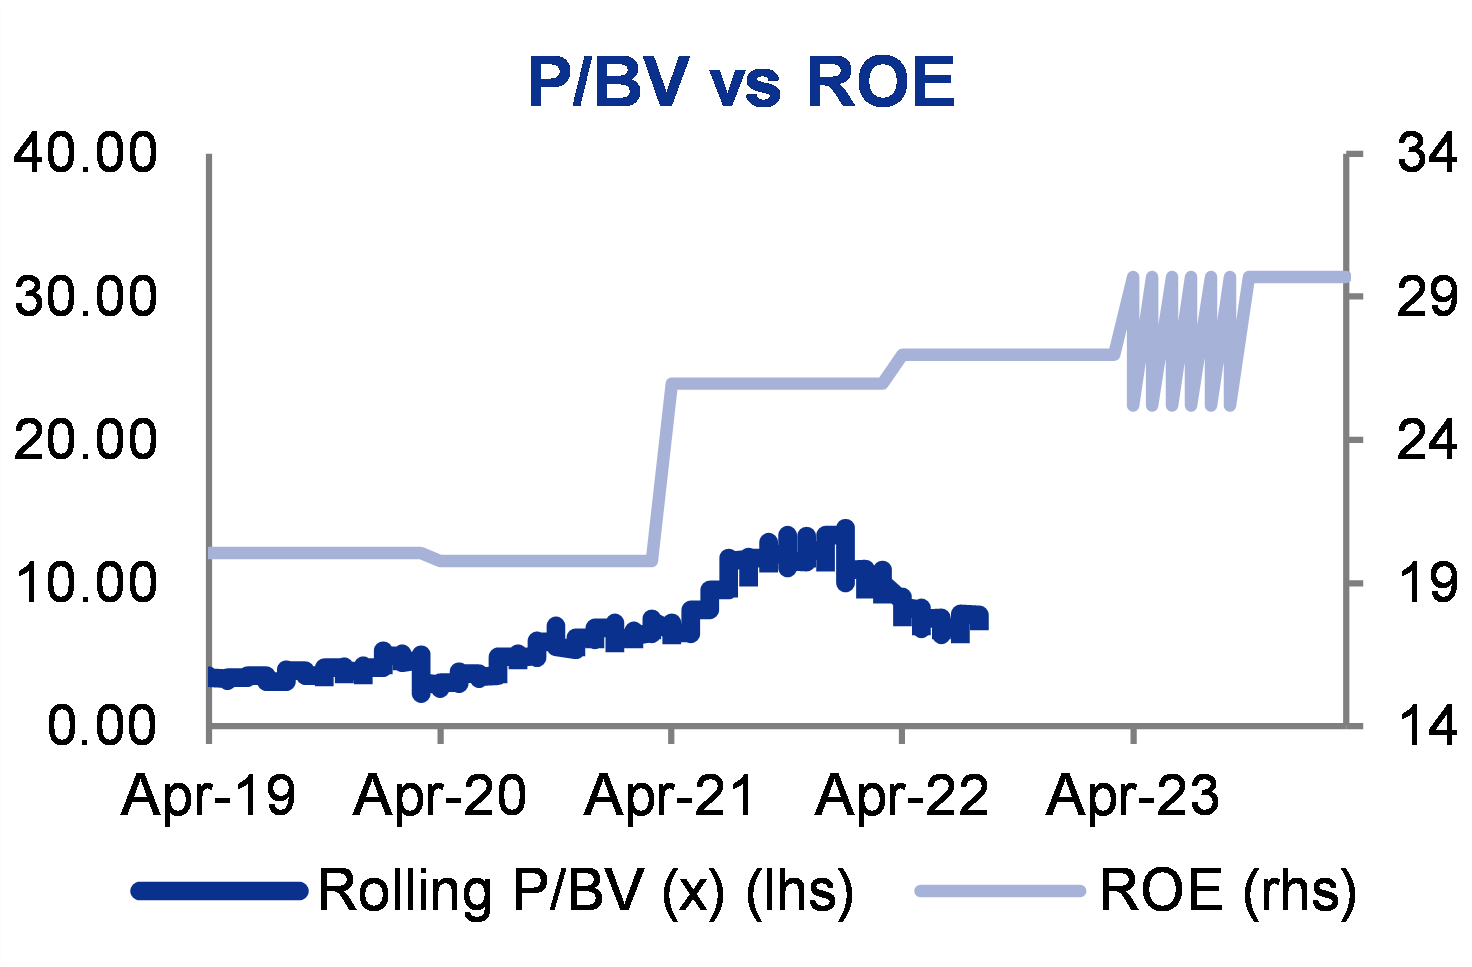
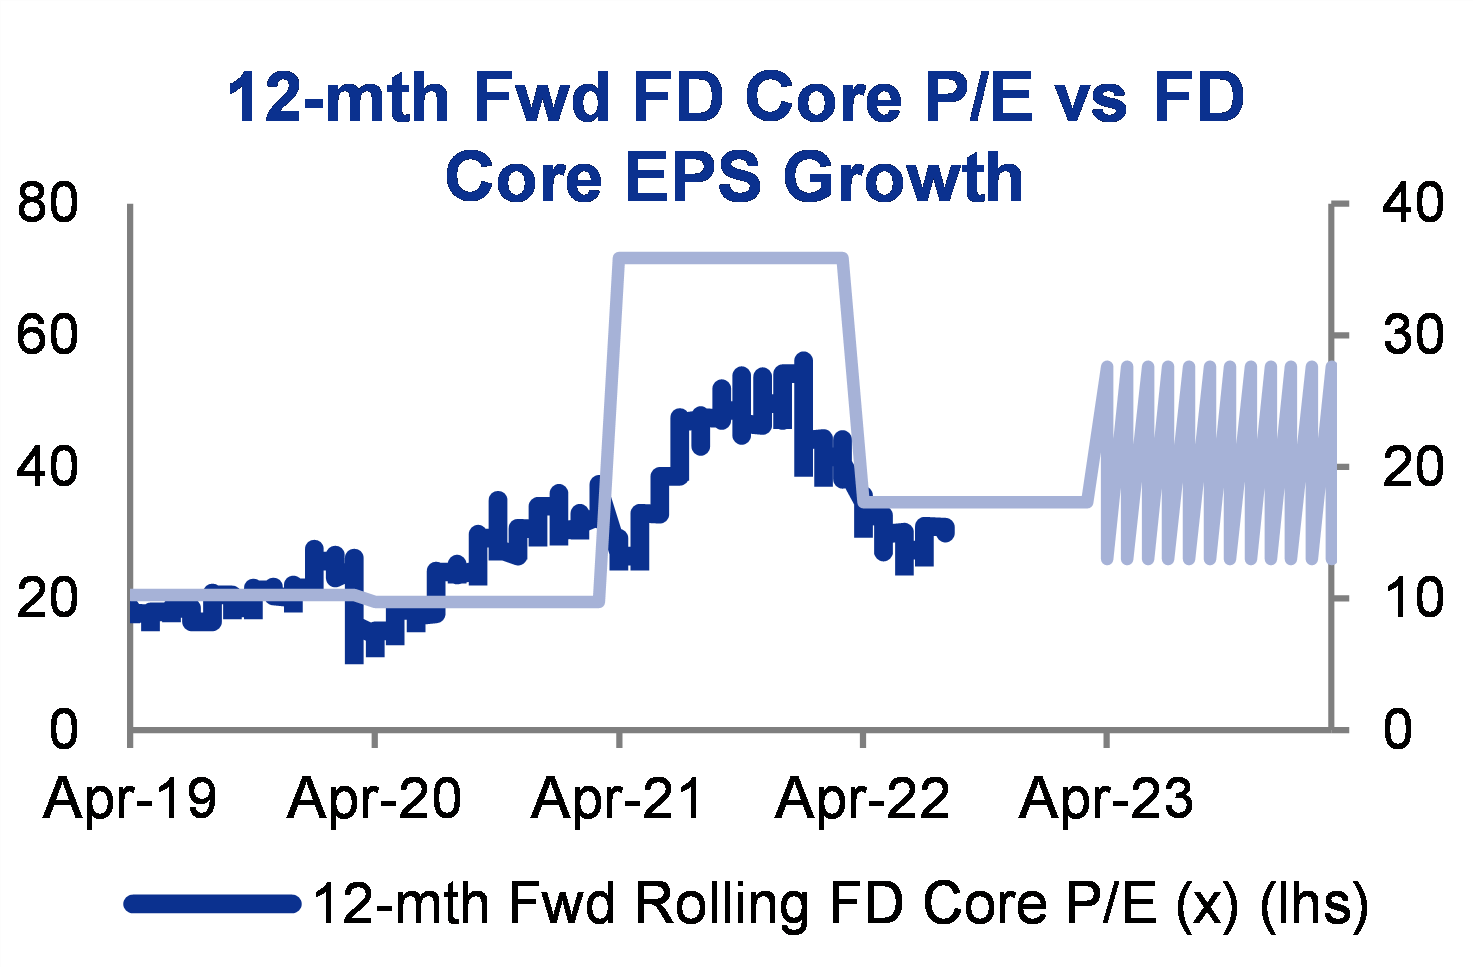
We retain Add rating on Coforge but a revision in our estimates lowers our target price to Rs4,258 (Rs4,523 earlier) despite retaining the valuation multiple. We retain our PE/G multiple of 1.1x but a lower PAT CAGR drives a lower P/E multiple of 26x (vs. 27x earlier). Steady cash generation and high payout ratio (avg. 66% payout of free cash flow over last three years) provide cushion to our view. Moderation in deal velocity and senior leadership attrition are key downside risks to our revenue growth and EBIT margin assumptions.

Financial Summary
Mar-20A Mar-21A Mar-22A Mar-23F Mar-24F
Revenue (Rsm) 41,839 46,628 64,320 79,857 93,955
Operating EBITDA (Rsm) 7,198 7,865 11,155 14,112 16,912
Net Profit (Rsm) 4,547 4,986 6,753 7,935 10,135
Core EPS (Rs) 71.9 77.2 108.9 127.7 163.0
Core EPS Growth 10.0% 7.5% 41.0% 17.3% 27.6%
FD Core P/E (x) 52.82 48.13 35.43 30.20 23.66
DPS (Rs) 31.0 13.0 52.0 61.0 77.4
Dividend Yield 0.86% 0.33% 1.32% 1.58% 2.01%
EV/EBITDA (x) 32.10 29.57 21.57 16.79 13.87
P/FCFE (x) 107.05 35.08 54.93 33.61 36.12
Net Gearing (38.1%) (30.1%) 1.3% (11.3%) (16.7%)
P/BV (x) 10.05 9.69 8.76 7.62 6.52
ROE 20.0% 19.8% 26.0% 27.0% 29.7%
% Change In Core EPS Estimates (7.14%) (1.81%)
InCred Research/Consensus EPS (x)
INCRED RESEARCH, COMPANY REPORTS, PRICED AS AT January 01, 0001

Quotes from Executive Director & CEO Mr. Sudhir Singh

“New order intake crossed US$1.15bn. Signed 11 large deals including a US$105m deal and three US$50m+ deals.”

“Large deal signing helped Coforge to materially scale offshore operations, which in turn helped expand adjusted EBITDA margin by 90bp in FY22.”

“Coforge is now focused on carving an accelerated growth path to the US$2bn revenue milestone.”

“Experienced strong growth across entire offering spectrum during the year and all service lines are scaled businesses today.”

“Digital portfolio comprising product engineering, intelligent automation, and data & integration service line make up 51.5% of technology revenue and 46.6% of overall revenue.”

“Digital and Cloud-Infra services formed 71.3% of technology revenue and grew 24.5% in FY22.”

“Coforge became an AWS Travel & Hospitality Competency Partner, reflecting the firm’s demonstrated expertise in helping travel & hospitality clients transform their businesses.”

“Coforge announced a global partnership with Kong – a Gartner 2021 leader in Full Lifecycle API management.”

“Coforge earned the global elite distinction in the new Pega partners program and also specialized distinctions in customer service, delivery and manufacturing.”

“Coforge Salesforce BU won the ‘JAPAC – breakthrough partner of the year’ awards from MuleSoft.”

Other key takeaways

As of 31 Mar 2022, Coforge is serving 60+ Forbes Global 1000 clients. The company has been empanelled as a preferred tech services partner across multiple Fortune 100 and Fortune 500 clients.

“A warehouse management platform developed by Coforge is being used by one of the largest freight forwarder airports in the world.”

“With Salesforce, Coforge helps enterprises build stronger, more valuable relationships with customers across channels and offer personalized experiences, with all information and tools on a single interface as, according to Salesforce, 84% of customers feel that experiences are as important as the actual products and services.”

Coforge helps remove data silos and create a seamlessly connected ecosystem that allows instant access to information and drives new, data-driven insights, as according to MuleSoft, 89% of IT leaders say data silos are an obstacle to digital transformation.

Hyper-Intelligence Platform is Coforge’s knowledge graph platform that enables ingestion, pre-processing, processing and decisioning. It enables transformation, processing, migration, etc. from unstructured to structured data, from SQL to NoSQL, from Block to Object, and from on-prem to Cloud.

·       The company’s proprietary Data Xpress Toolkit enables the acceleration of journey to modernization and analytics. Tableau capabilities help clients deliver powerful analytics to make smarter decisions with Salesforce and other platforms.

The company’s proprietary MuleSoft Migration Toolkit accelerates migration to MuleSoft at a rapid pace. This toolkit accelerates time-to-value through reusability, modularity and collaboration while increasing agility and flexible architecture that evolves as the business.


AIOps Platform – advanced hyper-automation AI OPS platform (an integrated

programmable platform) services to realize current trends, optimization and transformation avenues while balancing performance, availability, and resilience for clients.

·       The cloud adoption is being driven through innovation acceleration as Hyperscale Cloud Providers (Amazon Web Services, Microsoft Azure, Google Cloud) ship over three thousand new releases a year to help customers achieve real business outcomes. However, at the same time, organizations are sometimes overspending (with 80% overshooting their Cloud budgets in 2020), budgets are getting wasted (on an average, over 30% of Cloud spending in organizations is wasted), and the skills gap is widening (90% of organizations say they suffer a growing Cloud skills gap).

·       Coforge plans to continue driving significant Cloud penetration within its portfolio by showcasing capabilities that are built on strategic alliances with Hyperscalers (especially AWS and Azure) for sourcing market-leading hyper-converged infrastructure, network, and security services. Journey to Cloud is being driven through Coforge’s Cloud Innovation Factory which showcases skills ranging from prototyping to MVPs and Coforge’s ability to drive migrations at scale leveraging migration factory processes.

·       The company is in the process of establishing a Centre of Excellence (CoE) in emerging technologies (SmartChains, Artificial Intelligence, Metaverse, cognitive services like video analytics, advanced natural language processing, text summarization, and extended reality advanced user interfaces) to build capabilities and drive significant mind share and wallet share.

·       Multiple proofs-of-concept (PoCs) have been created in partnership with customers in the company’s lab at Bengaluru and Noida for technology incubation and adoption to solve business problems.

Employee metrics

Employee count increased by 10,109 in FY22 to 22,500. 6,299 resources were added from acquisitions. The company added 1,680 fresh graduates, which is more than six times of the corresponding figure last year.

Last 12-month (LTM) attrition (excluding business process operations) rate as at end-4QFY22 stood at 17.7% vs. 10.5% in 4QFY21. Higher net hiring led to moderation in utilization (including trainees) by 490bp yoy in 4QFY22, at 76.1%.

Percentage increase in median remuneration of employees in FY22 was 27.15% vs. a 7.82% increase in FY21. Increase in salary of employees in India was 9.3% and 4.8% for employees outside India.

Professional credibility through various certification drives helped 1,986 employees to get trained and certified as on 31 Mar in FY22, thereby enhancing their capabilities and creating a future-ready workforce. Top 5 categories basis count are - Microsoft Azure with 1,002, followed by 303 for PEGA, SAFe certification counts at 207, Appian at 142 and Salesforce at 102.

Key acquisitons

Coforge acquired a 60% stake in SLK Global (to strengthen financial services vertical, scale BPM operations and enhance relationship with large financial services firms) on 28 Apr 2021 (date of acquisition of control) for Rs9,201m. The company has funded this acquisition through redeemable non-convertible bonds (Rs3,400m) and the remaining via internal accruals. Goodwill accounted for Rs6,126m. SLK Global contributed Rs6,108m to overall revenue in FY22 and Rs973m to PAT. The company will acquire the remaining 20% stake, as per the agreement, within two years of acquisition with the consideration payable as a multiple of earnings and accordingly, it has recorded put liability for future acquisition.

“On 21 Jan 2022, the Group entered into a Limited Liability Company or LLC agreement and incorporated M/s Coforge Healthcare Digital Automation LLC (‘Healthcare’). The Group infused Rs113m in the newly incorporated Healthcare. The group paid a consideration of Rs113m and 45% stake to sellers in lieu of customer contracts as well as certain employees. The above arrangement has been recorded as business combination in accordance with IFRS 3. Accordingly, the Group recorded a goodwill of Rs173m and customer relationship of Rs45m and non-compete fee of Rs2m. As per the terms of the agreement, the Group will acquire the remaining stake of 45% over a period of three years. The put option to acquire the remaining 45% has been fairly valued at Rs116m.”

During FY22, Coforge acquired the balance 18.6% stake in Coforge SF Private Limited (erstwhile Whishworks IT Consulting Private Limited), making it a wholly-owned subsidiary of the company, effective 5 Oct 2021, for a consideration of Rs729m.

Financials

P&L takeaways:

FY22 US$ revenue of Coforge was up 37.9% at $866.5m vs. a 11.4% growth in FY21 while Indian Rupee or INR reported revenue was up 37.9% at Rs64.3bn.

FY22 EBITDA was up 41.4% yoy at Rs11bn with a 17.1% EBITDA margin vs. 16.7% in FY21. Margin walk for a 40bp increase: growth leverage and moderation in ESOP expenses (40bp tailwind) was offset by higher professional expenses (200bp headwind). EBIT margin was up 80bp at 13.6% as depreciation & amortization expenses were up 23.7% yoy and formed 3.5% of revenue (vs. 3.9% in FY21) while absolute EBIT was up 46.8% yoy at Rs8.7bn. Reported PAT was up 45.2% yoy at Rs6.6bn.

Employee cost was up 36.2% yoy at Rs38.4bn (59.6% of revenue vs. 60.4% in FY21) while professional expenses were up 70.9% yoy in FY22 at Rs6.5bn and formed 10.2% of revenue (vs. 8.2% in FY21).

Other income was up 58.9% at Rs518m led by a 226.9% increase in government incentive (Rs170m), exchange gain of Rs160m (vs. Nil in FY21) offset by a 1.7% decline in interest & dividend income (Rs115m) and a 54.1% fall in miscellaneous income (Rs72m).

Tax expenses were up 12.7% yoy at Rs1,468m led by a 10.3% increase in current tax to Rs1,774m while deferred tax credit was unchanged yoy at Rs306m. Effective tax rate for FY22 stood at 17% vs. 21.8% in FY21.

Figure 1: Management expects at least a 20% constant currency revenue growth in FY23F

Particulars (Rs m)

FY19

FY20

FY21

FY22

Revenue

36,762

41,839

46,628

64,320

yoy growth

22.9%

13.8%

11.4%

37.9%

Purchase of stock-in-trade / contract costs

291

844

1,935

1,724

% of revenue

0.8%

2.0%

4.1%

2.7%

Employee expenses

21,532

25,298

28,158

38,346

% of revenue

58.6%

60.5%

60.4%

59.6%

Professional charges

3,004

2,893

3,845

6,572

% of revenue

8.2%

6.9%

8.2%

10.2%

Legal & professional charges

835

971

816

960

% of revenue

2.3%

2.3%

1.8%

1.5%

Travelling & conveyance

1,184

1,277

197

272

% of revenue

3.2%

3.1%

0.4%

0.4%

Production expenses (including third-party license cost)

403

1,064

1,660

2,352

% of revenue

1.1%

2.5%

3.6%

3.7%

Other expenses

3,028

2,259

2,222

3,075

% of Revenue

14.1%

8.9%

7.9%

8.0%

EBITDA

6,485

7,233

7,795

11,019

% of revenue

17.6%

17.3%

16.7%

17.1%

Depreciation & amortization

1,248

1,730

1,836

2,272

% of revenue

3.4%

4.1%

3.9%

3.5%

EBIT

5,237

5,503

5,959

8,747

% of revenue

14.2%

13.2%

12.8%

13.6%

SOURCE: INCRED RESEARCH, COMPANY REPORTS


Figure 2: Americas and Europe growth and margins remained healthy
CGS-CIMB Research
CGSCIMB Securities InCred Capita
11 August 2022
India
Company Note
Coforge Limited   | PDF
FY22 annual report analysis
COFORGE IN /  | ADD - Maintained | INR3,857 tp:INR4,258
Mkt.Cap:US$3,236m | Avg.Daily Vol:US$27.2m | Free Float:50.0%
IT Services
Author(s): Abhishek SHINDADKAR (91) 22 4161 1543, Tushar WAVHAL 

     OCF/EBITDA was at 69.5% in FY22 vs. 97.8% in FY21; payout stays healthy.
   Contingent liabilities up 207.3% yoy at Rs1,131m (Rs18 per share).
   Median remuneration of employees increased by 27.2% in FY22.
 

Summary
Coforge Limited’s (COFORGE IN) FY22 annual report highlights a) investments in next generation digital capabilities with service offering focus on product engineering, data & integration, cloud and business process operations, b) expanding partnerships with leading product & platform providers, c) focus on large deals, d) deep domain expertise in chosen verticals, and e) building of Centre of Excellence (CoE) in emerging technologies to augment capabilities and drive significant mindshare and wallet share. Other notable highlights include a) employee expenses up 36.2% yoy (59.6% of revenue vs. 60.4% in FY21), b) professional charges up 70.9% yoy (10.2% vs. 8.2%), c) production expenses (including third-party license cost) up 41.7% yoy (3.7% vs. 3.6%), and d) operating cash flow (OCF) before working capital change up 33.3% but increased working capital limits OCF growth (up 0.4% in FY22).


CEO compensation up 50.2% yoy – 3.4% of FY22 PAT vs 3.3% in FY21
Mr. Sudhir Singh’s (executive director & CEO) overall salary was Rs223m (vs. Rs148.4m in FY21) comprising Rs45.4m as salary (vs. Rs35.6m in FY21), Rs104.2m as stock options (vs. Rs77.1m in FY21), Rs69.6m as performance-linked bonus (vs. Rs33m in FY21) and the rest as others.


Adjusting estimates to factor in cross-currency & macro headwinds
We now model FY22-24F US$ revenue CAGR of 17.2% vs. 19% earlier, primarily to account for cross-currency headwinds and uncertain macro environment. Our discussions suggest that growth would be led by financial services and transportation verticals and aided by recovery in the insurance vertical. We also adjust our FY22-24F average EBIT margin to 17.8% vs. 18.4% earlier to account for growth moderation and elevated supply cost. This drives a change in FY22-24F PAT CAGR by 100bp to 23.8%.


Retain Add rating with a lower target price of Rs4,258
We retain Add rating on Coforge but a revision in our estimates lowers our target price to Rs4,258 (Rs4,523 earlier) despite retaining the valuation multiple. We retain our PE/G multiple of 1.1x but a lower PAT CAGR drives a lower P/E multiple of 26x (vs. 27x earlier). Steady cash generation and high payout ratio (avg. 66% payout of free cash flow over last three years) provide cushion to our view. Moderation in deal velocity and senior leadership attrition are key downside risks to our revenue growth and EBIT margin assumptions.


Any feedback/questions, please click on the author's name to email or call them at the number displayed.


Disclaimer: No part of this report may be reproduced or distributed in any manner without the written permission of CGS-CIMB and its affiliates. CGS-CIMB and its affiliates specifically prohibit the redistribution of this report, electronically or otherwise, and accepts no liability whatsoever for the actions of third parties in this respect. This email may contain privileged and/or confidential information. If you are not the named recipient or addressee, you are hereby notified that any use, review, disclosure, or copying of the contents herein is strictly prohibited. If you have received this email by mistake, please notify the sender immediately by reply email and discard/destroy all its contents. This email is for informational purposes and should not be construed as a solicitation or offer to buy or sell securities or related financial instruments.

SOURCE: INCRED RESEARCH, COMPANY REPORTS. APAC IS ASIA PACIFIC, EMEA IS EUROPE, MIDDLE EAST & AFRICA


Figure 3: Product revenue declined 35.8% while service revenue grew 44.2% in FY22

Rs m

FY19

FY20

FY21

FY22

Service revenue

35,270

41,380

42,992

61,987

Product revenue

1,492

459

3,636

2,333

Mix (%)

Service revenue

95.9%

98.9%

92.2%

96.4%

Product revenue

4.1%

1.1%

7.8%

3.6%

SOURCE: INCRED RESEARCH, COMPANY REPORTS

Balance sheet takeaways:

Liquidity: As on 31 Mar 2022, Coforge has Rs4,468m as cash & cash equivalents, and Rs67m as bank balances other than cash & cash equivalents.

Borrowings: The company has non-current borrowings of Rs3,365m (Rs3m in FY21) and Rs180m (Rs7m in FY21) as current borrowings. Borrowings have increased to fund SLK Global’s acquisition. 

Capex: Gross block addition in property, plant & equipment stood at Rs991m (vs. Rs521m in FY21), which was mostly led by addition in computers (Rs800m), vehicles (Rs112m), and office equipment & others (Rs44m). Capital work-in-progress stood at Rs86m (vs. Rs2m in FY21).

Goodwill valuation increased from Rs4,226m to Rs10,708m led by SLK Global acquisition. Gross addition in intangibles stood at Rs3,230m due to acquisitions and Rs347m due to acquired software, with net carrying amount of intangibles at Rs3,199m vs. Rs1,464m in FY21.

Figure 4: SLK Global’s acquisition led to an increase in overall goodwill valuation by 153.4% to Rs10,708m

Particulars (Rs m)

FY19

FY20

FY21

FY22

Cash & investments

9,227

9,171

8,246

4,535

Trade receivables & unbilled revenue

7,126

10,813

10,683

13,894

Other current assets

2,753

1,526

2,008

3,780

Total current assets

19,106

21,510

20,937

22,209

Net fixed assets

4,205

4,808

4,518

6,014

Other long-term assets

5,393

8,080

9,578

21,321

Total long-term assets

9,598

12,888

14,096

27,335

Total assets

28,704

34,398

35,033

49,544

Short-term debt & lease liabilities

0

0

275

594

Accounts payable

1,647

2,634

3,398

6,160

Other current liabilities

4,489

5,308

4,752

5,038

Total current liabilities

6,136

7,942

8,425

11,792

Long-term debt & lease liabilities

100

48

551

4302

Other long-term liabilities

1,670

2,443

1,396

5,136

Total long-term liabilities

1,770

2,491

1,947

9,438

Total debt

100

48

826

4,896

Total equity

20,798

23,965

24,661

28,314

Total equity & liabilities

28,704

34,398

35,033

49,544

SOURCE: INCRED RESEARCH, COMPANY REPORTS


Cash flow takeaways:

Operating cash flow (OCF) was up by 0.4% in FY22 at Rs7,656m as higher operating profit before working capital changes (up 33.3%) was offset by higher working capital led by trade receivables (up 30.1% yoy) and in turn impacted cash flow and conversion (OCF/EBITDA was at 69.5% in FY22 vs. 97.8% in FY21), although it was still healthy. Capex was up by 97.1% in FY22 at Rs1,541m, which impacted free cash flow (down 10.6% in FY22 at Rs6,116m). The company’s board maintained interim dividend of Rs13 per share through the quarters in FY22 with total interim dividend being Rs52 per share in FY22 (vs. Rs13 in FY21) and the dividend payout ratio at ~49%.

Figure 5: Cash conversion & cash payout was healthy

Particulars (Rs m)

FY19

FY20

FY21

FY22

OCF before WC changes

6,422

7,447

8,803

11,735

Changes in working capital

-713

-2,664

502

-1,433

Taxes paid

-1,182

-1,814

-1,682

-2,646

Operating cash flow

4,527

2,969

7,623

7,656

Capex

-703

-725

-782

-1,541

Investing cash flow

-2,300

1,123

-2,354

-9,564

Payout

1,086

1,469

4,852

3,748

Financing cash flow

-1,063

-1,327

-5,531

-1,558

OCF/revenue

12.3%

7.1%

16.3%

11.9%

OCF/EBITDA

69.8%

41.0%

97.8%

69.5%

Payout % free cash flow

28.4%

65.5%

70.9%

61.3%

SOURCE: INCRED RESEARCH, COMPANY REPORTS


Figure 6: Compensation trend of CEO & Executive Director Mr. Sudhir Singh

Particular (Rs m)

FY20

FY21

FY22

Salary

119.5

35.6

45.4

Stock options

14.7

77.1

104.2

Performance-linked bonus

0.0

33.0

69.6

Others

0.0

2.8

3.8

Total

134.2

148.4

223.0

% of PAT

3.0%

3.3%

3.4%

SOURCE: INCRED RESEARCH, COMPANY REPORTS NOTE: MR SUDHIR SINGH WAS APPOINTED AS CEO & EXECUTIVE DIRECTOR ON 29 JAN 2020 VS. CEO EARLIER


Figure 7: Performance of key subsidiaries

Key subsidiaries (Rs m)

FY20

FY21

FY22

Coforge Advantage Go

Revenue

2,448

3,173

2,314

PBT

815

1,110

202

PBT margin

33.3%

35.0%

8.7%

Coforge DPA Pvt Ltd

Revenue

1,393

2,341

3,318

PBT

539

1,347

1,926

PBT margin

38.7%

57.5%

58.1%

Step-down subsidiaries of Coforge DPA Pvt ltd

Coforge BPM Inc

Revenue

1,421

1,906

2,058

PBT

504

337

98

PBT margin

35.4%

17.7%

4.8%

Coforge DPA Australia Pty ltd

Revenue

1,490

1,726

2,336

PBT

-69

65

58

PBT margin

-4.6%

3.8%

2.5%

Coforge DPA UK Ltd

Revenue

2,129

2,550

3,057

PBT

140

428

706

PBT margin

6.6%

16.8%

23.1%

Coforge DPA NA Inc, US

Revenue

694

846

1,166

PBT

-45

33

75

PBT margin

-6.5%

3.9%

6.5%

Coforge SF Pvt Ltd (erstwhile Whishworks IT Consulting Pvt Ltd)

Revenue

639

673

875

PBT

573

260

398

PBT margin

89.7%

38.6%

45.5%

Step-down subsidiary of Coforge SF Pvt ltd

Coforge SF Ltd, UK

Revenue

1,639

2,311

2.302

PBT

355

327

317

PBT margin

21.7%

14.1%

13.8%

SOURCE: INCRED RESEARCH, COMPANY REPORTS


Figure 8: Contingent liabilities up 207.3% yoy in FY22

Contingent liabilities (Rs m)

FY21

FY22

Income-tax demands in dispute

                368

                877

Others

                   -  

                254

Total contingent liabilities

                368

             1,131

Total contingent liabilities per share

5.9

18.2

SOURCE: INCRED RESEARCH, COMPANY REPORTS


Figure 9: Change in our earnings estimates

Y/E, Mar (Rs m)

FY23F

FY24F

New

Old

% change

New

Old

% change

US$ revenue

1,028

1,049

-2.0

1,189

1,227

-3.1

Revenue

79,857

79,696

0.2

93,955

94,460

-0.5

EBIT

11,389

12,114

-6.0

13,717

14,268

-3.9

EBIT Margin (%)

14.3

15.2

 (94) bp

14.6

15.1

 (50) bp

Net PAT

7,935

8,536

-7.0

10,135

10,303

-1.6

EPS (Rs)

127.6

137.5

-7.0

163.0

166.0

-1.6

SOURCE: INCRED RESEARCH, COMPANY REPORTS


BY THE NUMBERS

Profit & Loss
(Rs mn) Mar-20A Mar-21A Mar-22A Mar-23F Mar-24F
Total Net Revenues 41,839 46,628 64,320 79,857 93,955
Gross Profit 14,311 14,935 20,584 25,648 30,348
Operating EBITDA 7,198 7,865 11,155 14,112 16,912
Depreciation And Amortisation (1,730) (1,836) (2,272) (2,723) (3,194)
Operating EBIT 5,468 6,029 8,883 11,389 13,717
Financial Income/(Expense) (50) (34) (538) (519) (360)
Pretax Income/(Loss) from Assoc.
Non-Operating Income/(Expense) 572 217 406 477 432
Profit Before Tax (pre-EI) 5,990 6,212 8,751 11,347 13,790
Exceptional Items
Pre-tax Profit 5,990 6,212 8,751 11,347 13,790
Taxation (1,278) (1,302) (1,468) (2,524) (3,075)
Exceptional Income - post-tax 71 180
Profit After Tax 4,783 5,090 7,283 8,823 10,714
Minority Interests (236) (104) (530) (888) (580)
Preferred Dividends
FX Gain/(Loss) - post tax
Other Adjustments - post-tax
Net Profit 4,547 4,986 6,753 7,935 10,135
Recurring Net Profit 4,476 4,806 6,753 7,935 10,135
Fully Diluted Recurring Net Profit 4,476 4,806 6,753 7,935 10,135
Cash Flow
(Rs mn) Mar-20A Mar-21A Mar-22A Mar-23F Mar-24F
EBITDA 7,198 7,865 11,155 14,112 16,912
Cash Flow from Invt. & Assoc.
Change In Working Capital (2,664) 502 (1,433) (1,674) (1,661)
(Incr)/Decr in Total Provisions
Other Non-Cash (Income)/Expense 249 938 (530) (888) (580)
Other Operating Cashflow
Net Interest (Paid)/Received (650) (736) (736)
Tax Paid (1,814) (1,682) (2,646) (2,524) (3,075)
Cashflow From Operations 2,969 7,623 5,896 8,290 10,860
Capex (725) (782) (1,541) (1,160) (4,221)
Disposals Of FAs/subsidiaries
Acq. Of Subsidiaries/investments
Other Investing Cashflow 1,848 (1,572) (8,023) 695 808
Cash Flow From Investing 1,123 (2,354) (9,564) (465) (3,413)
Debt Raised/(repaid)
Proceeds From Issue Of Shares
Shares Repurchased (4,166)
Dividends Paid (1,469) (686) (3,748) (3,793) (4,814)
Preferred Dividends
Other Financing Cashflow 142 (679) 2,190
Cash Flow From Financing (1,327) (5,531) (1,558) (3,793) (4,814)
Total Cash Generated 2,765 (262) (5,226) 4,031 2,633
Free Cashflow To Equity 2,244 6,841 4,355 7,130 6,639
Free Cashflow To Firm 4,092 5,269 (3,018) 8,560 8,183

BY THE NUMBERS…cont’d

Balance Sheet
(Rs mn) Mar-20A Mar-21A Mar-22A Mar-23F Mar-24F
Total Cash And Equivalents 9,171 8,246 4,535 8,566 11,200
Total Debtors 10,813 10,683 13,894 15,315 18,019
Inventories
Total Other Current Assets 1,526 2,008 3,780 3,780 3,780
Total Current Assets 21,510 20,937 22,209 27,661 32,999
Fixed Assets 4,808 4,518 6,014 4,451 5,477
Total Investments 650 2,187 2,719 2,719 2,719
Intangible Assets 5,988 5,690 14,821 14,821 14,821
Total Other Non-Current Assets 1,442 1,701 3,781 3,781 3,781
Total Non-current Assets 12,888 14,096 27,335 25,772 26,798
Short-term Debt 275 594 594 594
Current Portion of Long-Term Debt
Total Creditors 2,634 3,398 6,160 5,907 6,950
Other Current Liabilities 5,308 4,752 5,038 5,038 5,038
Total Current Liabilities 7,942 8,425 11,792 11,539 12,582
Total Long-term Debt 48 551 4,302 4,302 4,302
Hybrid Debt - Debt Component
Total Other Non-Current Liabilities 2,443 1,396 5,136 5,136 5,136
Total Non-current Liabilities 2,491 1,947 9,438 9,438 9,438
Total Provisions
Total Liabilities 10,433 10,372 21,230 20,977 22,020
Shareholders Equity 23,965 24,661 27,331 31,473 36,794
Minority Interests 983 983 983
Total Equity 23,965 24,661 28,314 32,456 37,777
Key Ratios
(Rs mn) Mar-20A Mar-21A Mar-22A Mar-23F Mar-24F
Revenue Growth 13.8% 11.4% 37.9% 24.2% 17.7%
Operating EBITDA Growth 11.6% 9.3% 41.8% 26.5% 19.8%
Operating EBITDA Margin 17.2% 16.9% 17.3% 17.7% 18.0%
Net Cash Per Share (Rs) 146.06 119.71 (5.82) 59.03 101.38
BVPS (Rs) 383.67 397.88 440.34 506.17 591.74
Gross Interest Cover 35.28 42.16 13.67 15.47 18.64
Effective Tax Rate 21.3% 21.0% 16.8% 22.2% 22.3%
Net Dividend Payout Ratio 46.1% 16.4% 46.7% 47.8% 47.5%
Accounts Receivables Days 78.25 84.13 69.73 66.75 64.75
Inventory Days
Accounts Payables Days 28.38 34.73 39.88 40.63 36.89
ROIC (%) 33.0% 28.6% 44.9% 28.5% 34.2%
ROCE (%) 19.2% 19.3% 25.2% 25.1% 26.6%
Return On Average Assets 15.1% 14.2% 18.3% 17.9% 19.4%
Key Drivers
(Rs mn) Mar-20A Mar-21A Mar-22A Mar-23F Mar-24F
Outstanding Orderbook N/A N/A N/A N/A N/A
Order Book Depletion N/A N/A N/A N/A N/A
(Please link your key drivers and assumptions from EFA Sheet here) - Delete this line once done N/A N/A N/A N/A N/A
SOURCES: INCRED RESEARCH, COMPANY REPORTS

DISCLAIMER


This report (including the views and opinions expressed therein, and the information comprised therein) has been prepared by Incred Research Services Private Ltd.(formerly known as Earnest Innovation Partners Private Limited) (hereinafter referred to as “IRSPL”). IRSPL is registered with SEBI as a Research Analyst vide Registration No. INH000007793. Pursuant to a trademark agreement, IRSPL has adopted “Incred Equities” as its trademark for use in this report.

The term “IRSPL” shall, unless the context otherwise requires, mean IRSPL and its affiliates, subsidiaries and related companies. This report is not directed or intended for distribution to or use by any person or entity resident in a state, country or any jurisdiction, where such distribution, publication, availability or use would be contrary to law, regulation or which would subject IRSPL and its affiliates/group companies to registration or licensing requirements within such jurisdictions.

This report is being supplied to you strictly on the basis that it will remain confidential. No part of this report may be (i) copied, photocopied, duplicated, stored or reproduced in any form by any means; or (ii) redistributed or passed on, directly or indirectly, to any other person in whole or in part, for any purpose without the prior written consent of IRSPL.

The information contained in this report is prepared from data believed to be correct and reliable at the time of issue of this report.

IRSPL is not required to issue regular reports on the subject matter of this report at any frequency and it may cease to do so or change the periodicity of reports at any time. IRSPL is not under any obligation to update this report in the event of a material change to the information contained in this report. IRSPL has not any and will not accept any, obligation to (i) check or ensure that the contents of this report remain current, reliable or relevant; (ii) ensure that the content of this report constitutes all the information a prospective investor may require; (iii) ensure the adequacy, accuracy, completeness, reliability or fairness of any views, opinions and information, and accordingly, IRSPL and its affiliates/group companies (and their respective directors, associates, connected persons and/or employees) shall not be liable in any manner whatsoever for any consequences (including but not limited to any direct, indirect or consequential losses, loss of profits and damages) of any reliance thereon or usage thereof.

Unless otherwise specified, this report is based upon reasonable sources. Such sources will, unless otherwise specified, for market data, be market data and prices available from the main stock exchange or market where the relevant security is listed, or, where appropriate, any other market. Information on the accounts and business of company(ies) will generally be based on published statements of the company(ies), information disseminated by regulatory information services, other publicly available information and information resulting from our research. Whilst every effort is made to ensure that statements of facts made in this report are accurate, all estimates, projections, forecasts, expressions of opinion and other subjective judgments contained in this report are based on assumptions considered to be reasonable as of the date of the document in which they are contained and must not be construed as a representation that the matters referred to therein will occur. Past performance is not a reliable indicator of future performance. The value of investments may go down as well as up and those investing may, depending on the investments in question, lose more than the initial investment. No report shall constitute an offer or an invitation by or on behalf of IRSPL and its affiliates/group companies to any person to buy or sell any investments.

The opinions expressed are based on information which are believed to be accurate and complete and obtained through reliable public or other non-confidential sources at the time made. (Information barriers and other arrangements may be established where necessary to prevent conflicts of interests arising. However, the analyst(s) may receive compensation that is based on his/their coverage of company(ies) in the performance of his/their duties or the performance of his/their recommendations. In reviewing this report, an investor should be aware that any or all of the foregoing, among other things, may give rise to real or potential conflicts of interest. Additional information is, subject to the duties of confidentiality, available on request.

The report is not a “prospectus” as defined under Indian Law, including the Companies Act, 2013, and is not, and shall not be, approved by, or filed or registered with, any Indian regulator, including any Registrar of Companies in India, SEBI, any Indian stock exchange, or the Reserve Bank of India. No offer, or invitation to offer, or solicitation of subscription with respect to any such securities listed or proposed to be listed in India is being made, or intended to be made, to the public, or to any member or section of the public in India, through or pursuant to this report.

The research analysts, strategists or economists principally responsible for the preparation of this research report are segregated from the other activities of IRSPL. Information barriers and other arrangements have been established, as required, to prevent any conflicts of interests.

The research analysts, strategists or economists principally responsible for the preparation of this research report are segregated from the other activities of IRSPL. Information barriers and other arrangements have been established, as required, to prevent any conflicts of interests.

IRSPL may have issued other reports (based on technical analysis, event specific, short term views etc.) that are inconsistent with and reach different conclusion from the information presented in this report.

Holding of Analysts/Relatives of Analysts, IRSPL and Associates of IRSPL in the covered securities, as on the date of publishing of this report


Analyst/

Analyst/

Relative

Entity/

Entity/

Associates

any financial interests in the company covered in this report (subject company) and nature of such financial interest

NO

NO

actual/beneficial ownership of 1% or more in securities of the subject company at the end of the month immediately preceding the date of publication of the research report

actual/beneficial ownership of 1% or more in securities of the subject company at the end of the month immediately preceding the date of publication of the research report

or date of the public appearance;

NO

NO

any other material conflict of interest at the time of publication of the research report

any other material conflict of interest at the time of publication of the research report

or at the time of public appearance

NO

NO

received any compensation from the subject company in the past twelve months

received any compensation from the subject company in the past twelve months

for investment banking or merchant banking or brokerage services or investment advisory or depository or distribution from the subject company in the last twelve months for products/services other than investment banking or merchant banking or broker- age services or investment advisory or depository or distribution from the subject company in the last twelve months

NO

NO

managed or co-managed public offering of securities for the subject company in the last twelve months

NO

NO

received any compensation or other benefits from the subject company or third party in connection with the research report

NO

NO

served as an officer, director or employee of the subject company

NO

NO

been engaged in market making activity for the subject company

NO

NO

Analyst declaration

·         The analyst responsible for the production of this report hereby certifies that the views expressed herein accurately and exclusively reflect his or her personal views and opinions about any and all of the issuers or securities analysed in this report and were prepared independently and autonomously in an unbiased manner.

·         No part of the compensation of the analyst(s) was, is, or will be directly or indirectly related to the inclusion of specific recommendations(s) or view(s) in this report or based any specific investment banking transaction.

·         The analyst(s) has(have) not had any serious disciplinary action taken against him/her(them).

·         The analyst, strategist, or economist does not have any material conflict of interest at the time of publication of this report.

·         The analyst(s) has(have) received compensation based upon various factors, including quality, accuracy and value of research, overall firm performance, client feedback and competitive factors.

This report (including the views and opinions expressed therein, and the information comprised therein) has been prepared by Incred Research Services Private Ltd.(formerly known as Earnest Innovation Partners Private Limited) (hereinafter referred to as “IRSPL”). IRSPL is registered with SEBI as a Research Analyst vide Registration No. INH000007793. Pursuant to a trademark agreement, IRSPL has adopted “Incred Equities” as its trademark for use in this report.

The term “IRSPL” shall, unless the context otherwise requires, mean IRSPL and its affiliates, subsidiaries and related companies. This report is not directed or intended for distribution to or use by any person or entity resident in a state, country or any jurisdiction, where such distribution, publication, availability or use would be contrary to law, regulation or which would subject IRSPL and its affiliates/group companies to registration or licensing requirements within such jurisdictions.

This report is being supplied to you strictly on the basis that it will remain confidential. No part of this report may be (i) copied, photocopied, duplicated, stored or reproduced in any form by any means; or (ii) redistributed or passed on, directly or indirectly, to any other person in whole or in part, for any purpose without the prior written consent of IRSPL.

The information contained in this report is prepared from data believed to be correct and reliable at the time of issue of this report.

IRSPL is not required to issue regular reports on the subject matter of this report at any frequency and it may cease to do so or change the periodicity of reports at any time. IRSPL is not under any obligation to update this report in the event of a material change to the information contained in this report. IRSPL has not any and will not accept any, obligation to (i) check or ensure that the contents of this report remain current, reliable or relevant; (ii) ensure that the content of this report constitutes all the information a prospective investor may require; (iii) ensure the adequacy, accuracy, completeness, reliability or fairness of any views, opinions and information, and accordingly, IRSPL and its affiliates/group companies (and their respective directors, associates, connected persons and/or employees) shall not be liable in any manner whatsoever for any consequences (including but not limited to any direct, indirect or consequential losses, loss of profits and damages) of any reliance thereon or usage thereof.

Unless otherwise specified, this report is based upon reasonable sources. Such sources will, unless otherwise specified, for market data, be market data and prices available from the main stock exchange or market where the relevant security is listed, or, where appropriate, any other market. Information on the accounts and business of company(ies) will generally be based on published statements of the company(ies), information disseminated by regulatory information services, other publicly available information and information resulting from our research. Whilst every effort is made to ensure that statements of facts made in this report are accurate, all estimates, projections, forecasts, expressions of opinion and other subjective judgments contained in this report are based on assumptions considered to be reasonable as of the date of the document in which they are contained and must not be construed as a representation that the matters referred to therein will occur. Past performance is not a reliable indicator of future performance. The value of investments may go down as well as up and those investing may, depending on the investments in question, lose more than the initial investment. No report shall constitute an offer or an invitation by or on behalf of IRSPL and its affiliates/group companies to any person to buy or sell any investments.

The opinions expressed are based on information which are believed to be accurate and complete and obtained through reliable public or other non-confidential sources at the time made. (Information barriers and other arrangements may be established where necessary to prevent conflicts of interests arising. However, the analyst(s) may receive compensation that is based on his/their coverage of company(ies) in the performance of his/their duties or the performance of his/their recommendations. In reviewing this report, an investor should be aware that any or all of the foregoing, among other things, may give rise to real or potential conflicts of interest. Additional information is, subject to the duties of confidentiality, available on request.

The report is not a “prospectus” as defined under Indian Law, including the Companies Act, 2013, and is not, and shall not be, approved by, or filed or registered with, any Indian regulator, including any Registrar of Companies in India, SEBI, any Indian stock exchange, or the Reserve Bank of India. No offer, or invitation to offer, or solicitation of subscription with respect to any such securities listed or proposed to be listed in India is being made, or intended to be made, to the public, or to any member or section of the public in India, through or pursuant to this report.

The research analysts, strategists or economists principally responsible for the preparation of this research report are segregated from the other activities of IRSPL. Information barriers and other arrangements have been established, as required, to prevent any conflicts of interests.

The research analysts, strategists or economists principally responsible for the preparation of this research report are segregated from the other activities of IRSPL. Information barriers and other arrangements have been established, as required, to prevent any conflicts of interests.

IRSPL may have issued other reports (based on technical analysis, event specific, short term views etc.) that are inconsistent with and reach different conclusion from the information presented in this report.

Holding of Analysts/Relatives of Analysts, IRSPL and Associates of IRSPL in the covered securities, as on the date of publishing of this report


Analyst/

Relative

Entity/

Associates

any financial interests in the company covered in this report (subject company) and nature of such financial interest

NO

NO

actual/beneficial ownership of 1% or more in securities of the subject company at the end of the month immediately preceding the date of publication of the research report

or date of the public appearance;

NO

NO

any other material conflict of interest at the time of publication of the research report

or at the time of public appearance

NO

NO

received any compensation from the subject company in the past twelve months

for investment banking or merchant banking or brokerage services or investment advisory or depository or distribution from the subject company in the last twelve months for products/services other than investment banking or merchant banking or broker- age services or investment advisory or depository or distribution from the subject company in the last twelve months

NO

NO

managed or co-managed public offering of securities for the subject company in the last twelve months

NO

NO

received any compensation or other benefits from the subject company or third party in connection with the research report

NO

NO

served as an officer, director or employee of the subject company

NO

NO

been engaged in market making activity for the subject company

NO

NO

Analyst declaration

·         The analyst responsible for the production of this report hereby certifies that the views expressed herein accurately and exclusively reflect his or her personal views and opinions about any and all of the issuers or securities analysed in this report and were prepared independently and autonomously in an unbiased manner.

·         No part of the compensation of the analyst(s) was, is, or will be directly or indirectly related to the inclusion of specific recommendations(s) or view(s) in this report or based any specific investment banking transaction.

·         The analyst(s) has(have) not had any serious disciplinary action taken against him/her(them).

·         The analyst, strategist, or economist does not have any material conflict of interest at the time of publication of this report.

·         The analyst(s) has(have) received compensation based upon various factors, including quality, accuracy and value of research, overall firm performance, client feedback and competitive factors.


IRSPL and/or its affiliates and/or its Directors/employees may own or have positions in securities of the company(ies) covered in this report or any securities related thereto and may from time to time add to or dispose of, or may be materially interested in, any such securities.

IRSPL and/or its affiliates and/or its Directors/employees may own or have positions in securities of the company(ies) covered in this report or any securities related thereto and may from time to time add to or dispose of, or may be materially interested in, any such securities.

IRSPL and/or its affiliates and/or its Directors/employees may do and seek to do business with the company(ies) covered in this research report and may from time to time (a) buy/sell the securities covered in this report, from time to time and/or (b) act as market maker or have assumed an underwriting commitment in securities of such company(ies), and/or (c) may sell them to or buy them from customers on a principal basis and/or (d) may also perform or seek to perform significant investment banking, advisory, underwriting or placement services for or relating to such company(ies) and/or (e) solicit such investment, advisory or other services from any entity mentioned in thisreport and/or (f) act as a lender/borrower to such company and may earn brokerage or other compensation. However, Analysts are forbidden to acquire, on their own account or hold securities (physical or uncertificated, including derivatives) of companies in respect of which they are compiling and producing financial recommendations or in the result of which they play a key part.


DISCLAIMER

This report (including the views and opinions expressed therein, and the information comprised therein) has been prepared by Incred Research Services Private Ltd.(formerly known as Earnest Innovation Partners Private Limited) (hereinafter referred to as “ IRSPL”). IRSPL is registered with SEBI as a Research Analyst vide Registration No. INH000007793. Pursuant to a trademark agreement, IRSPL has adopted “Incred Equities ” as its trademark for use in this report.

The term “IRSPL” shall, unless the context otherwise requires, mean IRSPL and its affiliates, subsidiaries and related companies. This report is not directed or intended for distribution to or use by any person or entity resident in a state, country or any jurisdiction, where such distribution, publication, availability or use would be contrary to law, regulation or which would subject IRSPL and its affiliates/group companies to registration or licensing requirements within such jurisdictions.

This report is being supplied to you strictly on the basis that it will remain confidential. No part of this report may be (i) copied, photocopied, duplicated, stored or reproduced in any form by any means; or (ii) redistributed or passed on, directly or indirectly, to any other person in whole or in part, for any purpose without the prior written consent of IRSPL.

The information contained in this report is prepared from data believed to be correct and reliable at the time of issue of this report.

IRSPL is not required to issue regular reports on the subject matter of this report at any frequency and it may cease to do so or change the periodicity of reports at any time. IRSPL is not under any obligation to update this report in the event of a material change to the information contained in this report. IRSPL has not any and will not accept any, obligation to (i) check or ensure that the contents of this report remain current, reliable or relevant; (ii) ensure that the content of this report constitutes all the information a prospective investor may require; (iii) ensure the adequacy, accuracy, completeness, reliability or fairness of any views, opinions and information, and accordingly, IRSPL and its affiliates/group companies (and their respective directors, associates, connected persons and/or employees) shall not be liable in any manner whatsoever for any consequences (including but not limited to any direct, indirect or consequential losses, loss of profits and damages) of any reliance thereon or usage thereof.

Unless otherwise specified, this report is based upon reasonable sources. Such sources will, unless otherwise specified, for market data, be market data and prices available from the main stock exchange or market where the relevant security is listed, or, where appropriate, any other market. Information on the accounts and business of company(ies) will generally be based on published statements of the company(ies), information disseminated by regulatory information services, other publicly available information and information resulting from our research. Whilst every effort is made to ensure that statements of facts made in this report are accurate, all estimates, projections, forecasts, expressions of opinion and other subjective judgments contained in this report are based on assumptions considered to be reasonable as of the date of the document in which they are contained and must not be construed as a representation that the matters referred to therein will occur. Past performance is not a reliable indicator of future performance. The value of investments may go down as well as up and those investing may, depending on the investments in question, lose more than the initial investment. No report shall constitute an offer or an invitation by or on behalf of IRSPL and its affiliates/group companies to any person to buy or sell any investments.

The opinions expressed are based on information which are believed to be accurate and complete and obtained through reliable public or other non-confidential sources at the time made. (Information barriers and other arrangements may be established where necessary to prevent conflicts of interests arising. However, the analyst(s) may receive compensation that is based on his/their coverage of company(ies) in the performance of his/their duties or the performance of his/their recommendations. In reviewing this report, an investor should be aware that any or all of the foregoing, among other things, may give rise to real or potential conflicts of interest. Additional information is, subject to the duties of confidentiality, available on request.

The report is not a “prospectus” as defined under Indian Law, including the Companies Act, 2013, and is not, and shall not be, approved by, or filed or registered with, any Indian regulator, including any Registrar of Companies in India, SEBI, any Indian stock exchange, or the Reserve Bank of India. No offer, or invitation to offer, or solicitation of subscription with respect to any such securities listed or proposed to be listed in India is being made, or intended to be made, to the public, or to any member or section of the public in India, through or pursuant to this report.

The research analysts, strategists or economists principally responsible for the preparation of this research report are segregated from the other activities of IRSPL. Information barriers and other arrangements have been established, as required, to prevent any conflicts of interests.

The research analysts, strategists or economists principally responsible for the preparation of this research report are segregated from the other activities of IRSPL. Information barriers and other arrangements have been established, as required, to prevent any conflicts of interests.

IRSPL may have issued other reports (based on technical analysis, event specific, short term views etc.) that are inconsistent with and reach different conclusion from the information presented in this report.

Holding of Analysts/Relatives of Analysts, IRSPL and Associates of IRSPL in the covered securities, as on the date of publishing of this report

Analyst/ Relative Entity/ Associates
any financial interests in the company covered in this report (subject company) and nature of such financial interest NO NO
actual/beneficial ownership of 1% or more in securities of the subject company at the end of the month immediately preceding the date of publication of the research report or date of the public appearance; NO NO
any other material conflict of interest at the time of publication of the research report or at the time of public appearance NO NO
received any compensation from the subject company in the past twelve months for investment banking or merchant banking or brokerage services or investment advisory or depository or distribution from the subject company in the last twelve months for products/services other than investment banking or merchant banking or broker- age services or investment advisory or depository or distribution from the subject company in the last twelve months NO NO
managed or co-managed public offering of securities for the subject company in the last twelve months NO NO
received any compensation or other benefits from the subject company or third party in connection with the research report NO NO
served as an officer, director or employee of the subject company NO NO
been engaged in market making activity for the subject company NO NO
Analyst declaration
  • The analyst responsible for the production of this report hereby certifies that the views expressed herein accurately and exclusively reflect his or her personal views and opinions about any and all of the issuers or securities analysed in this report and were prepared independently and autonomously in an unbiased manner.
  • No part of the compensation of the analyst(s) was, is, or will be directly or indirectly related to the inclusion of specific recommendations(s) or view(s) in this report or based any specific investment banking transaction.
  • The analyst(s) has(have) not had any serious disciplinary action taken against him/her(them). • The analyst, strategist, or economist does not have any material conflict of interest at the time of
  • publication of this report.
  • The analyst(s) has(have) received compensation based upon various factors, including quality, accuracy and value of research, overall firm performance, client feedback and competitive factors.

IRSPL and/or its affiliates and/or its Directors/employees may own or have positions in securities of the company(ies) covered in this report or any securities related thereto and may from time to time add to or dispose of, or may be materially interested in, any such securities.

IRSPL and/or its affiliates and/or its Directors/employees may do and seek to do business with the company(ies) covered in this research report and may from time to time (a) buy/sell the securities covered in this report, from time to time and/or (b) act as market maker or have assumed an underwriting commitment in securities of such company(ies), and/or (c) may sell them to or buy them from customers on a principal basis and/or (d) may also perform or seek to perform significant investment banking, advisory, underwriting or placement services for or relating to such company(ies) and/or (e) solicit such investment, advisory or other services from any entity mentioned in thisreport and/or (f) act as a lender/borrower to such company and may earn brokerage or other compensation. However, Analysts are forbidden to acquire, on their own account or hold securities (physical or uncertificated, including derivatives) of companies in respect of which they are compiling and producing financial recommendations or in the result of which they play a key part.