* price as on January 01, 0001
India
Jul 02, 2023 - 9:53 PM

Consensus ratings*: Buy 17 Hold 8 Sell 3
Previous target: 3,247
Up/downside: 1.5%
Reuters SUPI.NS
Bloomberg: SI IN
Market cap: US$4,951m
Rs406,194m
Average daily turnover: US$3.7m
Current shares o/s: 127.0m
Free float: 51.2%
*Source: Bloomberg

Key financial forecast

Mar-23A Mar-24F Mar-25F
Net Profit (Rsm) 8,653 10,166 11,458
Core EPS (Rs) 68.12 80.03 90.20
Core EPS Growth (10.6%) 17.5% 12.7%
FD Core P/E 46.94 39.96 35.45
Recurring ROE 21.0% 21.5% 21.2%
P/BV (x) 9.23 8.06 7.05
DPS (Rs) 26.00 30.01 33.01
Dividend Yield 0.81% 0.94% 1.03%
*Source: Bloomberg

Price performance
1M 3M 12M
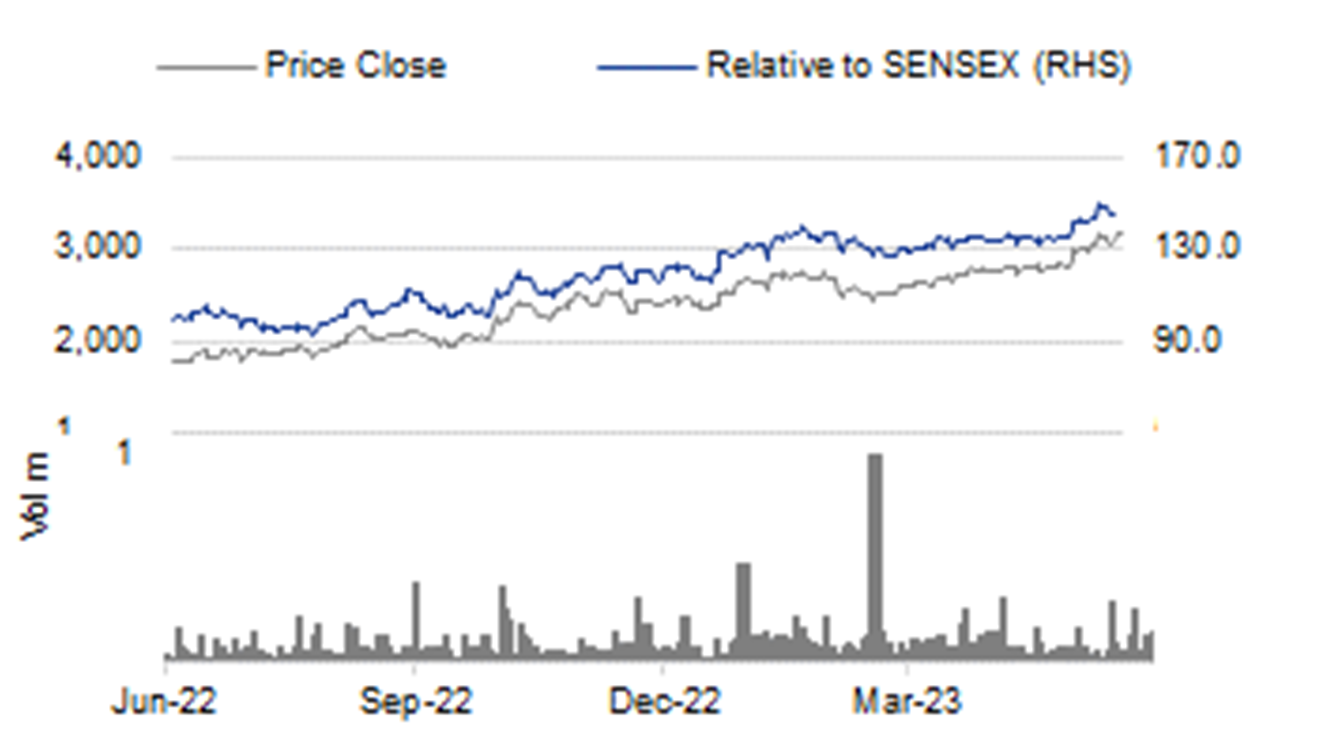
Absolute (%) 13.4 27.2 80.7
Relative (%) 9.6 16.2 47.7
Major shareholders
% held
Promoters 48.9
Nalanda India Fund 4.8
Kotak Emerging Equity Scheme 3.2
Analyst(s)

Rahul AGARWAL

T (91) 22 4161 1553
E rahul.agarwal@incredcapital.com

Harshit SARAWAGI

T (91) 22 4161 0000
E harshit.sarawagi@incredcapital.com

FY23 AGM KTAs; good 1QFY24F likely

SIL held its 80th AGM on 28 Jun 2023. Management reiterated its growth strategy, robust demand outlook, expansion plan & overall business scenario.

Apr-May 2023 saw 40%+ sales volume growth yoy driven by affordable PVC prices. Prices are down 15%+ since Mar 2023. Highest-ever capex on track.

Market share gains, channel expansion, export focus, industrial product demand improving & cost-efficient operations are key positives. Retain ADD.

Premium sales mix and timely capex to aid market share gain

Supreme Industries (SIL) expects plastic consumption to grow by 10-12% p.a. over the next two-to-three years in India. It intends to beat this growth by 2-3% p.a. driven by timely capex, plants across India, launch of premium products and channel expansion.

Brownfield expansion at five of its existing plants is a part of the highest-ever annual capex plan of Rs7.5bn for FY24F, including Rs1.5bn of carried-over capex from the last financial year. The total plastic manufacturing capacity to touch 950kt+ by Mar 2024F.

Prominent niche products in categories like bath fittings, DWC pipe system, water tanks and electrofusion & compression-moulded fittings have the potential for a Rs4-5bn/year revenue run-rate over the next three-to-five years.

FY23 value-added product (VAP) revenue was at Rs33.3bn, +14% yoy, 36% of total sales.

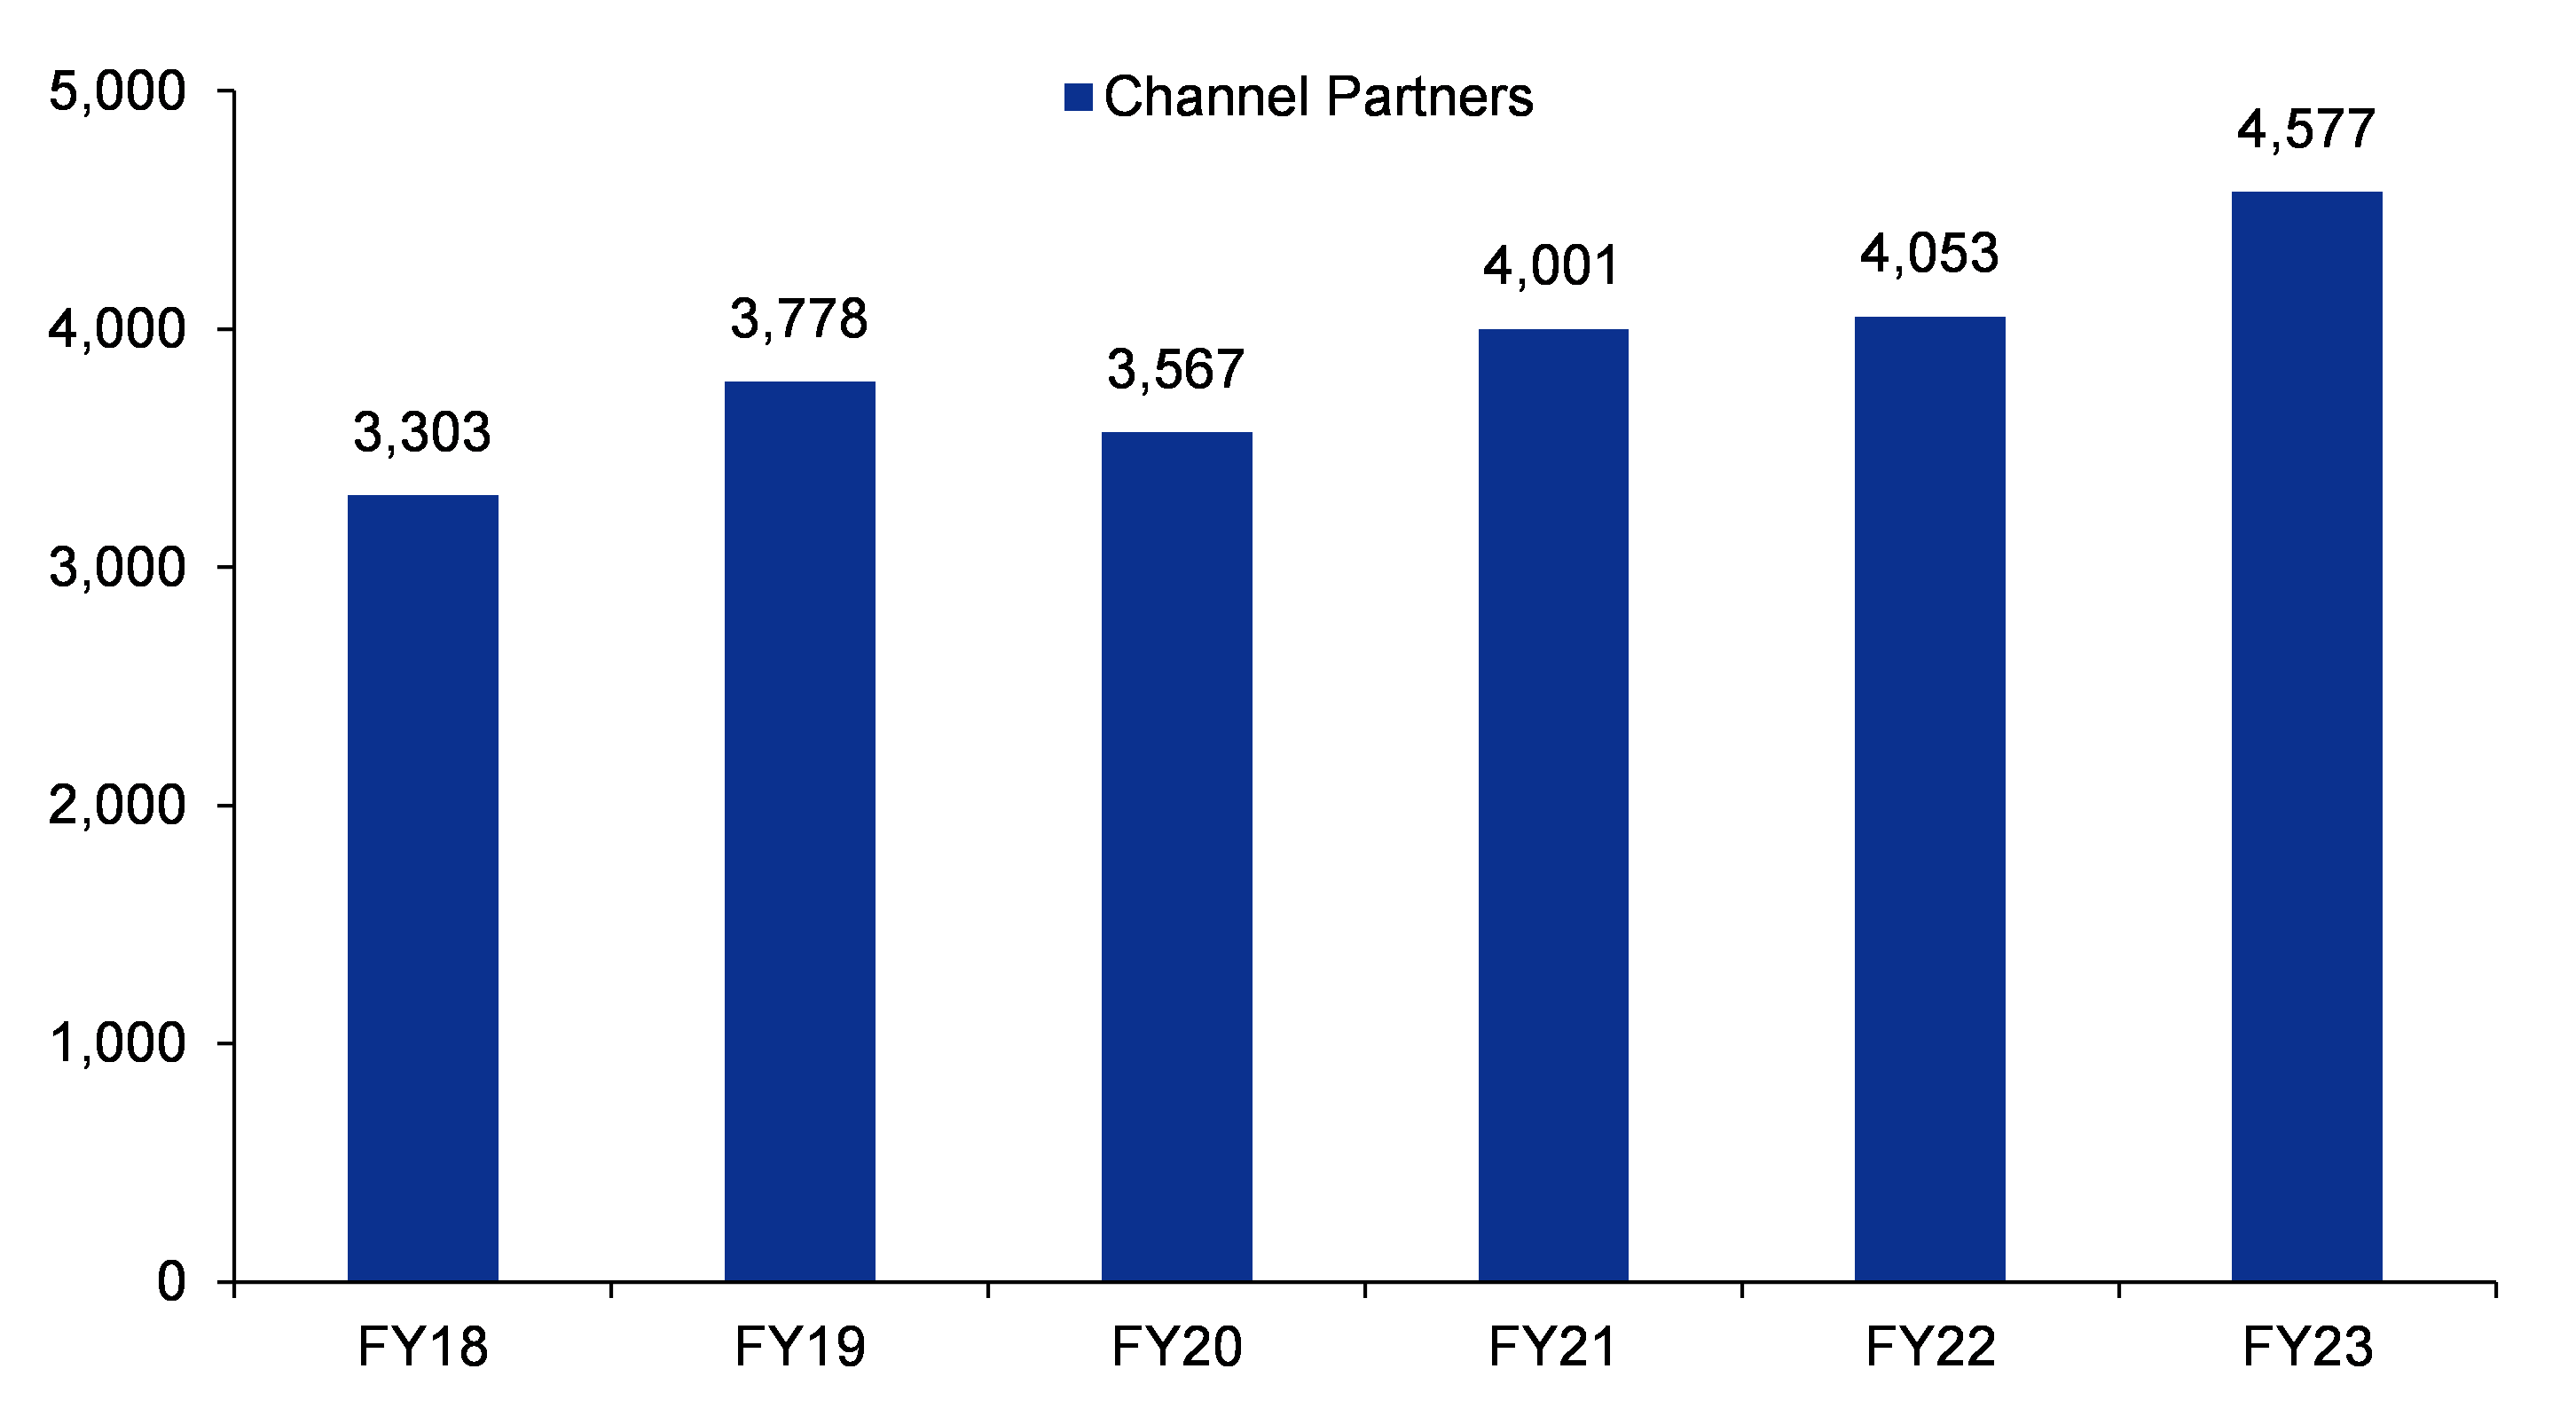
The number of active channel partners across divisions stood at 4,577, +13% yoy, at the end of Mar 2023. Channel partners have grown at a CAGR of 6.7% over FY18-23.

Segment-wise performance and outlook

Plastic pipes: SIL is adding four new systems to its existing 36 systems in the plastic piping segment in FY24F. The total plastic pipe manufacturing capacity to touch 750kt, +25% yoy, by Mar 2024F.

Industrial: Automotive parts are selling well on the back of a recovery in passenger vehicle sales volume. The appliances segment is subdued due to unseasonal rains that has led to weak secondary sales and high channel inventory. Composite LPG cylinder capacity is now at 1m cylinders, and the order backlog is at an optimum level. SIL plans to add new industrial customers in sectors like telecom, infrastructure, electricals and railways.

Packaging: Cross-laminated films continued to get impacted by fierce competition from look-alike products. SIL plans to introduce newly developed films, and a plant with annual capacity of 2.5kt should start operations by Mar 2024F.

Furniture: The downward trend in polypropylene prices should drive sales volume growth due to a reduction in the price gap with reprocessed material manufacturers. SIL had 247 showrooms as of May 2023-end, and more are being added regularly.

Apr-May 2023 has been stellar; expect a strong 1QFY24F

Revenue, including other income, for the first two months of 1QFY24F (Apr-May 2023) stood at Rs15.3bn, +10% yoy, while the sales volume stood at 96kt, +41% yoy. Including Jun 2023, we expect sales volume growth of ~20% yoy (lower agri sales in Jun 2023 as the monsoon season commenced) and EBITDA margin decline qoq in 1QFY24F. VAP sales fell to Rs4.5bn, or 30% of total sales, in Apr-May 2023.

PVC price trend

Polymer prices continued to slide down, beginning from the second week of Mar 2023. PVC resin witnessed a fall of Rs14/kg since 9 Mar 2023, nearly 15% qoq. Current prices are at ~Rs80-82/kg for supplies from Reliance Industries. This price fall would lead to a marginal one-time inventory loss in 1QFY24F, as per SIL.

Change in its board of directors

SIL has appointed Mr. Vipul Shah and Mr. Pulak Prasad as additional directors on its board. Mr. Shah has vast experience in petrochemicals, LPG/LNG marketing, etc. and was the COO at Reliance Industries. He is a director on the board of Deepak Nitrite. Mr. Prasad is the founder and managing director of Nalanda Capital and has multiple directorships in listed companies in India.

Figure 1: Capex plan for FY24F

Product segment

Plant location

Capex description

Industrial and ball valves

Malanpur - Madhya Pradesh

State-of-the-art manufacturing facility.

Olefin fittings

Jadcherla - Telangana

Brownfield expansion.

Piping products

Erode - Tamil Nadu, Cuttack - Odisha

Brownfield expansion.

HDPE DWC pipes

Erode - Tamil Nadu, Kanpur - Uttar Pradesh

New product addition.

PE pipes

Jadcherla - Telangana, Gadegaon - Maharashtra

Brownfield expansion.

PP silent piping SWR system

Gadegaon - Maharashtra

New facility for use in high-rise buildings for low noise requirement.

Cross-plastic film

Talegaon - Maharashtra

New facility for cross-plastic films.

Bath-fittings products

Puducherry

Brownfield expansion.


SOURCE: INCRED RESEARCH, COMPANY REPORTS  


Figure 2: Channel partner network expansion over the past few years
SOURCE: INCRED RESEARCH, COMPANY REPORTS  


BY THE NUMBERS

Profit & Loss
(Rs mn) Mar-22A Mar-23A Mar-24F Mar-25F
Total Net Revenues 77,728 92,016 102,109 115,166
Gross Profit 24,197 26,024 30,736 34,666
Operating EBITDA 12,421 11,997 14,143 16,124
Depreciation And Amortisation (2,295) (2,634) (2,882) (3,281)
Operating EBIT 10,126 9,363 11,260 12,843
Financial Income/(Expense) (38) 20 100 170
Pretax Income/(Loss) from Assoc. 2,044 1,533 1,227 1,227
Non-Operating Income/(Expense) 186 198 100 105
Profit Before Tax (pre-EI) 12,318 11,113 12,687 14,344
Exceptional Items
Pre-tax Profit 12,318 11,113 12,687 14,344
Taxation (2,633) (2,460) (2,521) (2,886)
Exceptional Income - post-tax
Profit After Tax 9,685 8,653 10,166 11,458
Minority Interests
Preferred Dividends
FX Gain/(Loss) - post tax
Other Adjustments - post-tax
Net Profit 9,685 8,653 10,166 11,458
Recurring Net Profit 9,685 8,653 10,166 11,458
Fully Diluted Recurring Net Profit 9,685 8,653 10,166 11,458
Balance Sheet
(Rs mn) Mar-22A Mar-23A Mar-24F Mar-25F
Total Cash And Equivalents 5,264 7,522 9,655 15,733
Total Debtors 4,668 4,924 5,464 6,163
Inventories 12,602 13,856 15,386 16,407
Total Other Current Assets 2,219 2,546 2,825 3,186
Total Current Assets 24,753 28,848 33,331 41,489
Fixed Assets 16,886 19,819 22,774 23,992
Total Investments 4,759 5,713 5,713 5,713
Intangible Assets
Total Other Non-Current Assets 3,561 2,563 2,726 2,226
Total Non-current Assets 25,206 28,094 31,212 31,931
Short-term Debt
Current Portion of Long-Term Debt
Total Creditors 7,940 9,038 10,029 11,311
Other Current Liabilities 2,064 2,322 2,576 2,906
Total Current Liabilities 10,004 11,359 12,605 14,217
Total Long-term Debt
Hybrid Debt - Debt Component
Total Other Non-Current Liabilities 607 654 654 654
Total Non-current Liabilities 607 654 654 654
Total Provisions 904 908 908 908
Total Liabilities 11,515 12,921 14,167 15,779
Shareholders Equity 38,444 44,021 50,376 57,641
Minority Interests
Total Equity 38,444 44,021 50,376 57,641
Cash Flow
(Rs mn) Mar-22A Mar-23A Mar-24F Mar-25F
EBITDA 12,421 11,997 14,143 16,124
Cash Flow from Invt. & Assoc.
Change In Working Capital (4,939) (778) (1,103) (469)
(Incr)/Decr in Total Provisions
Other Non-Cash (Income)/Expense
Other Operating Cashflow 48 (5) 1,427 1,501
Net Interest (Paid)/Received 41 64 (100) (170)
Tax Paid (2,868) (2,375) (2,521) (2,886)
Cashflow From Operations 4,704 8,903 11,845 14,101
Capex (4,699) (4,243) (6,000) (4,000)
Disposals Of FAs/subsidiaries 39 25
Acq. Of Subsidiaries/investments 139 188 (500) (500)
Other Investing Cashflow 487 538 150 222
Cash Flow From Investing (4,035) (3,493) (6,350) (4,278)
Debt Raised/(repaid) (11)
Proceeds From Issue Of Shares
Shares Repurchased
Dividends Paid (2,922) (3,049) (3,812) (4,193)
Preferred Dividends
Other Financing Cashflow (10) (15) (50) (53)
Cash Flow From Financing (2,942) (3,064) (3,862) (4,245)
Total Cash Generated (2,273) 2,347 1,633 5,578
Free Cashflow To Equity 659 5,411 5,495 9,823
Free Cashflow To Firm 619 5,331 5,445 9,770
Key Ratios
(Rs mn) Mar-22A Mar-23A Mar-24F Mar-25F
Revenue Growth 22.3% 18.4% 11.0% 12.8%
Operating EBITDA Growth (3.3%) (3.4%) 17.9% 14.0%
Operating EBITDA Margin 16.0% 13.0% 13.9% 14.0%
Net Cash Per Share (Rs) 41.44 59.21 76.01 123.86
BVPS (Rs) 302.64 346.55 396.57 453.77
Gross Interest Cover 196.62 116.74 225.21 244.62
Effective Tax Rate 21.4% 22.1% 19.9% 20.1%
Net Dividend Payout Ratio 24.7% 29.7% 30.0% 29.2%
Accounts Receivables Days 20.11 19.02 18.57 18.42
Inventory Days 68.90 73.17 74.77 72.08
Accounts Payables Days 49.10 46.95 48.75 48.38
ROIC (%) 45.8% 31.3% 34.8% 35.1%
ROCE (%) 28.2% 22.5% 23.7% 23.8%
Return On Average Assets 26.6% 20.8% 20.7% 20.5%
Key Drivers
(Rs mn) Mar-22A Mar-23A Mar-24F Mar-25F

DISCLAIMER

This report (including the views and opinions expressed therein, and the information comprised therein) has been prepared by Incred Research Services Private Ltd.(formerly known as Earnest Innovation Partners Private Limited) (hereinafter referred to as “ IRSPL”). IRSPL is registered with SEBI as a Research Analyst vide Registration No. INH000007793. Pursuant to a trademark agreement, IRSPL has adopted “Incred Equities ” as its trademark for use in this report.

The term “IRSPL” shall, unless the context otherwise requires, mean IRSPL and its affiliates, subsidiaries and related companies. This report is not directed or intended for distribution to or use by any person or entity resident in a state, country or any jurisdiction, where such distribution, publication, availability or use would be contrary to law, regulation or which would subject IRSPL and its affiliates/group companies to registration or licensing requirements within such jurisdictions.

This report is being supplied to you strictly on the basis that it will remain confidential. No part of this report may be (i) copied, photocopied, duplicated, stored or reproduced in any form by any means; or (ii) redistributed or passed on, directly or indirectly, to any other person in whole or in part, for any purpose without the prior written consent of IRSPL.

The information contained in this report is prepared from data believed to be correct and reliable at the time of issue of this report.

IRSPL is not required to issue regular reports on the subject matter of this report at any frequency and it may cease to do so or change the periodicity of reports at any time. IRSPL is not under any obligation to update this report in the event of a material change to the information contained in this report. IRSPL has not any and will not accept any, obligation to (i) check or ensure that the contents of this report remain current, reliable or relevant; (ii) ensure that the content of this report constitutes all the information a prospective investor may require; (iii) ensure the adequacy, accuracy, completeness, reliability or fairness of any views, opinions and information, and accordingly, IRSPL and its affiliates/group companies (and their respective directors, associates, connected persons and/or employees) shall not be liable in any manner whatsoever for any consequences (including but not limited to any direct, indirect or consequential losses, loss of profits and damages) of any reliance thereon or usage thereof.

Unless otherwise specified, this report is based upon reasonable sources. Such sources will, unless otherwise specified, for market data, be market data and prices available from the main stock exchange or market where the relevant security is listed, or, where appropriate, any other market. Information on the accounts and business of company(ies) will generally be based on published statements of the company(ies), information disseminated by regulatory information services, other publicly available information and information resulting from our research. Whilst every effort is made to ensure that statements of facts made in this report are accurate, all estimates, projections, forecasts, expressions of opinion and other subjective judgments contained in this report are based on assumptions considered to be reasonable as of the date of the document in which they are contained and must not be construed as a representation that the matters referred to therein will occur. Past performance is not a reliable indicator of future performance. The value of investments may go down as well as up and those investing may, depending on the investments in question, lose more than the initial investment. No report shall constitute an offer or an invitation by or on behalf of IRSPL and its affiliates/group companies to any person to buy or sell any investments.

The opinions expressed are based on information which are believed to be accurate and complete and obtained through reliable public or other non-confidential sources at the time made. (Information barriers and other arrangements may be established where necessary to prevent conflicts of interests arising. However, the analyst(s) may receive compensation that is based on his/their coverage of company(ies) in the performance of his/their duties or the performance of his/their recommendations. In reviewing this report, an investor should be aware that any or all of the foregoing, among other things, may give rise to real or potential conflicts of interest. Additional information is, subject to the duties of confidentiality, available on request.

The report is not a “prospectus” as defined under Indian Law, including the Companies Act, 2013, and is not, and shall not be, approved by, or filed or registered with, any Indian regulator, including any Registrar of Companies in India, SEBI, any Indian stock exchange, or the Reserve Bank of India. No offer, or invitation to offer, or solicitation of subscription with respect to any such securities listed or proposed to be listed in India is being made, or intended to be made, to the public, or to any member or section of the public in India, through or pursuant to this report.

The research analysts, strategists or economists principally responsible for the preparation of this research report are segregated from the other activities of IRSPL. Information barriers and other arrangements have been established, as required, to prevent any conflicts of interests.

The research analysts, strategists or economists principally responsible for the preparation of this research report are segregated from the other activities of IRSPL. Information barriers and other arrangements have been established, as required, to prevent any conflicts of interests.

IRSPL may have issued other reports (based on technical analysis, event specific, short term views etc.) that are inconsistent with and reach different conclusion from the information presented in this report.

Holding of Analysts/Relatives of Analysts, IRSPL and Associates of IRSPL in the covered securities, as on the date of publishing of this report

Analyst/ Relative Entity/ Associates
any financial interests in the company covered in this report (subject company) and nature of such financial interest NO NO
actual/beneficial ownership of 1% or more in securities of the subject company at the end of the month immediately preceding the date of publication of the research report or date of the public appearance; NO NO
any other material conflict of interest at the time of publication of the research report or at the time of public appearance NO NO
received any compensation from the subject company in the past twelve months for investment banking or merchant banking or brokerage services or investment advisory or depository or distribution from the subject company in the last twelve months for products/services other than investment banking or merchant banking or broker- age services or investment advisory or depository or distribution from the subject company in the last twelve months NO NO
managed or co-managed public offering of securities for the subject company in the last twelve months NO NO
received any compensation or other benefits from the subject company or third party in connection with the research report NO NO
served as an officer, director or employee of the subject company NO NO
been engaged in market making activity for the subject company NO NO
Analyst declaration
  • The analyst responsible for the production of this report hereby certifies that the views expressed herein accurately and exclusively reflect his or her personal views and opinions about any and all of the issuers or securities analysed in this report and were prepared independently and autonomously in an unbiased manner.
  • No part of the compensation of the analyst(s) was, is, or will be directly or indirectly related to the inclusion of specific recommendations(s) or view(s) in this report or based any specific investment banking transaction.
  • The analyst(s) has(have) not had any serious disciplinary action taken against him/her(them). • The analyst, strategist, or economist does not have any material conflict of interest at the time of
  • publication of this report.
  • The analyst(s) has(have) received compensation based upon various factors, including quality, accuracy and value of research, overall firm performance, client feedback and competitive factors.

IRSPL and/or its affiliates and/or its Directors/employees may own or have positions in securities of the company(ies) covered in this report or any securities related thereto and may from time to time add to or dispose of, or may be materially interested in, any such securities.

IRSPL and/or its affiliates and/or its Directors/employees may do and seek to do business with the company(ies) covered in this research report and may from time to time (a) buy/sell the securities covered in this report, from time to time and/or (b) act as market maker or have assumed an underwriting commitment in securities of such company(ies), and/or (c) may sell them to or buy them from customers on a principal basis and/or (d) may also perform or seek to perform significant investment banking, advisory, underwriting or placement services for or relating to such company(ies) and/or (e) solicit such investment, advisory or other services from any entity mentioned in thisreport and/or (f) act as a lender/borrower to such company and may earn brokerage or other compensation. However, Analysts are forbidden to acquire, on their own account or hold securities (physical or uncertificated, including derivatives) of companies in respect of which they are compiling and producing financial recommendations or in the result of which they play a key part.