* price as on January 01, 0001
India
Consensus ratings*: Buy 49 Hold 1 Sell 0
Previous target: 800
Up/downside: 35.8%
Reuters
Bloomberg: SBIN IN
Market cap: US$72,415m
Rs5,258,382m
Average daily turnover: US$131.0m
Current shares o/s: 8,924.6m
Free float: 40.0%
*Source: Bloomberg

Key changes in this note

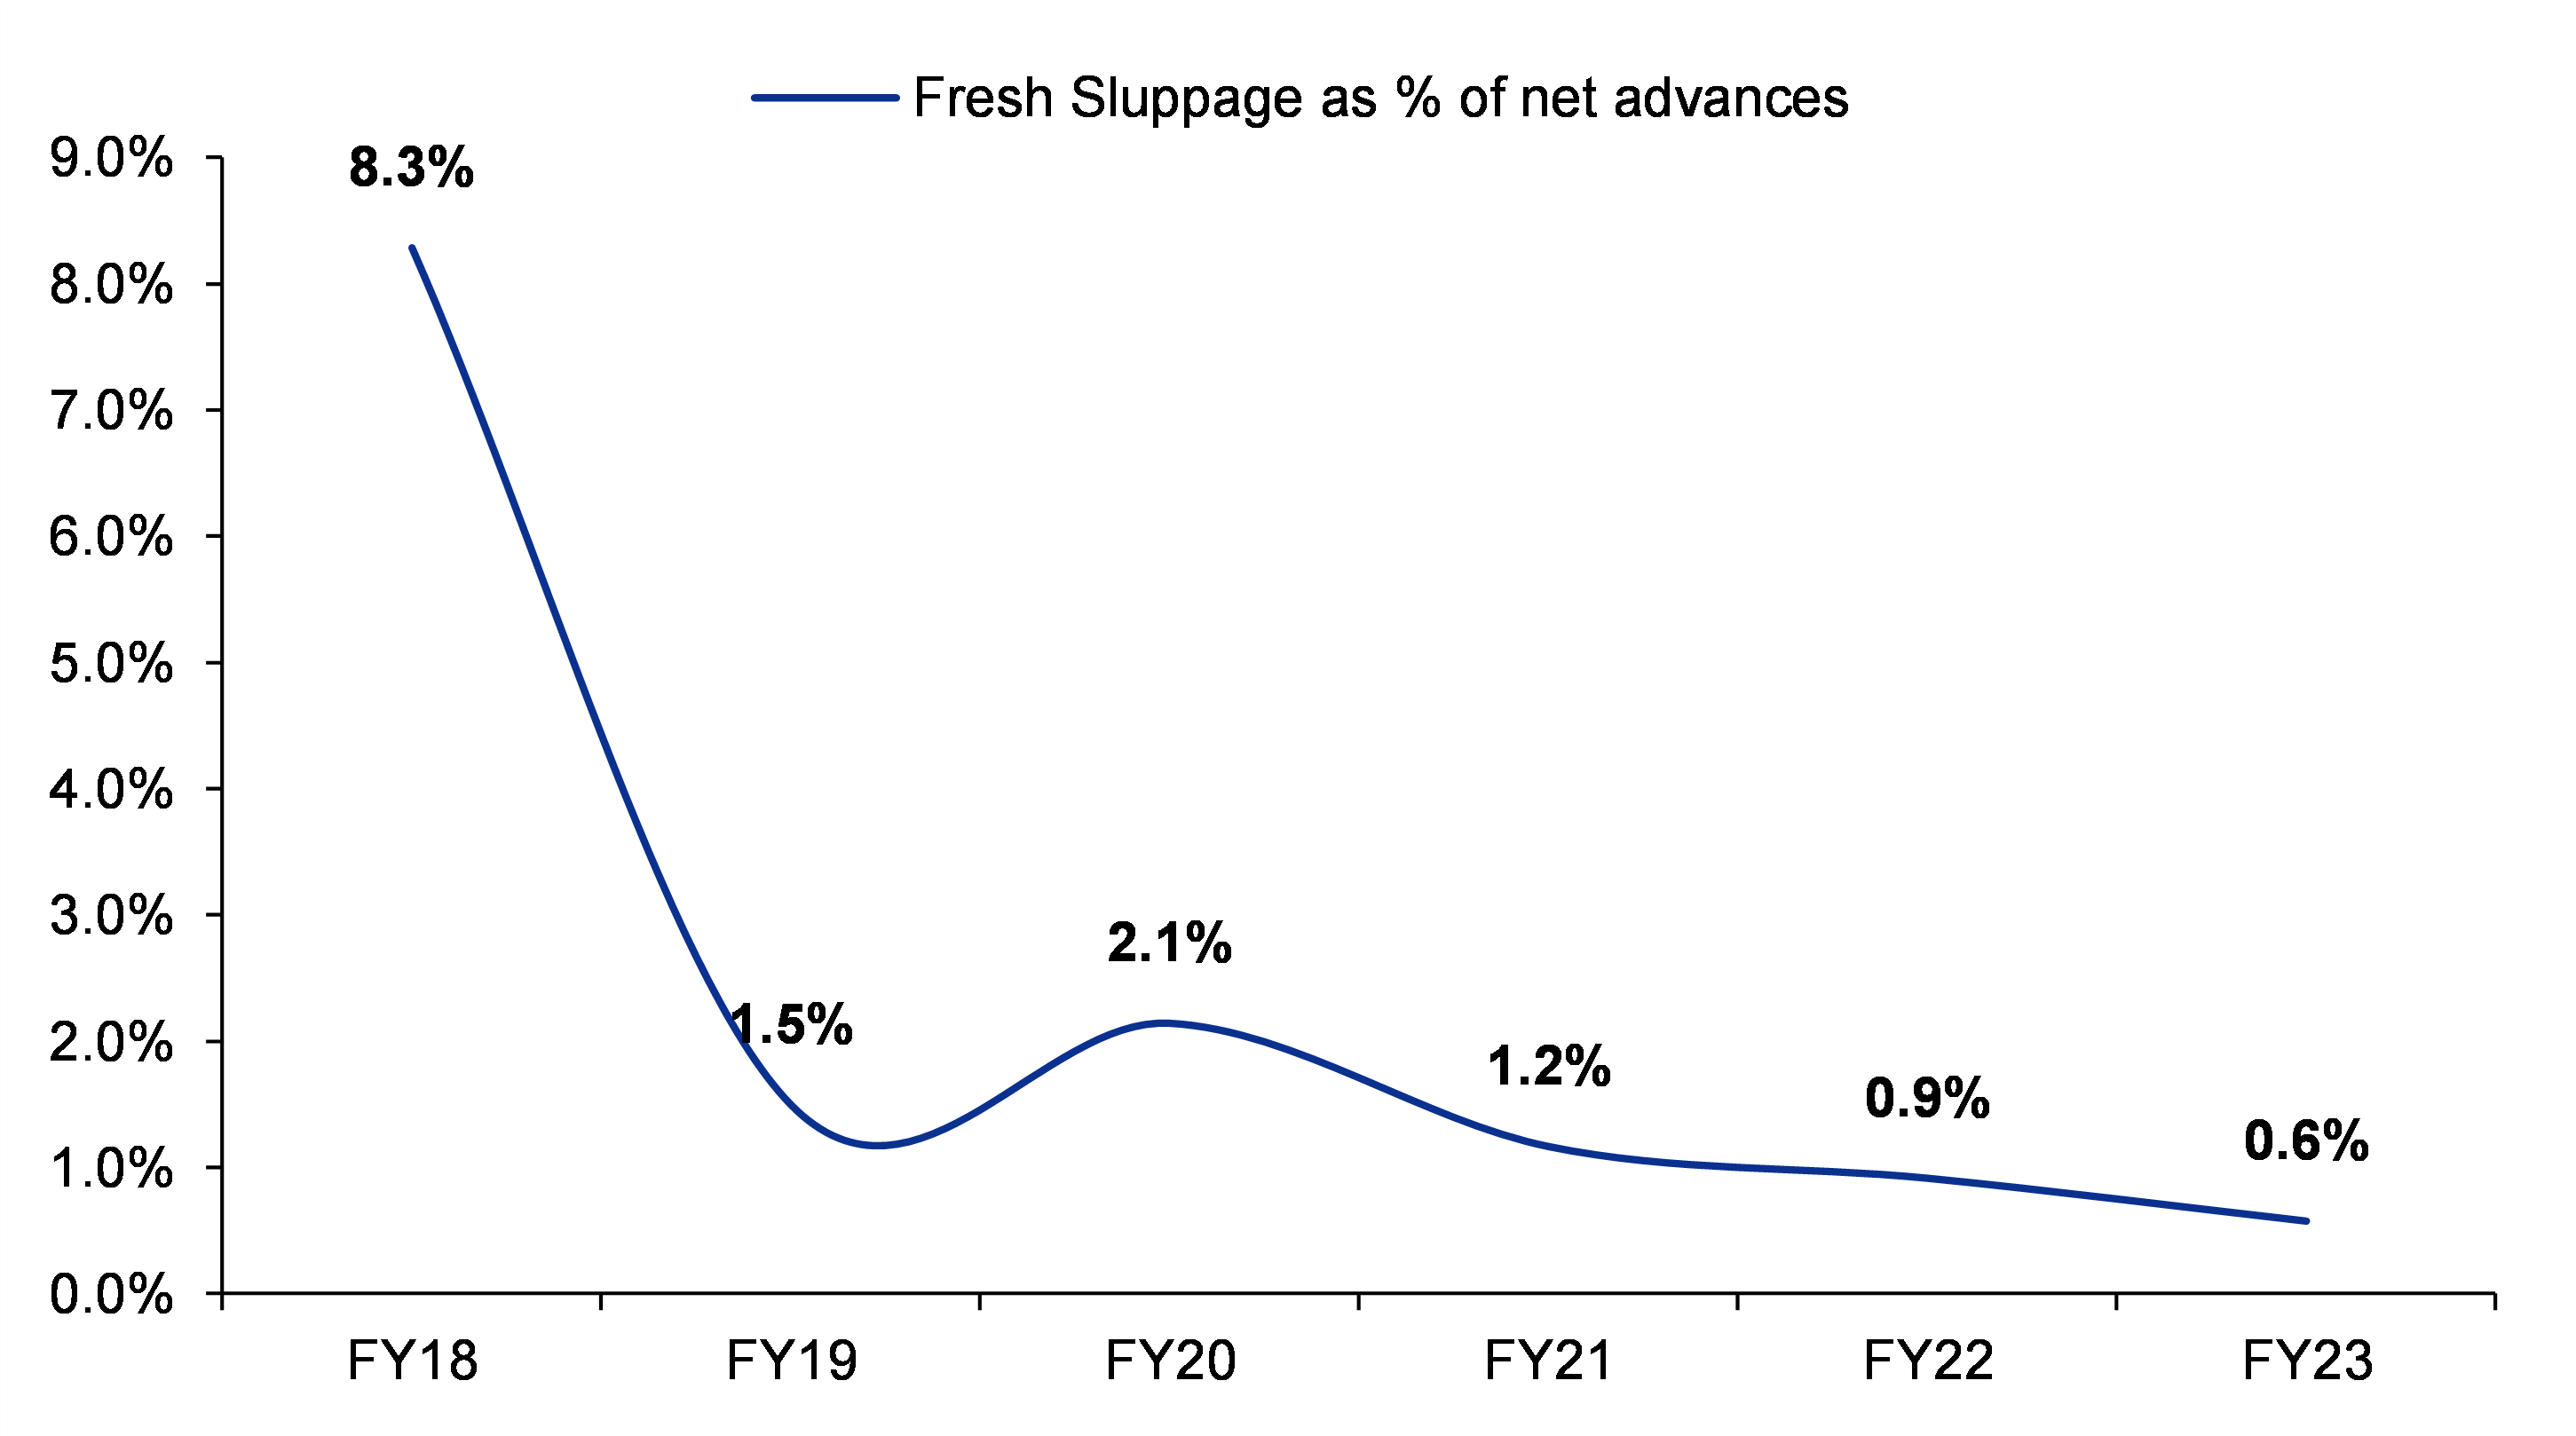
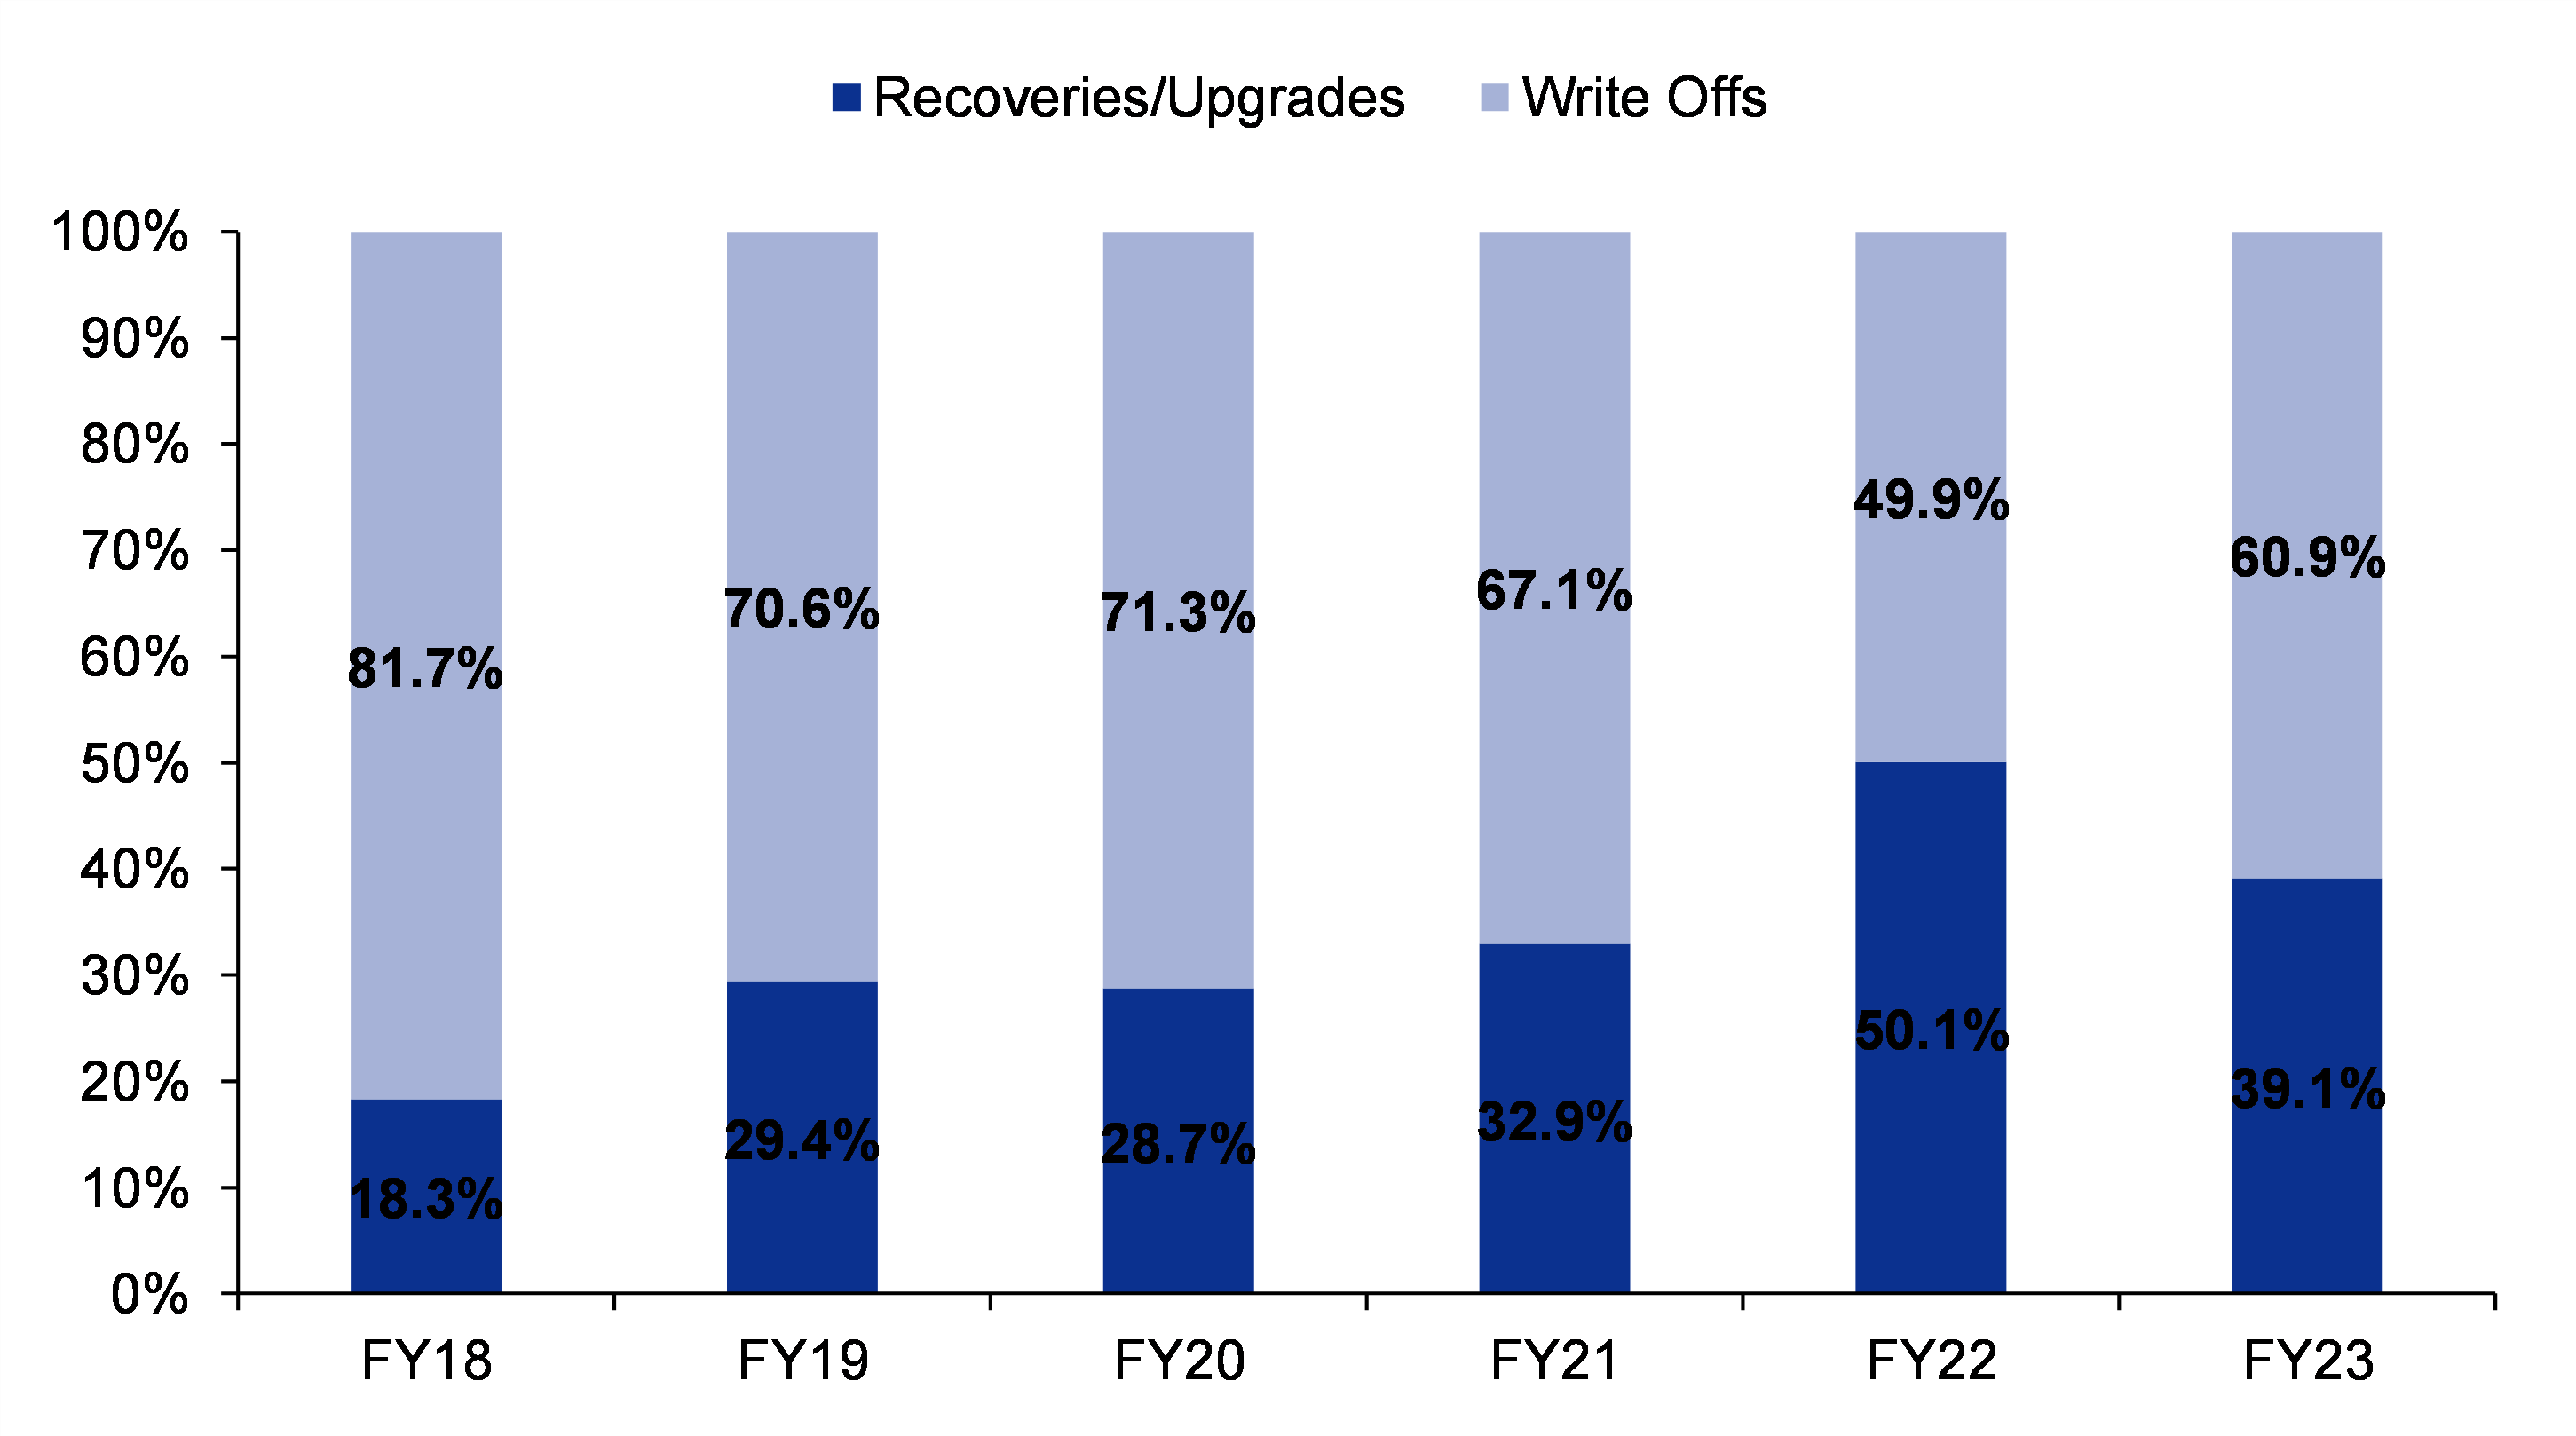
Fresh slippage ratio was the lowest in the past several years at ~0.6% of net advances, but write-offs accounted for ~61% of GNPA reduction in FY23.

*Source: Bloomberg

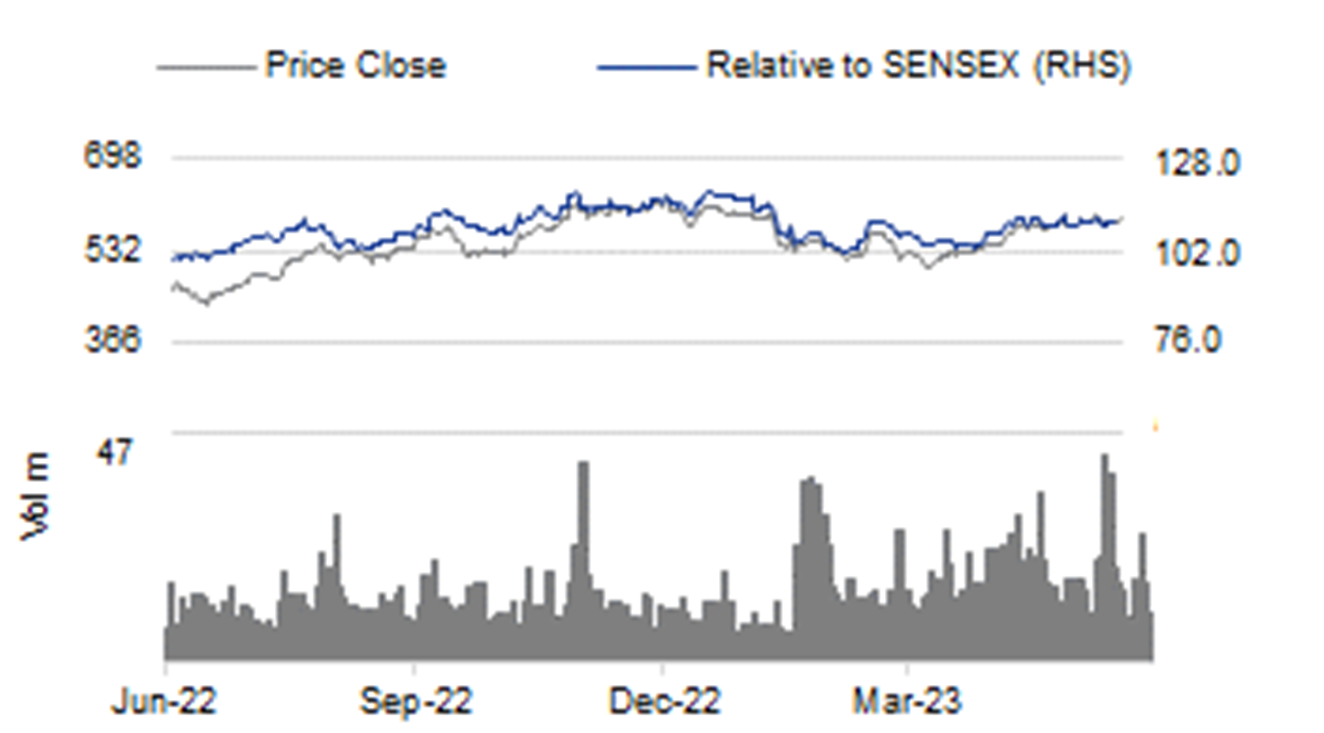
Price performance
1M 3M 12M
Absolute (%) 2.2 4.9 27.1
Relative (%) 0.0 0.3 10.5
Major shareholders
% held
Central Government 57.6
LIC 8.3
0.0
Analyst(s)

Jignesh SHIAL

T (91) 22 4161 1547
E jignesh.shial@incredcapital.com

Mayank AGARWAL

T (91) 22 4161 0000
E mayank.agarwal@incredcapital.com

2022-23 Annual Report: Key observations

The 2022-23 Annual Report clearly articulates SBI’s intention of growing unsecured retail business, but the rising share of PSU lending gives comfort.

Sluggish deposit growth due to a healthy treasury portfolio but with Indian G-Secs’ share at ~29.2% of deposits, margin surprise is likely in coming quarters.

Fresh slippage was the lowest in the past several years at ~0.6% of net advances but keep a close eye on higher write-offs (~61% of GNPA reduction).

Unsecured retail dominates advances, rise in PSU share comforting

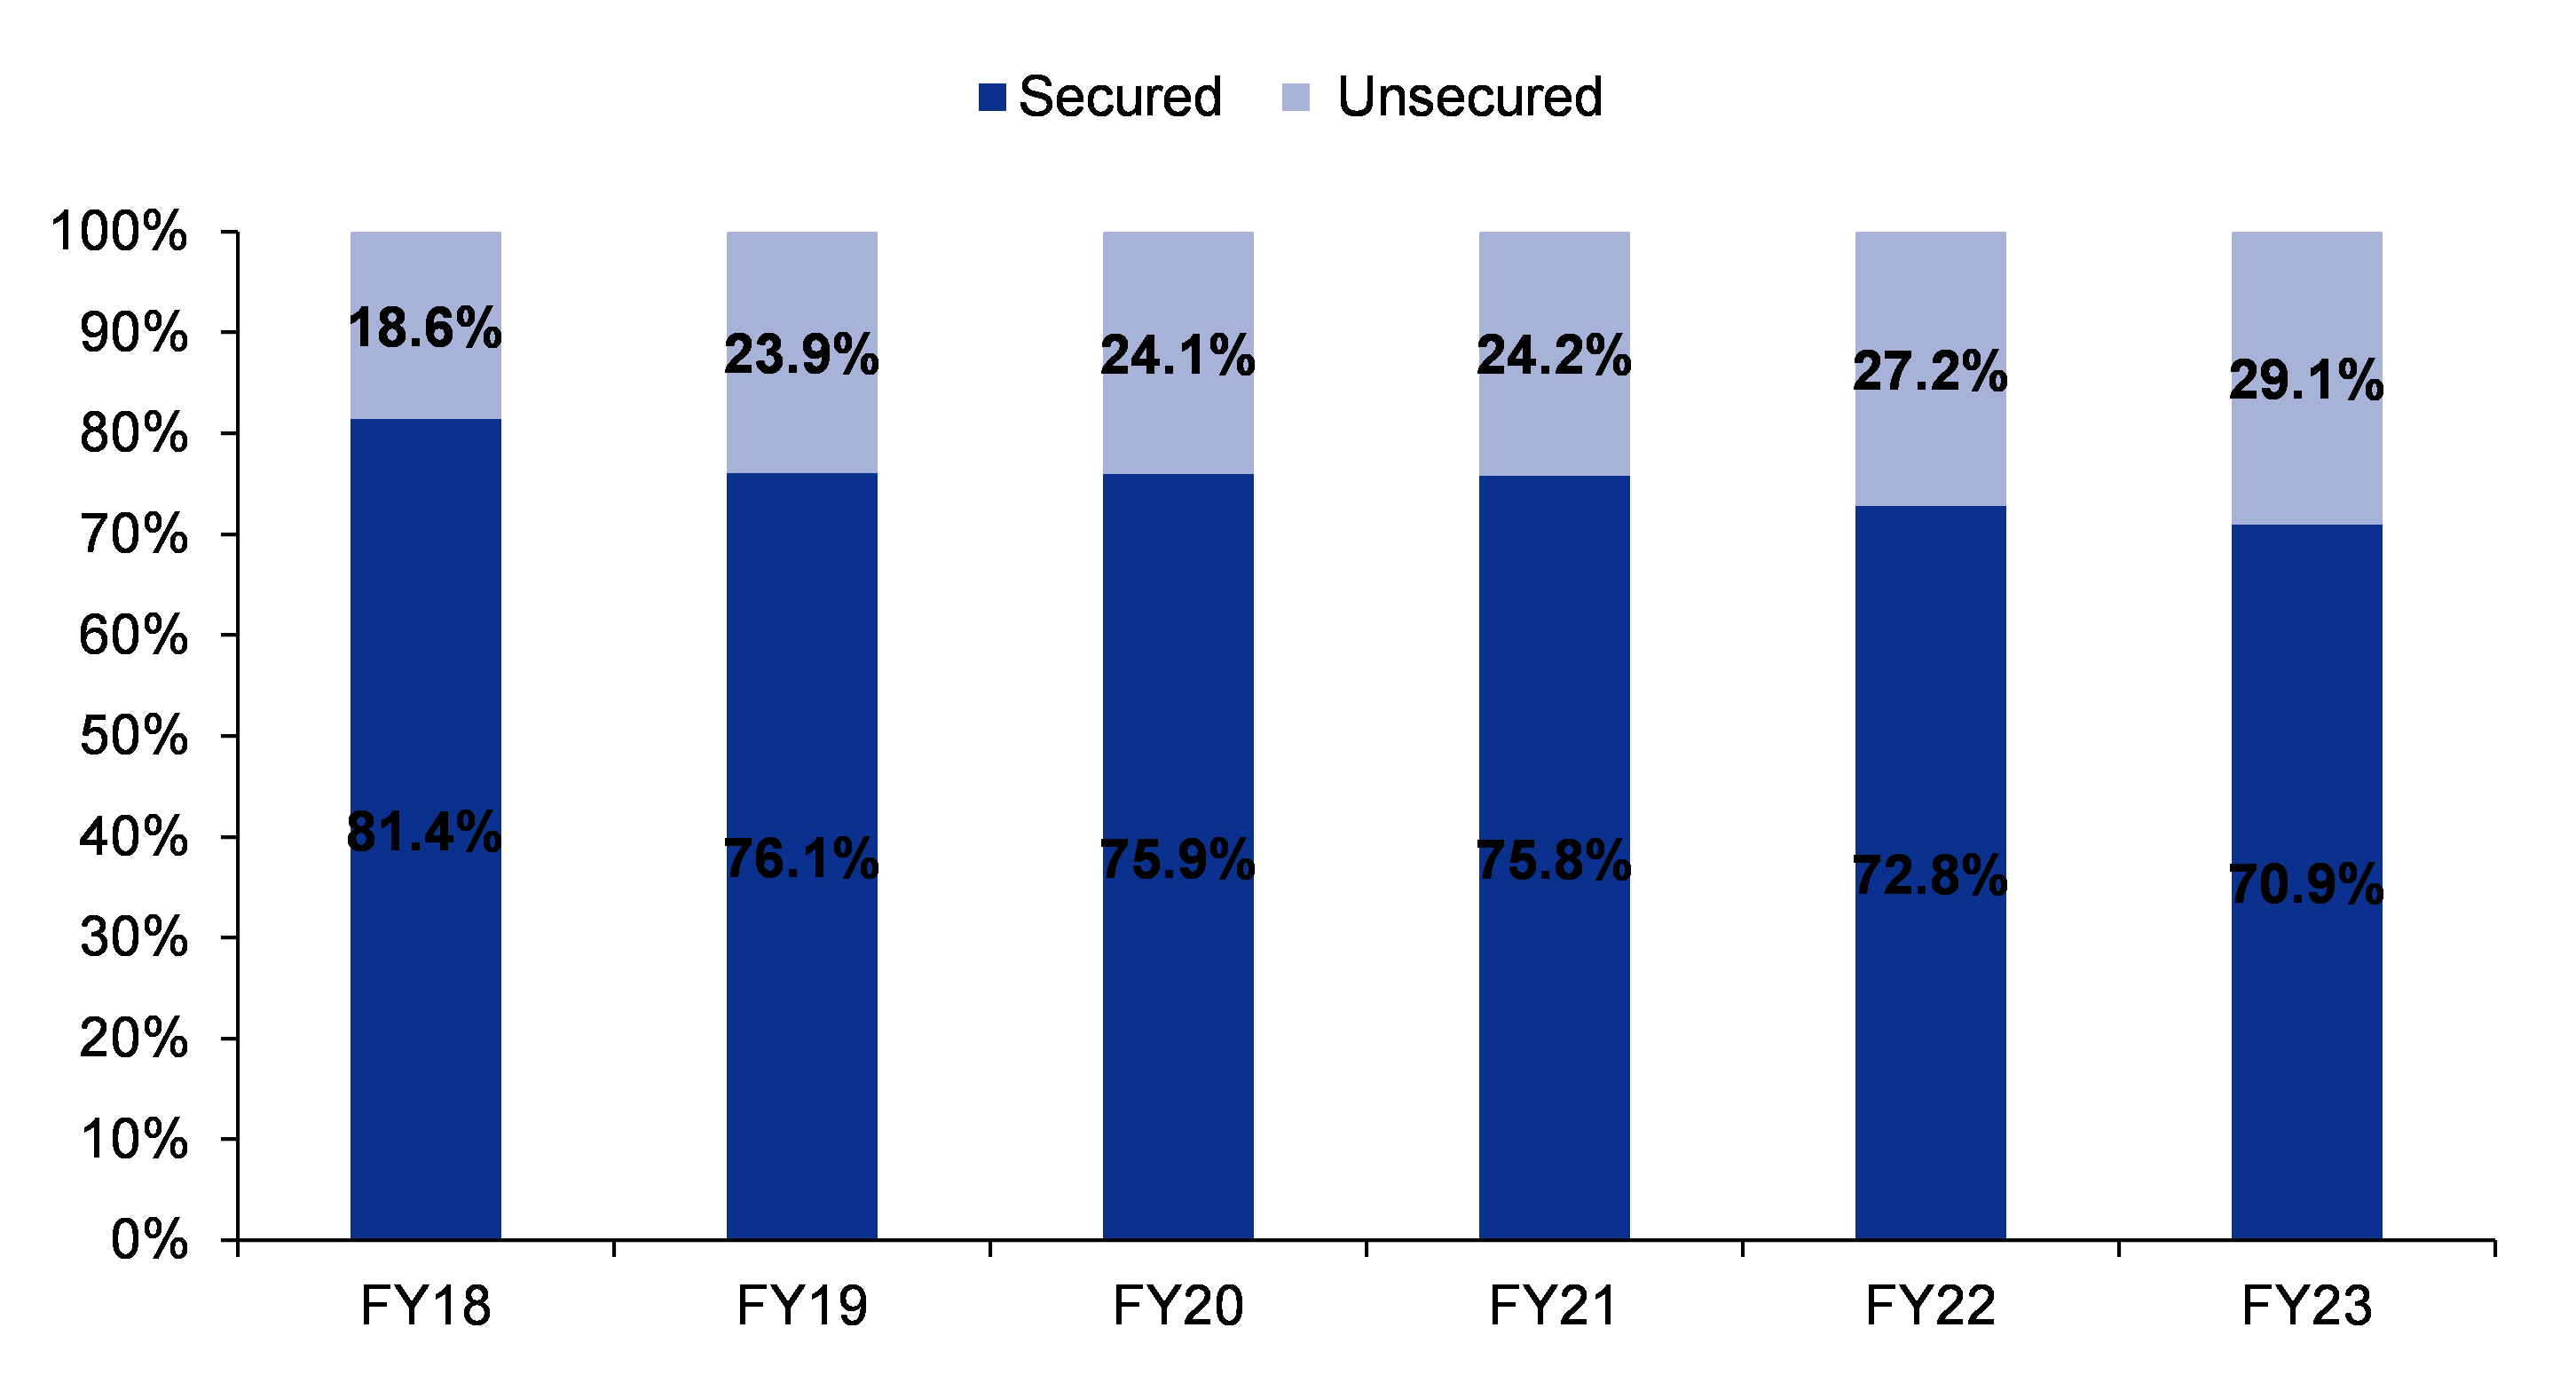
State Bank of India or SBI witnessed a consistent rise in its unsecured retail loans, at ~29.1% of net advances against ~27.2% last year. To boost personal loan business further, SBI made several modifications to its personal loan products which include time-bound concession in the interest rate and waiver of prepayment/foreclosure charges. Interestingly, a significant rise in the share of public sector undertaking or PSU (+54.8% yoy, share rising to ~8.1% against ~6.1% last year) does provide comfort. On the contrary, priority sector lending witnessed sluggish growth of ~5.9% yoy with its overall share in domestic advances declining to ~21.8% against ~24.1% last year. Advances outside India witnessed a decent growth of ~19.6% yoy, led by bill purchases and syndicated loans.

Deposit growth remains sluggish; elevated G-secs to aid margins

SBI’s overall deposit growth has been sluggish for the past two years with a dip in CASA share. Borrowing in India remains well diversified, but its growth remained volatile. SBI has relied heavily on innovative perpetual debentures (IPD), which grew at ~28.4% CAGR over FY20-23. The investment book of SBI has remained flat (+6% yoy), with government securities (G- secs) continuing to dominate its overall portfolio. Indian G-secs, as a percentage of its of total deposits, remained comfortable at ~29.2%, flat compared to last year. SBI has invested significantly in foreign government securities as well, up by ~52.4% yoy, but the absolute quantum remains insignificant.

Fresh slippage at a historical low but write-offs dominate recoveries

The fresh slippage ratio of SBI was the lowest in the past several years at ~0.6% of net advances, but recoveries and upgrades also remained muted on a yoy basis. Write-offs continue to be a key contributor to NPA reduction, with ~61% share in overall gross non-performing asset or GNPA reduction during the year. On the provisioning front, NPA provisioning remained low at ~30bp of net advances whereas standard asset provisioning was at ~20bp of net advances.

Best among equals; maintain ADD rating on the stock

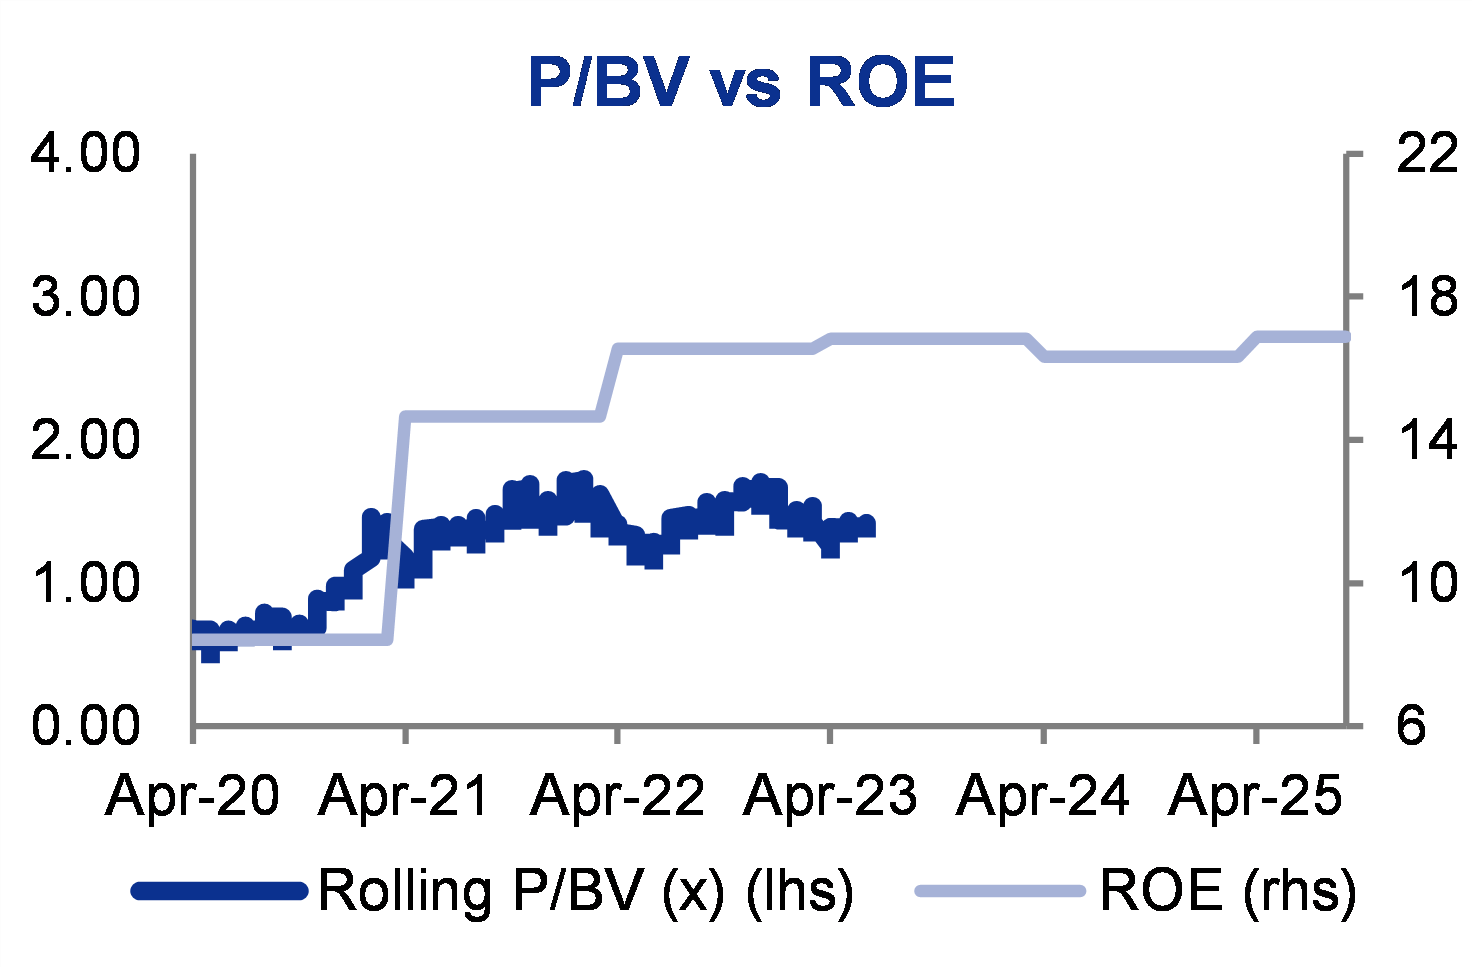
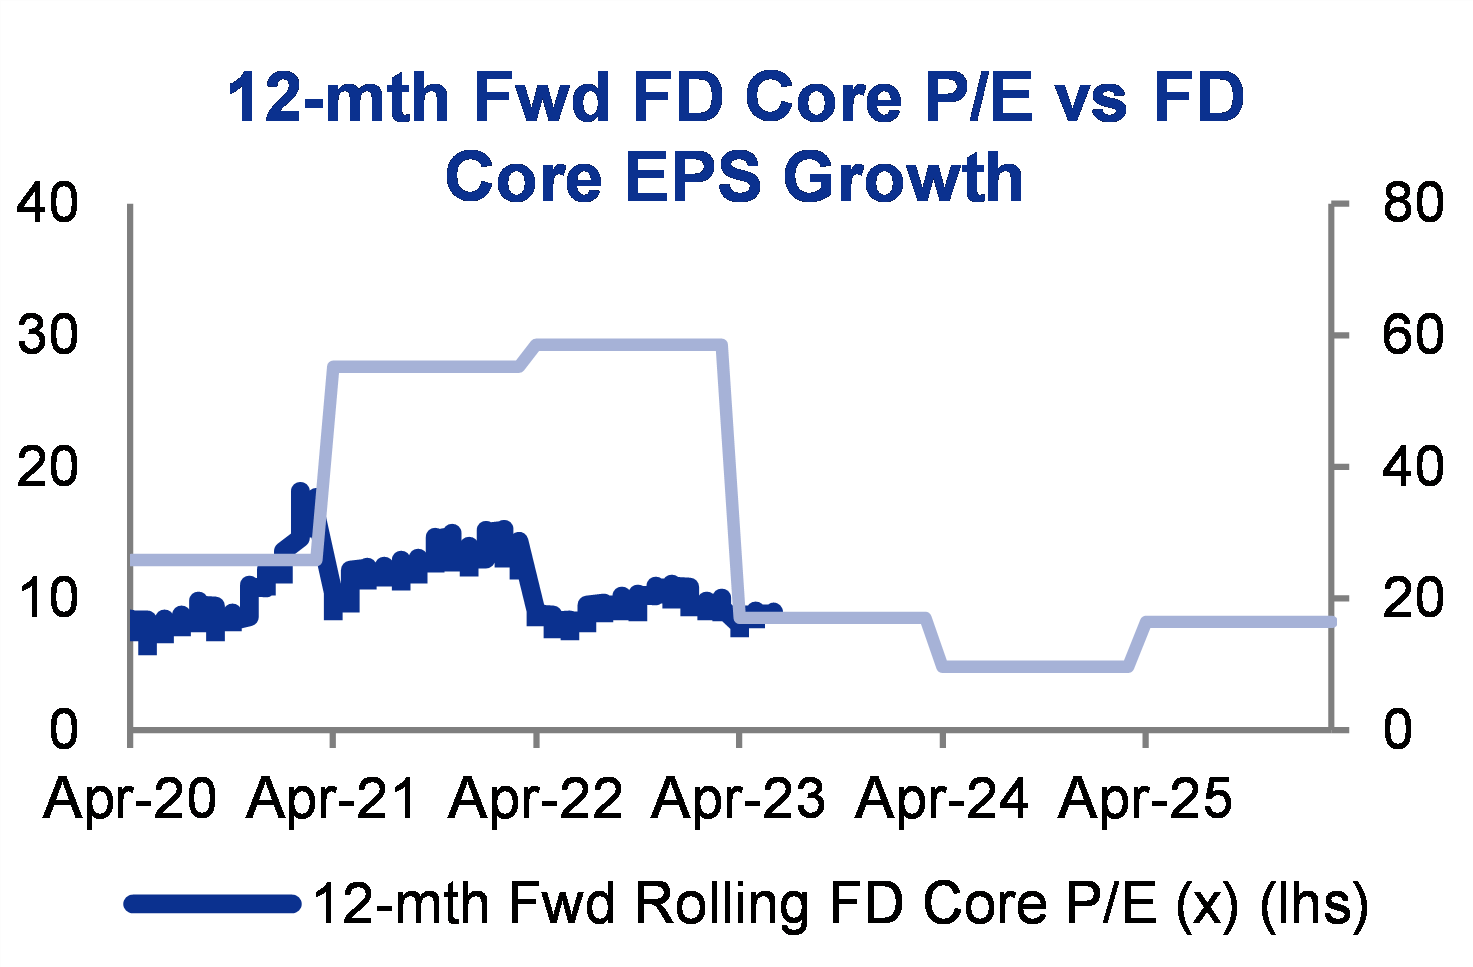
We have valued SBI on a sum-of the parts (SOTP) basis with the standalone bank valued at ~1.3x FY25F ABV and subsidiaries’ contribution at Rs200/share. Accordingly, we have arrived at a target price of Rs800 or ~1.8x FY25F P/ABV with RoA of ~1% and RoE of ~17% for FY24F. Retain ADD rating. Downside risks: Weak growth and a surge in NPAs.

Financial Summary
Mar-22A Mar-23A Mar-24F Mar-25F Mar-26F
Net Interest Income (Rsm) 1,207,076 1,448,405 1,611,746 1,811,350 2,065,158
Total Non-Interest Income (Rsm) 405,639 366,156 426,372 480,451 542,146
Operating Revenue (Rsm) 1,612,715 1,814,561 2,038,118 2,291,801 2,607,305
Total Provision Charges (Rsm) (244,521) (165,073) (187,624) (242,436) (266,043)
Net Profit (Rsm) 316,760 502,325 588,084 644,288 750,336
Core EPS (Rs) 35.49 56.29 65.89 72.19 84.07
Core EPS Growth 82% 35% 17% 10% 16%
FD Core P/E (x) 16.60 10.47 8.94 8.16 7.01
DPS (Rs) 7.10 11.30 16.48 19.86 25.23
Dividend Yield 1.21% 1.92% 2.80% 3.37% 4.28%
BVPS (Rs) 313.8 367.1 416.5 468.8 527.7
P/BV (x) 1.88 1.61 1.41 1.26 1.12
ROE 14.6% 16.5% 16.8% 16.3% 16.9%
% Change In Core EPS Estimates
InCred Research/Consensus EPS (x)
INCRED RESEARCH, COMPANY REPORTS, PRICED AS AT January 01, 0001

2022-23 Annual Report: Key observations

Liabilities

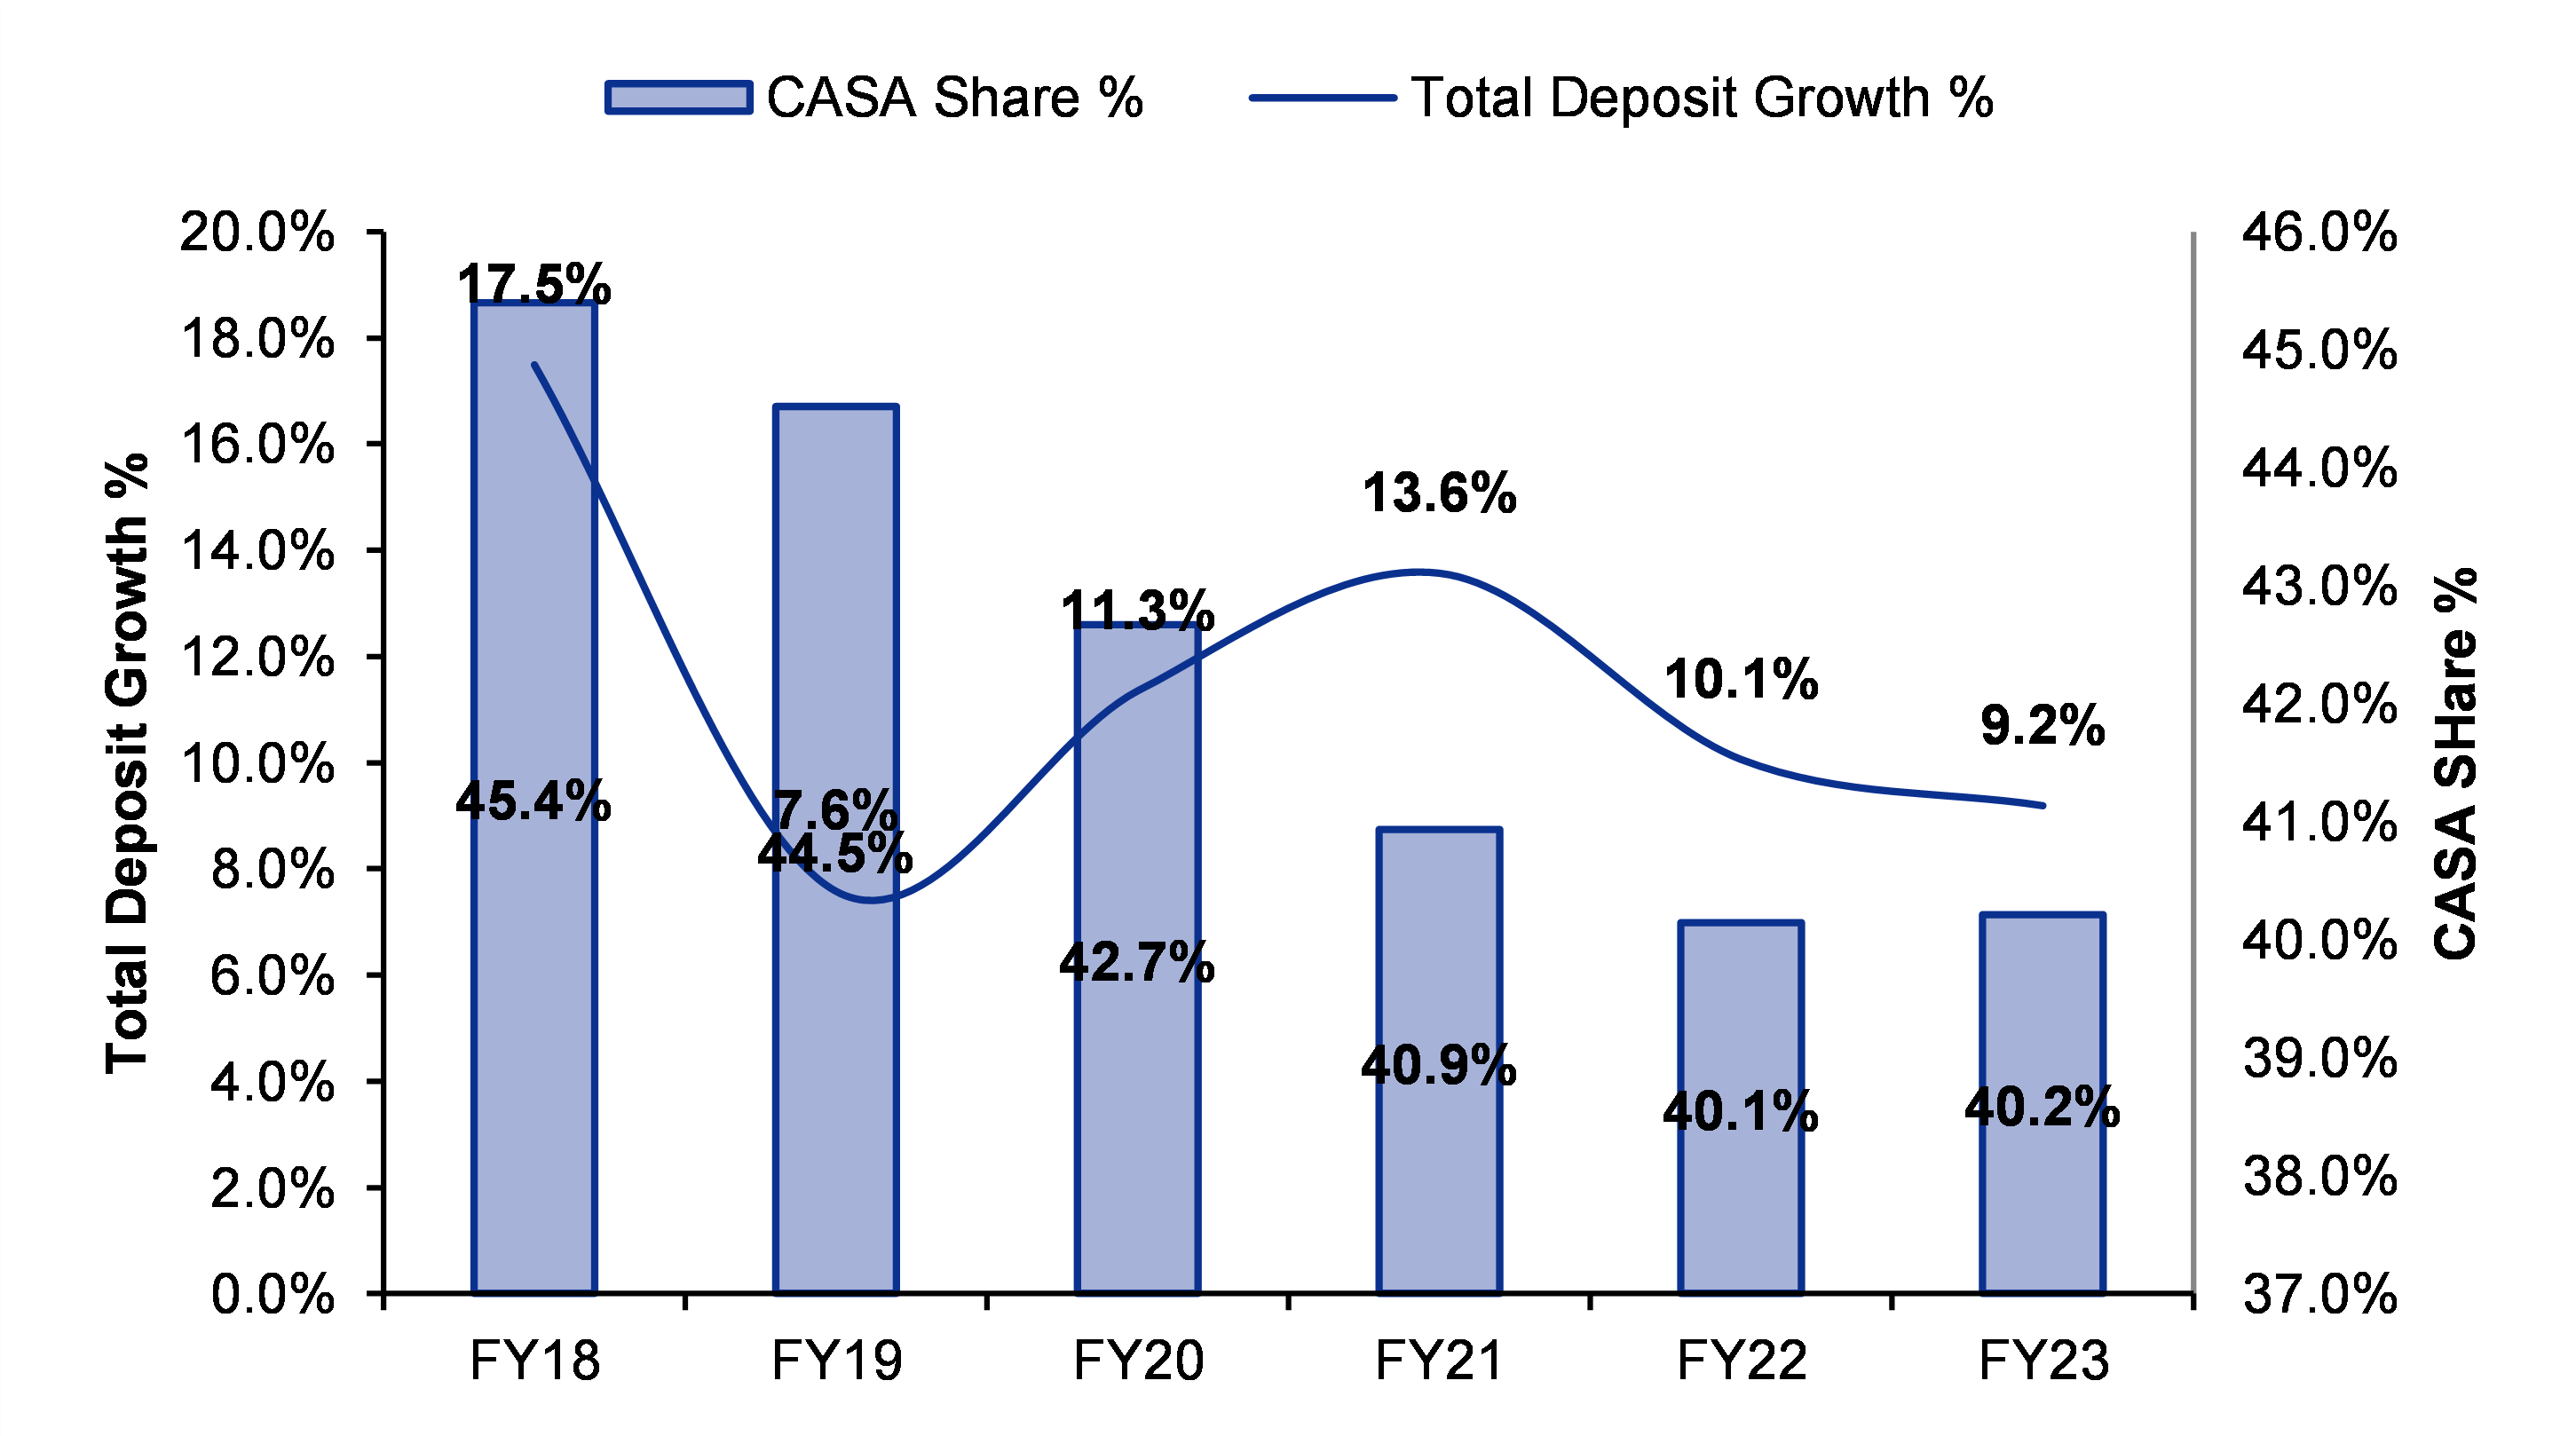
   Overall deposit growth has been easing for the past two years, with a fall in overall CASA share. The trend in term deposits remained steady, with the growth trajectory staying in the early teens.

Figure 1: Sluggish growth in deposits with a decline in CASA share
SOURCE: INCRED RESEARCH, COMPANY REPORTS

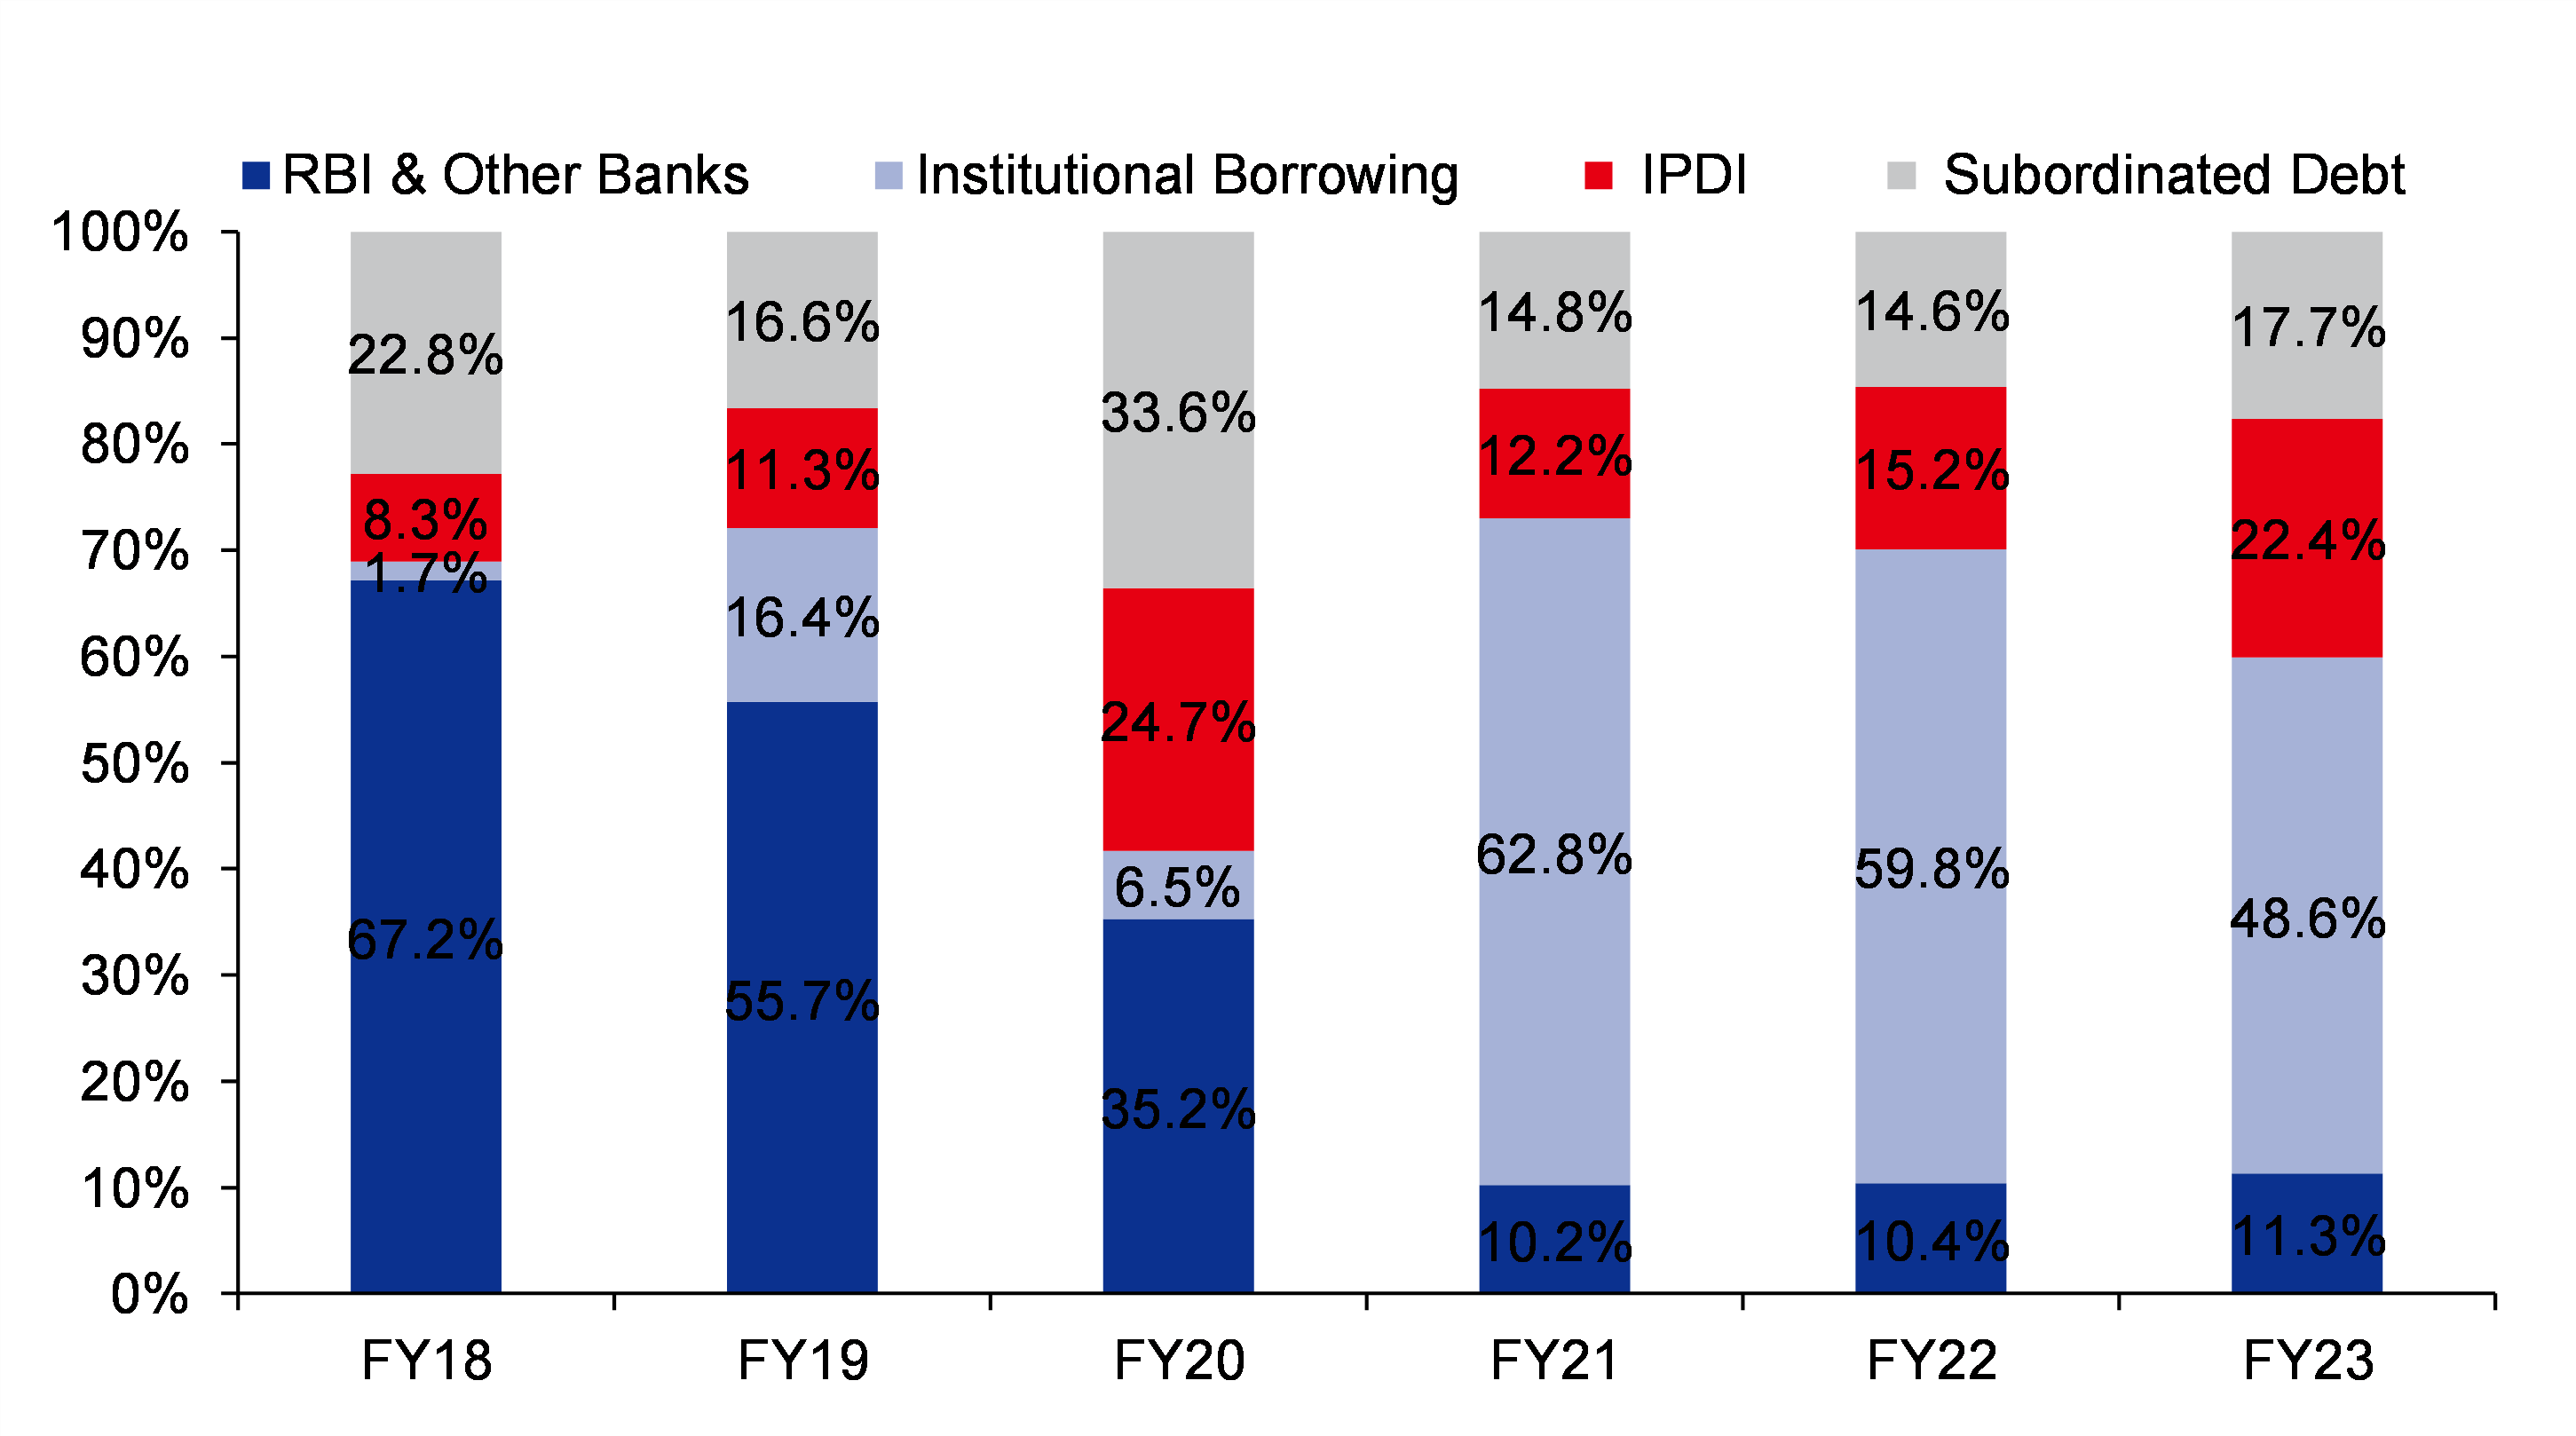
   Borrowing in India remained well diversified, but its growth remained volatile. Interestingly, SBI relied heavily on innovative perpetual debentures (IPD), which grew at ~28.4% CAGR over FY20-23.

Figure 2: Borrowing in India remains well diversified
SOURCES: INCRED RESEARCH, COMPANY REPORTS

Investments

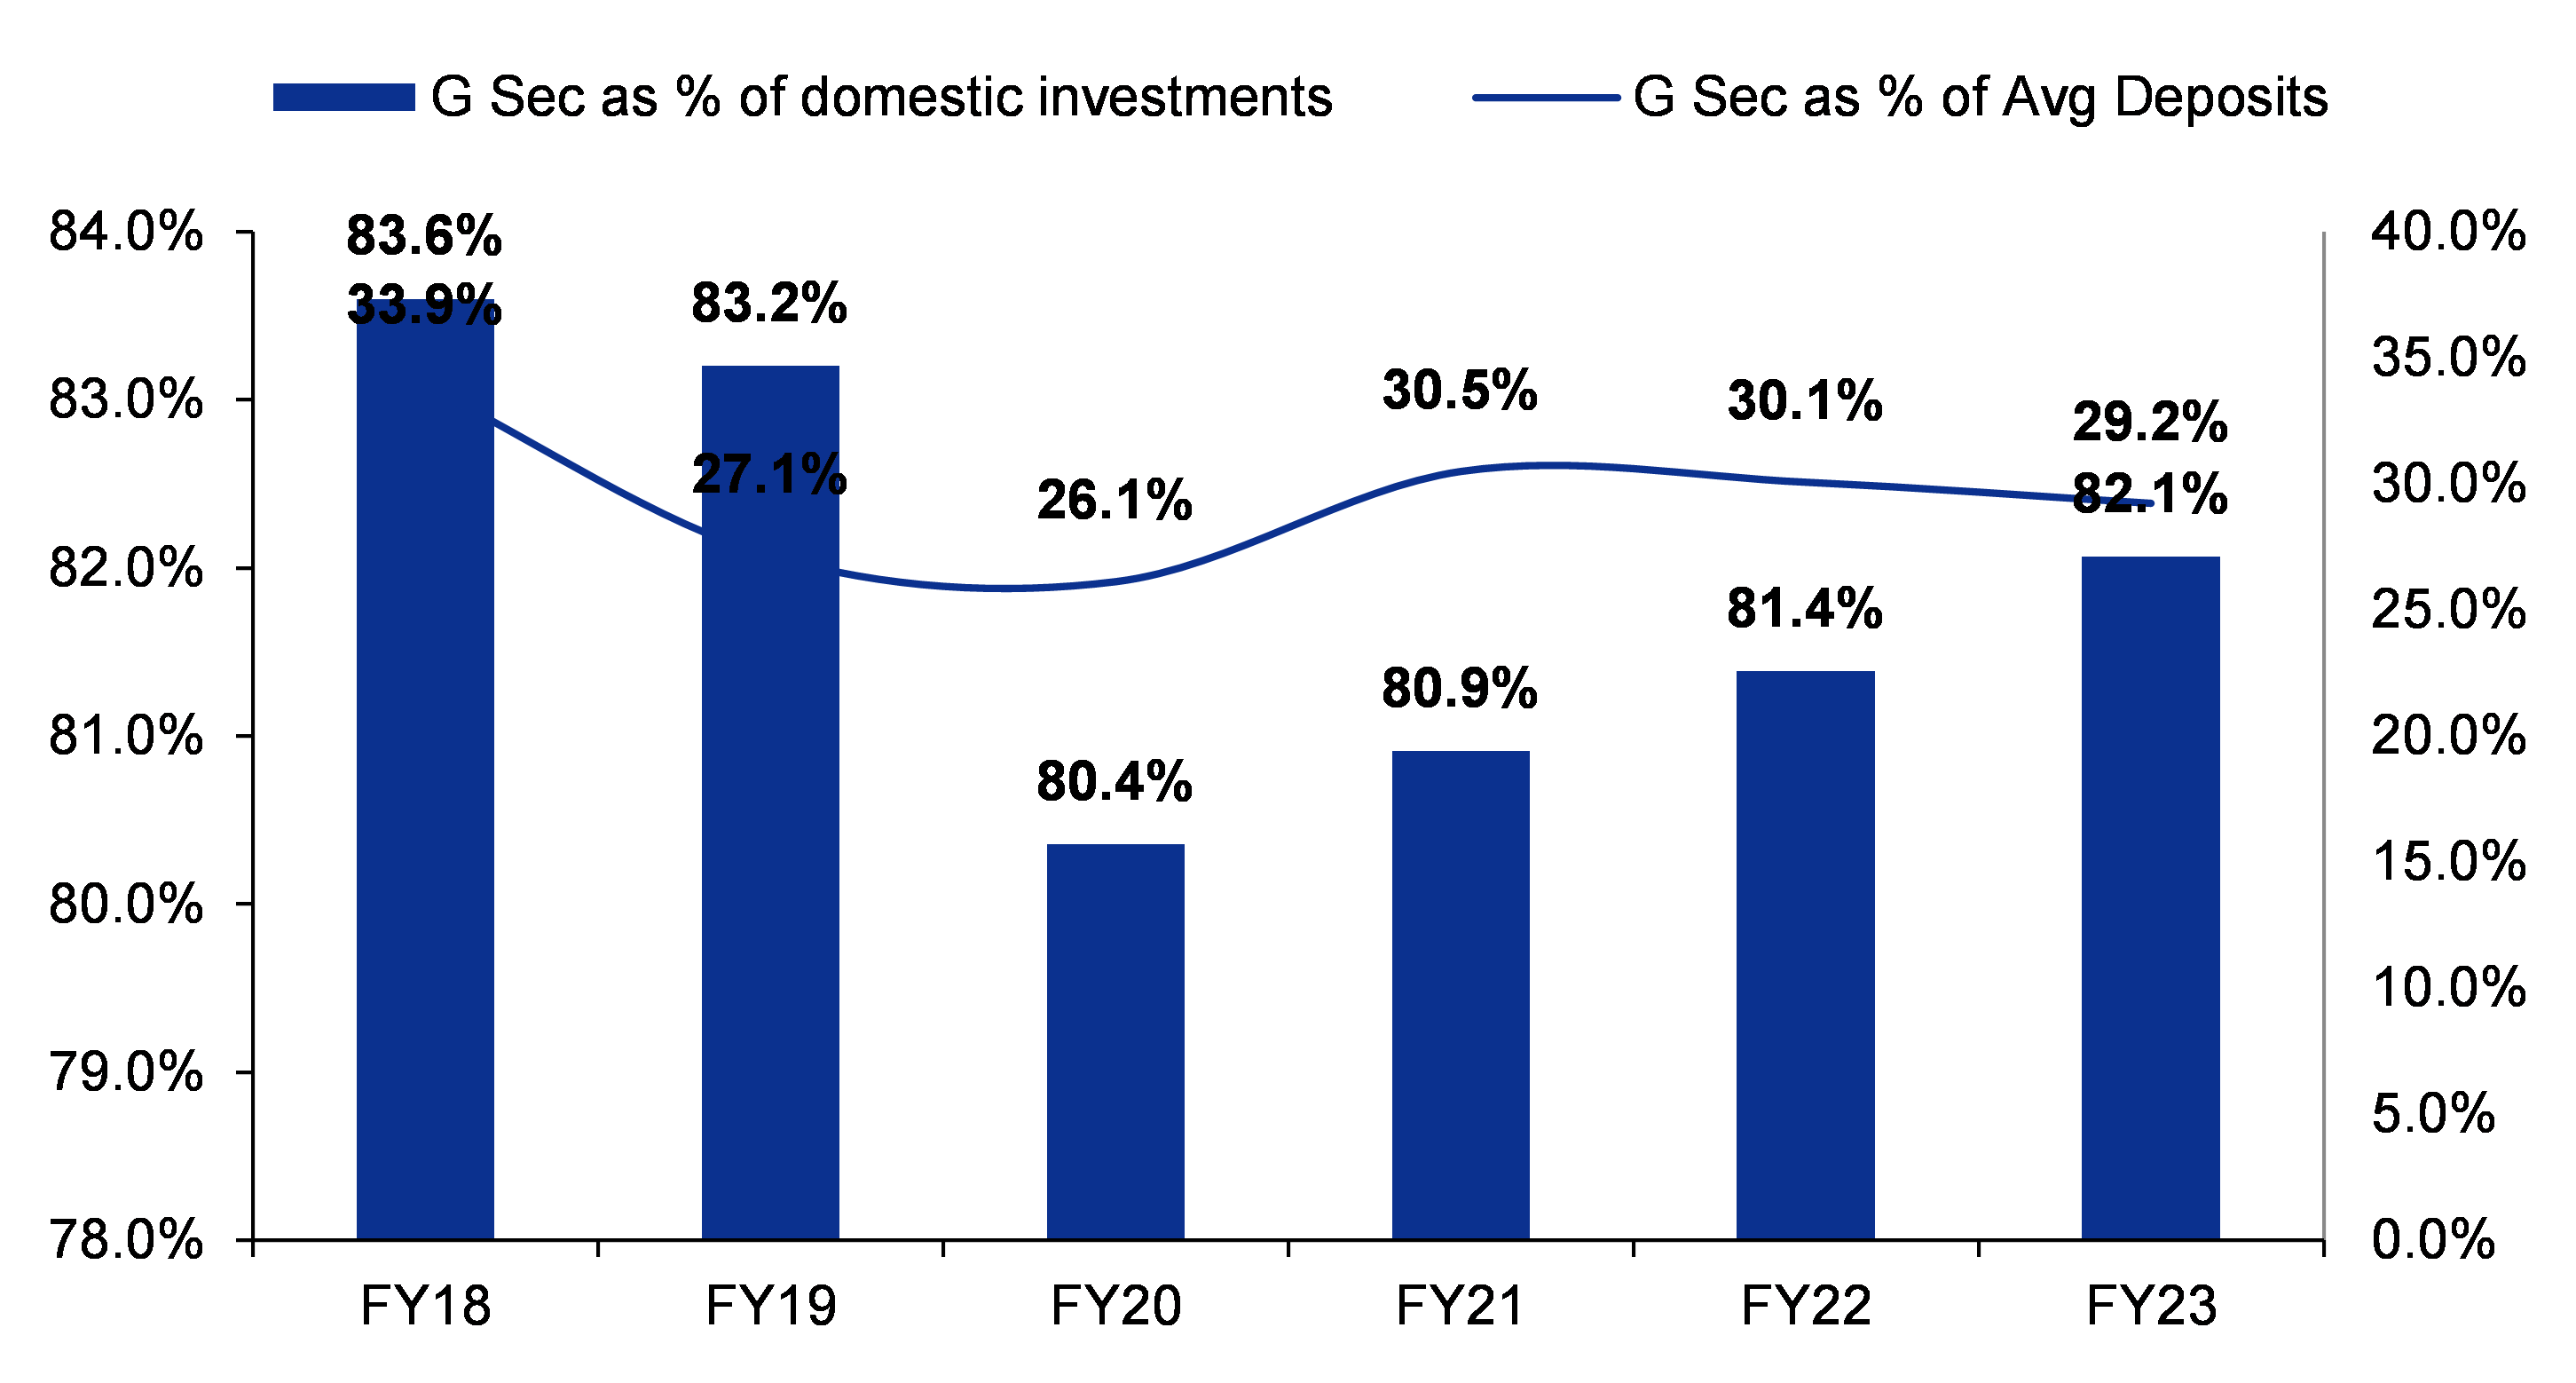
   The investment book of SBI remained flat (+6% yoy), with government securities (G-secs) continuing to dominate the overall portfolio.

   Indian G-secs, as a percentage of total deposits, remained comfortable at ~29.2%, flat compared to last year.

   In the domestic investment portfolio, ~62.9% is in the HTM category while the rest is under AFS & HFT categories.

   SBI invested significantly in foreign government securities as well, up by ~52.4% yoy, but the absolute quantum remains insignificant compared to its total investment portfolio.

Figure 3: SBI continues to hold a large portion of G-secs
SOURCE: INCRED RESEARCH, COMPANY REPORTS

Fixed assets

   The most interesting observation from the fixed-asset schedule was the revaluation reserves created by SBI during the year.

   SBI created gross revaluation reserves of Rs64.1bn during the year against its premises. Adjusting for depreciation, net revaluation reserves created by the bank stood at Rs45.8bn, which was added to reserves & surplus.

   Net revaluation reserves created stood at ~1.4% of the total net worth of SBI whereas overall revaluation reserves form ~8.5% of its total net worth.

Advances

   SBI witnessed a significant rise in the share of PSU sector lending, which grew by ~54.8% yoy whereas the share of PSUs in its lending increased to ~8.1% from ~6.1% last year.

   On the contrary, priority sector lending witnessed a sluggish growth of ~5.9% yoy, with its overall share in domestic advances declining to ~21.8% against ~24.1% last year.

   SBI also witnessed a consistent rise in unsecured loans at ~29.1% of net advances against ~27.2% last year. 

Figure 4: The share of unsecured loans witnessed a significant rise in recent years
SOURCE: INCRED RESEARCH, COMPANY REPORTS

   Advances outside India witnessed a decent growth of ~19.6% yoy, led by bill purchases and syndicated loans. The share of overseas loans increased to ~15.3% against ~15% last year.

   Retail and SME segments continue to remain the key focus areas of the bank, but the share of corporate loans continues to remain at ~30% of overall advances.  

   As of end-Mar 2023, SBI’s market share in home loans and automobile loans stood at 33.1% and 19.4%, respectively.

   To boost personal loans further, SBI made several modifications to its personal loan products, which include time-bound concession in the interest rate and waiver of prepayment/foreclosure charges.

Asset quality and provisions

   The fresh slippage ratio of SBI was the lowest in the past several years at ~0.6% of net advances, but recoveries and upgrades also remained muted on a yoy basis.

Figure 5: SBI reported the best-in-class slippage ratio in FY23
SOURCE: INCRED RESEARCH, COMPANY REPORTS

   Write-offs continue to remain a key contributor to NPA reduction, with ~61% share in overall GNPA reduction during the year.

Figure 6: Write-offs continue to remain a key contributor to GNPA reduction
SOURCE: INCRED RESEARCH, COMPANY REPORTS

   On the provisioning front, NPA provision remained low at ~30bp of net advances whereas standard asset provision was flat on a yoy basis at ~20bp of net advances.

Yields, cost of funds and margins

   Calculated yield on advances of SBI witnessed a rise of ~90bp during the year whereas the cost of deposits grew by ~20bp yoy and the cost of funds increased by ~30bp yoy, resulting in a sharp surge in calculated margins to ~322bp against ~301bp last year.

Other income & expenses

   SBI continues to report sluggish commission and fee-based income, which grew by ~6.8% yoy to Rs262.4bn, but treasury income continued to perform well for the bank.

   On the operating expenses front, SBI witnessed flat employee expenses yoy, but the same is also attributed to pension liabilities charged by the bank last year.

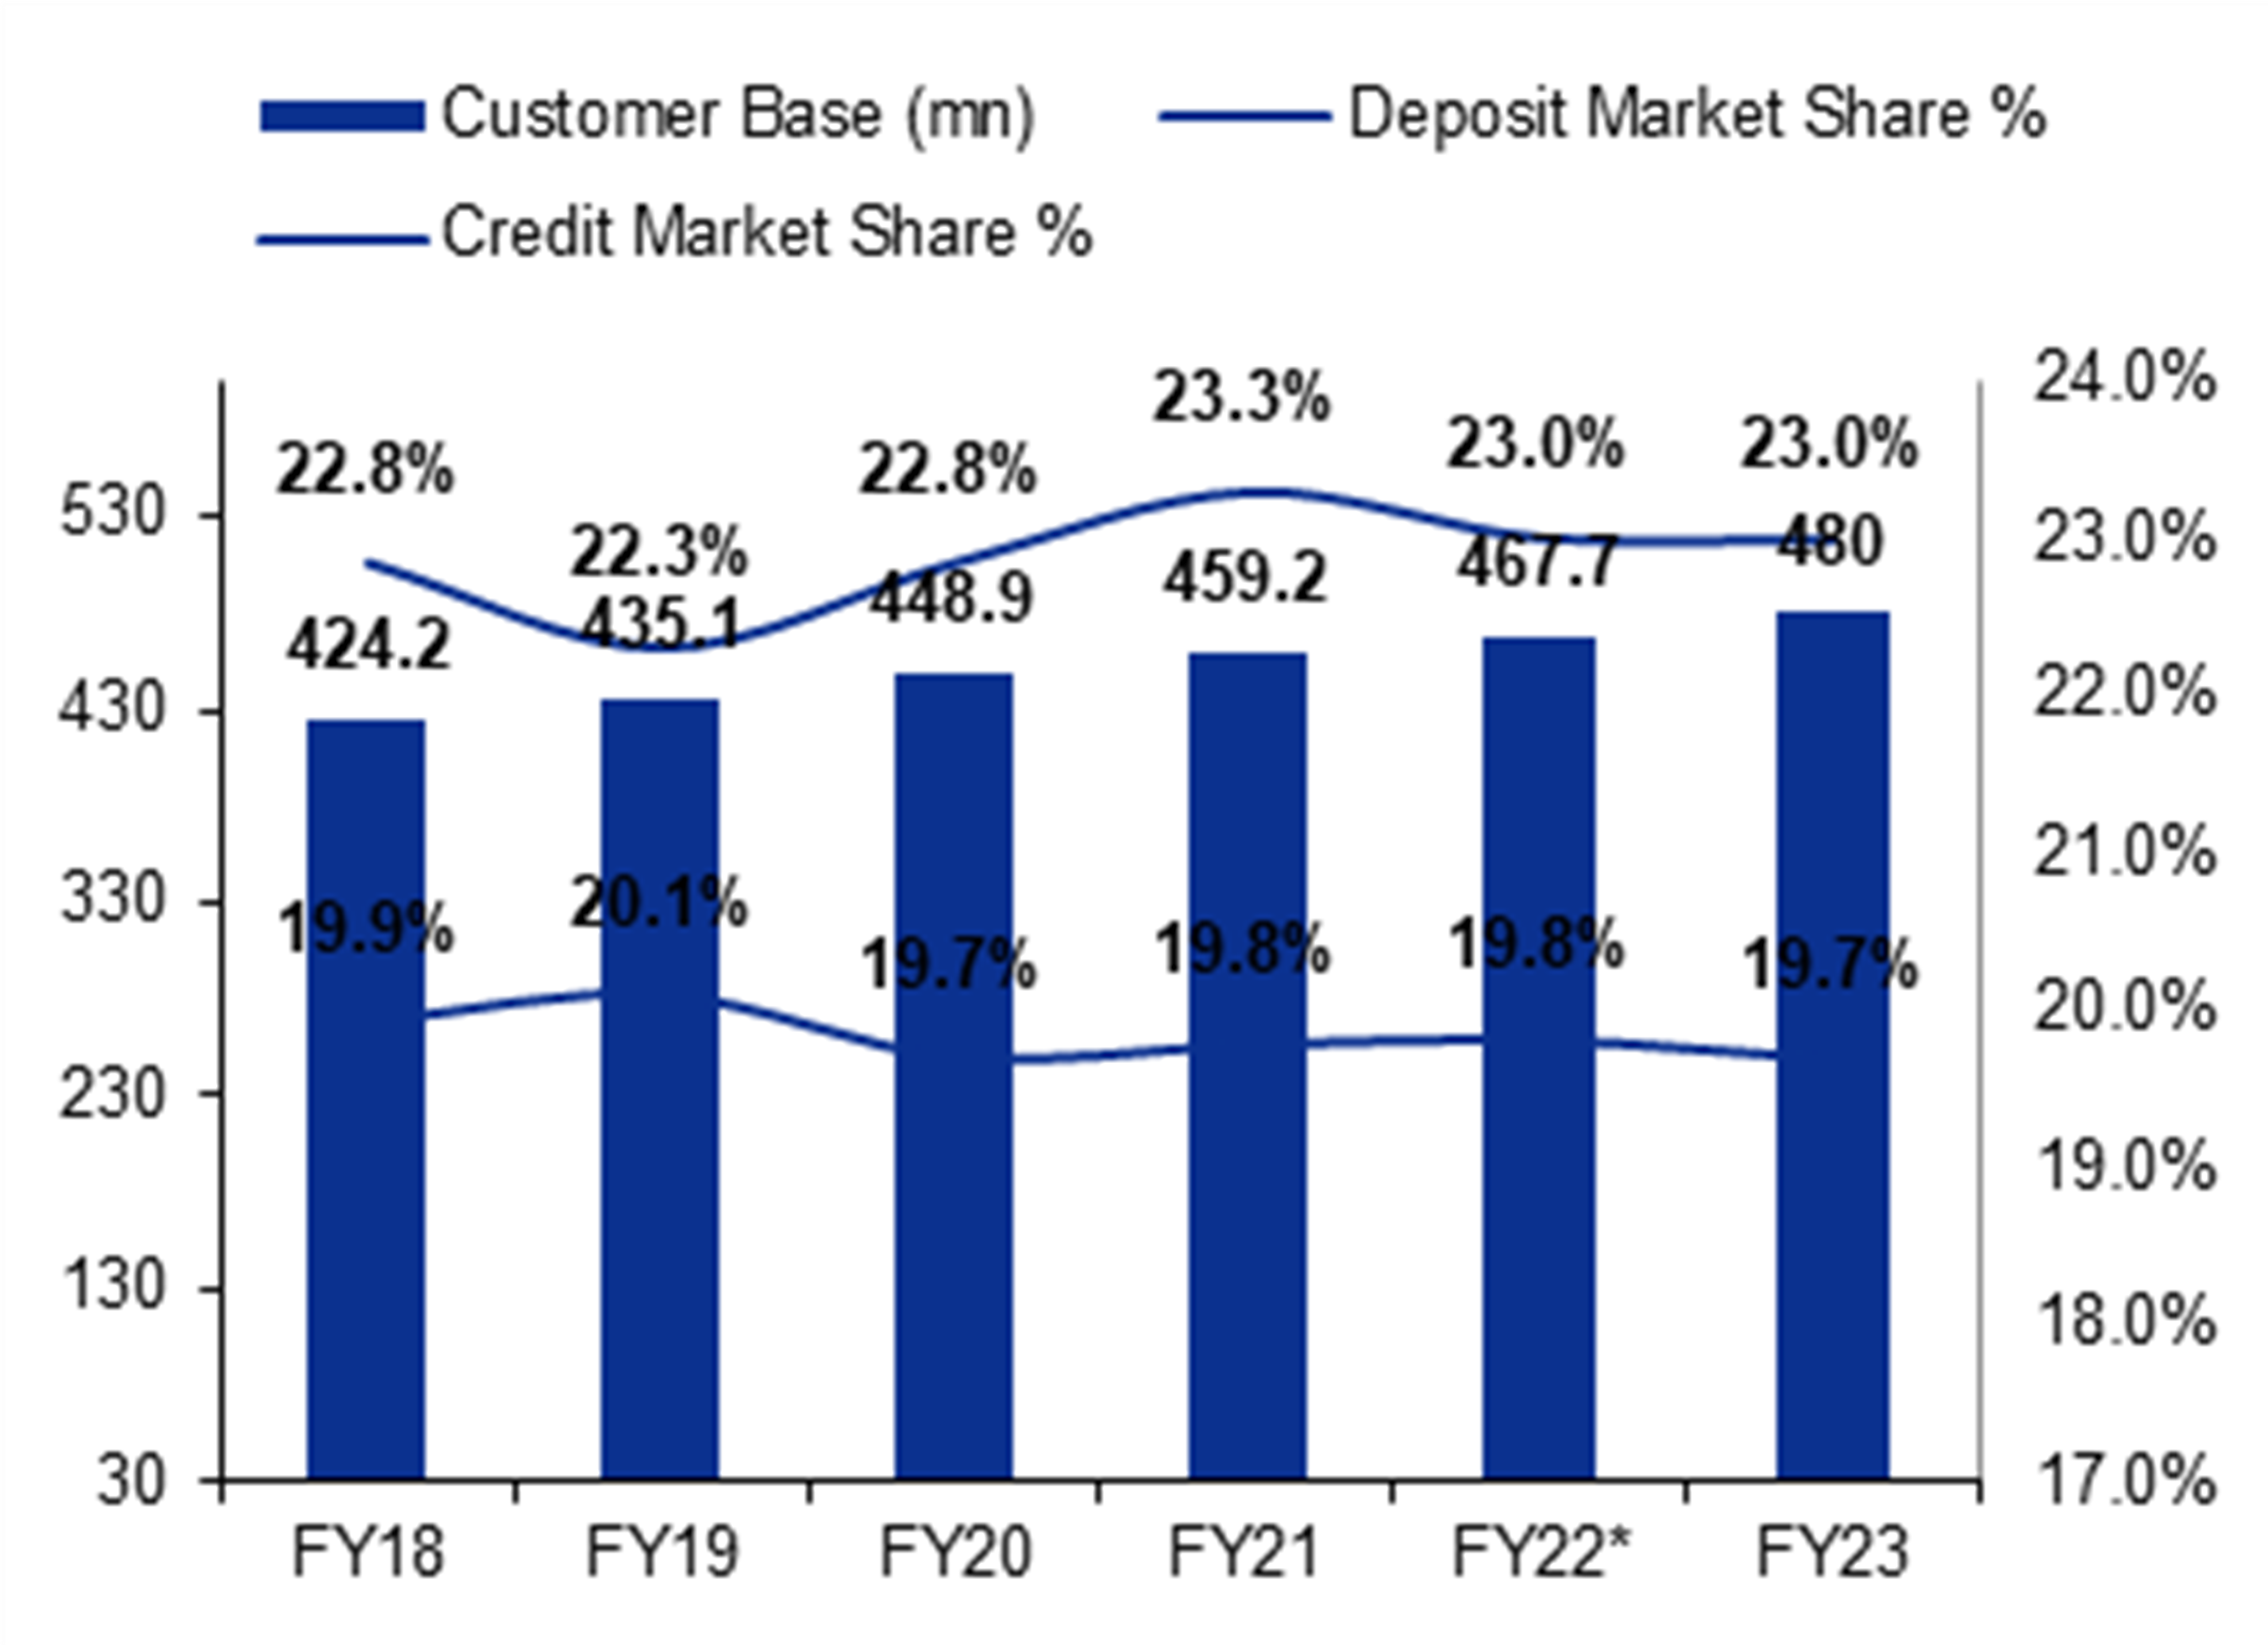
Figure 7: Customer addition & market share remained healthy
SOURCE: INCRED RESEARCH, COMPANY REPORTS


BY THE NUMBERS

Profit & Loss
(Rs mn) Mar-22A Mar-23A Mar-24F Mar-25F Mar-26F
Net Interest Income 1,207,076 1,448,405 1,611,746 1,811,350 2,065,158
Total Non-Interest Income 405,639 366,156 426,372 480,451 542,146
Operating Revenue 1,612,715 1,814,561 2,038,118 2,291,801 2,607,305
Total Non-Interest Expenses (827,305) (944,459) (1,034,877) (1,155,010) (1,307,842)
Pre-provision Operating Profit 752,924 837,130 976,998 1,107,253 1,273,205
Total Provision Charges (244,521) (165,073) (187,624) (242,436) (266,043)
Operating Profit After Provisions 508,402 672,056 789,374 864,817 1,007,162
Pretax Income/(Loss) from Assoc.
Operating EBIT (incl Associates) 508,402 672,056 789,374 864,817 1,007,162
Non-Operating Income/(Expense)
Profit Before Tax (pre-EI) 508,402 672,056 789,374 864,817 1,007,162
Exceptional Items (74,184)
Pre-tax Profit 434,219 672,056 789,374 864,817 1,007,162
Taxation (117,459) (169,732) (201,290) (220,528) (256,826)
Consolidation Adjustments & Others
Exceptional Income - post-tax
Profit After Tax 316,760 502,325 588,084 644,288 750,336
Minority Interests
Pref. & Special Div
FX And Other Adj.
Net Profit 316,760 502,325 588,084 644,288 750,336
Balance Sheet Employment
(Rs mn) Mar-22A Mar-23A Mar-24F Mar-25F Mar-26F
Gross Loans/Cust Deposits 93.9% 98.7% 98.8% 101.1% 105.9%
Avg Loans/Avg Deposits 92.3% 96.4% 98.7% 100.0% 103.6%
Avg Liquid Assets/Avg Assets 37.5% 35.7% 33.6% 33.0% 32.1%
Avg Liquid Assets/Avg IEAs 44.5% 41.8% 38.9% 38.5% 37.3%
Net Cust Loans/Assets 54.8% 58.0% 58.9% 59.2% 60.6%
Net Cust Loans/Broad Deposits 93.9% 98.7% 98.8% 101.1% 105.9%
Equity & Provns/Gross Cust Loans 10.2% 10.2% 10.2% 10.2% 10.1%
Asset Risk Weighting 52.5% 51.9% 51.1% 51.1% 51.1%
Provision Charge/Avg Cust Loans 0.94% 0.56% 0.55% 0.63% 0.61%
Provision Charge/Avg Assets 0.51% 0.31% 0.32% 0.37% 0.36%
Total Write Offs/Average Assets

BY THE NUMBERS…cont’d

Balance Sheet
(Rs mn) Mar-22A Mar-23A Mar-24F Mar-25F Mar-26F
Total Gross Loans 27,339,666 31,992,692 36,352,820 40,961,484 46,854,728
Liquid Assets & Invst. (Current) 14,814,454 15,703,662 16,759,780 18,224,484 20,157,378
Other Int. Earning Assets
Total Gross Int. Earning Assets 42,154,120 47,696,356 53,112,600 59,185,968 67,012,104
Total Provisions/Loan Loss Reserve
Total Net Interest Earning Assets 42,154,120 47,696,356 53,112,600 59,185,968 67,012,104
Intangible Assets
Other Non-Interest Earning Assets 3,399,249 3,970,616 4,478,054 5,061,308 5,733,891
Total Non-Interest Earning Assets 3,776,331 4,394,434 4,904,599 5,482,326 6,148,227
Cash And Marketable Securities 3,945,523 3,078,996 3,716,195 4,486,903 4,188,129
Long-term Investments
Total Assets 49,875,972 55,169,784 61,733,392 69,155,192 77,348,456
Customer Interest-Bearing Liabilities 29,113,860 32,416,208 36,812,772 40,515,340 44,237,776
Bank Deposits
Interest Bearing Liabilities: Others 4,030,171 3,146,556 4,172,977 4,260,434 4,931,352
Total Interest-Bearing Liabilities 33,144,030 35,562,764 40,985,748 44,775,776 49,169,128
Banks Liabilities Under Acceptances
Total Non-Interest Bearing Liabilities 1,455,978 1,631,101 1,819,797 2,299,318 2,724,572
Total Liabilities 34,600,008 37,193,864 42,805,544 47,075,092 51,893,700
Shareholders Equity 2,800,881 3,276,085 3,717,148 4,184,257 4,709,492
Minority Interests
Total Equity 2,800,881 3,276,085 3,717,148 4,184,257 4,709,492
Key Ratios
(Rs mn) Mar-22A Mar-23A Mar-24F Mar-25F Mar-26F
Total Income Growth 9.0% 20.0% 11.3% 12.4% 14.0%
Operating Profit Growth 4.9% 10.8% 15.3% 13.3% 14.3%
Pretax Profit Growth 58% 55% 17% 10% 16%
Net Interest To Total Income 74.8% 79.8% 79.1% 79.0% 79.2%
Cost Of Funds 4.85% 5.45% 5.25% 4.96% 4.65%
Return On Interest Earning Assets 6.9% 7.4% 7.2% 7.0% 6.7%
Net Interest Spread 2.02% 1.94% 1.93% 2.05% 2.08%
Net Interest Margin (Avg Deposits) 4.30% 4.71% 4.66% 4.68% 4.87%
Net Interest Margin (Avg RWA) 4.86% 5.29% 5.36% 5.41% 5.51%
Provisions to Pre Prov. Operating Profit 32% 20% 19% 22% 21%
Interest Return On Average Assets 2.54% 2.76% 2.76% 2.77% 2.82%
Effective Tax Rate 27.1% 25.3% 25.5% 25.5% 25.5%
Net Dividend Payout Ratio 16.2% 20.1% 25.0%
Return On Average Assets 0.82% 0.96% 1.01% 0.98% 1.02%
Key Drivers
(Rs mn) Mar-22A Mar-23A Mar-24F Mar-25F Mar-26F
ITEM_KEY_01 N/A N/A N/A N/A N/A
ITEM_KEY_02 N/A N/A N/A N/A N/A
ITEM_KEY_03 N/A N/A N/A N/A N/A
ITEM_KEY_04 N/A N/A N/A N/A N/A
ITEM_KEY_05 N/A N/A N/A N/A N/A
ITEM_KEY_06 N/A N/A N/A N/A N/A
ITEM_KEY_07 N/A N/A N/A N/A N/A
ITEM_KEY_08 N/A N/A N/A N/A N/A
ITEM_KEY_09 N/A N/A N/A N/A N/A
ITEM_KEY_10 N/A N/A N/A N/A N/A
SOURCES: INCRED RESEARCH, COMPANY REPORTS

DISCLAIMER

This report (including the views and opinions expressed therein, and the information comprised therein) has been prepared by Incred Research Services Private Ltd.(formerly known as Earnest Innovation Partners Private Limited) (hereinafter referred to as “ IRSPL”). IRSPL is registered with SEBI as a Research Analyst vide Registration No. INH000007793. Pursuant to a trademark agreement, IRSPL has adopted “Incred Equities ” as its trademark for use in this report.

The term “IRSPL” shall, unless the context otherwise requires, mean IRSPL and its affiliates, subsidiaries and related companies. This report is not directed or intended for distribution to or use by any person or entity resident in a state, country or any jurisdiction, where such distribution, publication, availability or use would be contrary to law, regulation or which would subject IRSPL and its affiliates/group companies to registration or licensing requirements within such jurisdictions.

This report is being supplied to you strictly on the basis that it will remain confidential. No part of this report may be (i) copied, photocopied, duplicated, stored or reproduced in any form by any means; or (ii) redistributed or passed on, directly or indirectly, to any other person in whole or in part, for any purpose without the prior written consent of IRSPL.

The information contained in this report is prepared from data believed to be correct and reliable at the time of issue of this report.

IRSPL is not required to issue regular reports on the subject matter of this report at any frequency and it may cease to do so or change the periodicity of reports at any time. IRSPL is not under any obligation to update this report in the event of a material change to the information contained in this report. IRSPL has not any and will not accept any, obligation to (i) check or ensure that the contents of this report remain current, reliable or relevant; (ii) ensure that the content of this report constitutes all the information a prospective investor may require; (iii) ensure the adequacy, accuracy, completeness, reliability or fairness of any views, opinions and information, and accordingly, IRSPL and its affiliates/group companies (and their respective directors, associates, connected persons and/or employees) shall not be liable in any manner whatsoever for any consequences (including but not limited to any direct, indirect or consequential losses, loss of profits and damages) of any reliance thereon or usage thereof.

Unless otherwise specified, this report is based upon reasonable sources. Such sources will, unless otherwise specified, for market data, be market data and prices available from the main stock exchange or market where the relevant security is listed, or, where appropriate, any other market. Information on the accounts and business of company(ies) will generally be based on published statements of the company(ies), information disseminated by regulatory information services, other publicly available information and information resulting from our research. Whilst every effort is made to ensure that statements of facts made in this report are accurate, all estimates, projections, forecasts, expressions of opinion and other subjective judgments contained in this report are based on assumptions considered to be reasonable as of the date of the document in which they are contained and must not be construed as a representation that the matters referred to therein will occur. Past performance is not a reliable indicator of future performance. The value of investments may go down as well as up and those investing may, depending on the investments in question, lose more than the initial investment. No report shall constitute an offer or an invitation by or on behalf of IRSPL and its affiliates/group companies to any person to buy or sell any investments.

The opinions expressed are based on information which are believed to be accurate and complete and obtained through reliable public or other non-confidential sources at the time made. (Information barriers and other arrangements may be established where necessary to prevent conflicts of interests arising. However, the analyst(s) may receive compensation that is based on his/their coverage of company(ies) in the performance of his/their duties or the performance of his/their recommendations. In reviewing this report, an investor should be aware that any or all of the foregoing, among other things, may give rise to real or potential conflicts of interest. Additional information is, subject to the duties of confidentiality, available on request.

The report is not a “prospectus” as defined under Indian Law, including the Companies Act, 2013, and is not, and shall not be, approved by, or filed or registered with, any Indian regulator, including any Registrar of Companies in India, SEBI, any Indian stock exchange, or the Reserve Bank of India. No offer, or invitation to offer, or solicitation of subscription with respect to any such securities listed or proposed to be listed in India is being made, or intended to be made, to the public, or to any member or section of the public in India, through or pursuant to this report.

The research analysts, strategists or economists principally responsible for the preparation of this research report are segregated from the other activities of IRSPL. Information barriers and other arrangements have been established, as required, to prevent any conflicts of interests.

The research analysts, strategists or economists principally responsible for the preparation of this research report are segregated from the other activities of IRSPL. Information barriers and other arrangements have been established, as required, to prevent any conflicts of interests.

IRSPL may have issued other reports (based on technical analysis, event specific, short term views etc.) that are inconsistent with and reach different conclusion from the information presented in this report.

Holding of Analysts/Relatives of Analysts, IRSPL and Associates of IRSPL in the covered securities, as on the date of publishing of this report

Analyst/ Relative Entity/ Associates
any financial interests in the company covered in this report (subject company) and nature of such financial interest NO NO
actual/beneficial ownership of 1% or more in securities of the subject company at the end of the month immediately preceding the date of publication of the research report or date of the public appearance; NO NO
any other material conflict of interest at the time of publication of the research report or at the time of public appearance NO NO
received any compensation from the subject company in the past twelve months for investment banking or merchant banking or brokerage services or investment advisory or depository or distribution from the subject company in the last twelve months for products/services other than investment banking or merchant banking or broker- age services or investment advisory or depository or distribution from the subject company in the last twelve months NO NO
managed or co-managed public offering of securities for the subject company in the last twelve months NO NO
received any compensation or other benefits from the subject company or third party in connection with the research report NO NO
served as an officer, director or employee of the subject company NO NO
been engaged in market making activity for the subject company NO NO
Analyst declaration
  • The analyst responsible for the production of this report hereby certifies that the views expressed herein accurately and exclusively reflect his or her personal views and opinions about any and all of the issuers or securities analysed in this report and were prepared independently and autonomously in an unbiased manner.
  • No part of the compensation of the analyst(s) was, is, or will be directly or indirectly related to the inclusion of specific recommendations(s) or view(s) in this report or based any specific investment banking transaction.
  • The analyst(s) has(have) not had any serious disciplinary action taken against him/her(them). • The analyst, strategist, or economist does not have any material conflict of interest at the time of
  • publication of this report.
  • The analyst(s) has(have) received compensation based upon various factors, including quality, accuracy and value of research, overall firm performance, client feedback and competitive factors.

IRSPL and/or its affiliates and/or its Directors/employees may own or have positions in securities of the company(ies) covered in this report or any securities related thereto and may from time to time add to or dispose of, or may be materially interested in, any such securities.

IRSPL and/or its affiliates and/or its Directors/employees may do and seek to do business with the company(ies) covered in this research report and may from time to time (a) buy/sell the securities covered in this report, from time to time and/or (b) act as market maker or have assumed an underwriting commitment in securities of such company(ies), and/or (c) may sell them to or buy them from customers on a principal basis and/or (d) may also perform or seek to perform significant investment banking, advisory, underwriting or placement services for or relating to such company(ies) and/or (e) solicit such investment, advisory or other services from any entity mentioned in thisreport and/or (f) act as a lender/borrower to such company and may earn brokerage or other compensation. However, Analysts are forbidden to acquire, on their own account or hold securities (physical or uncertificated, including derivatives) of companies in respect of which they are compiling and producing financial recommendations or in the result of which they play a key part.