* price as on January 01, 0001
India
Consensus ratings*: Buy 11 Hold 17 Sell 14
Previous target: 664
Up/downside: -0.2%
Reuters
Bloomberg: LPC IN
Market cap: US$4,163m
Rs302,290m
Average daily turnover: US$12.6m
Current shares o/s: 454.4m
Free float: 5,290.0%
*Source: Bloomberg

Key changes in this note

Reduce FY23F core earnings estimate by 30%.

Maintain Hold rating with an unchanged target price of Rs664.

*Source: Bloomberg

Price performance
1M 3M 12M
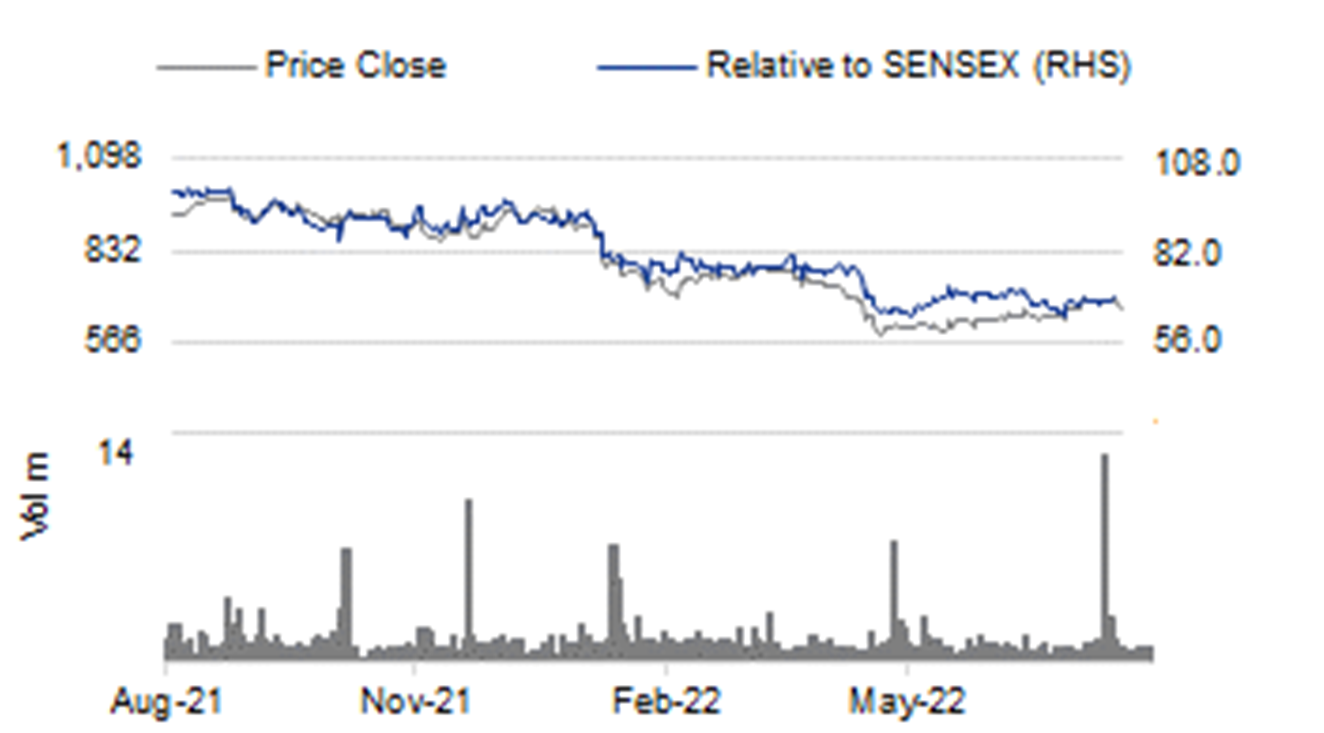
Absolute (%) 5.1 12.6 (29.3)
Relative (%) (1.1) 4.0 (32.7)
Major shareholders
% held
Promoter 47.1
LIC 8.4
ICICI Pru MF 5.5
Analyst(s)

Bino PATHIPARAMPIL

T (91) 22 4161 1552
E bino.pathiparampil@incredcapital.com

Kashish THAKUR

T (91) 22 4161 1549
E kashish.thakur@incredcapital.com

The wait gets longer

After the CRL letter from the US FDA on gSpiriva ANDA, we have removed it from our FY23F estimate but continue to build in a full upside in FY24F.

Accordingly, we have cut our FY23F core earnings estimate by 30% but maintain FY24F core earnings estimate.

We continue our preference to wait on the sidelines for better visibility.  Maintain Hold rating on the stock with an unchanged target price of Rs664.

CRL letter delays gSpiriva approval by at least six months

The Complete Response Letter (CRL) from the US Food and Drug Administration or US FDA will delay the approval for Lupin’s generic version of Spiriva inhaler by at least six months. Spiriva is a Tiotropium inhaler from Boehringer and registered about US$700m in sales in the US at the innovator’s prices. Lupin is the only generic player in advanced stages of development of this drug and could enjoy a long duration of limited competition upon approval. We believe the product could generate US$75-100m of high-margin revenue for Lupin once it is approved by the regulator.

Base business profitability becomes more critical

With the delay in gSpiriva launch, the profitability of Lupin’s base business has become highly critical to improve margin levels. The company reported single-digit EBITDA margin for the last three quarters. The stock is pricing in a significant rebound in margins to at least mid-teens.

Cut our FY23F earnings estimate but maintain FY24F estimate

We have removed gSpiriva revenue from our FY23F estimate and, accordingly, cut our FY23F core earnings estimate by 30%. However, we maintain our FY24F core earnings estimate as we go by management’s guidance of a potential approval for the drug in 4QFY23F.

Downside limited; upside only after margin delivery

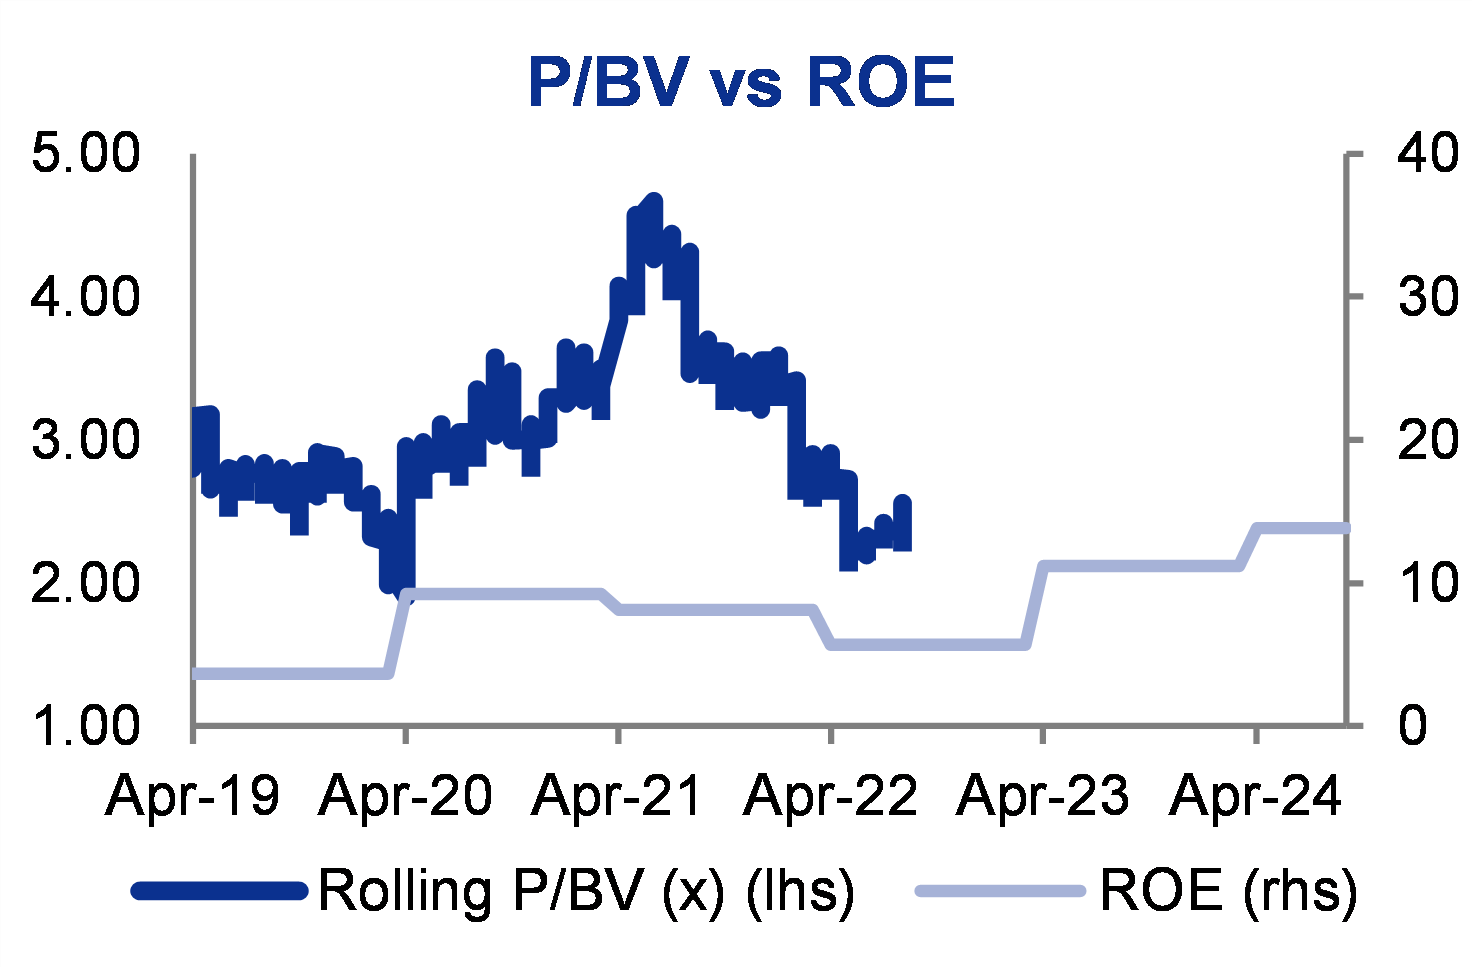
While the valuation is not cheap based on current profitability, we see a limited downside to Lupin’s stock price given the value of the company’s high quality domestic business franchise. However, any upside in the stock price, in our view, will be after margin delivery north of mid-teens, the visibility on which is currently weak.

Will continue to wait on the sidelines

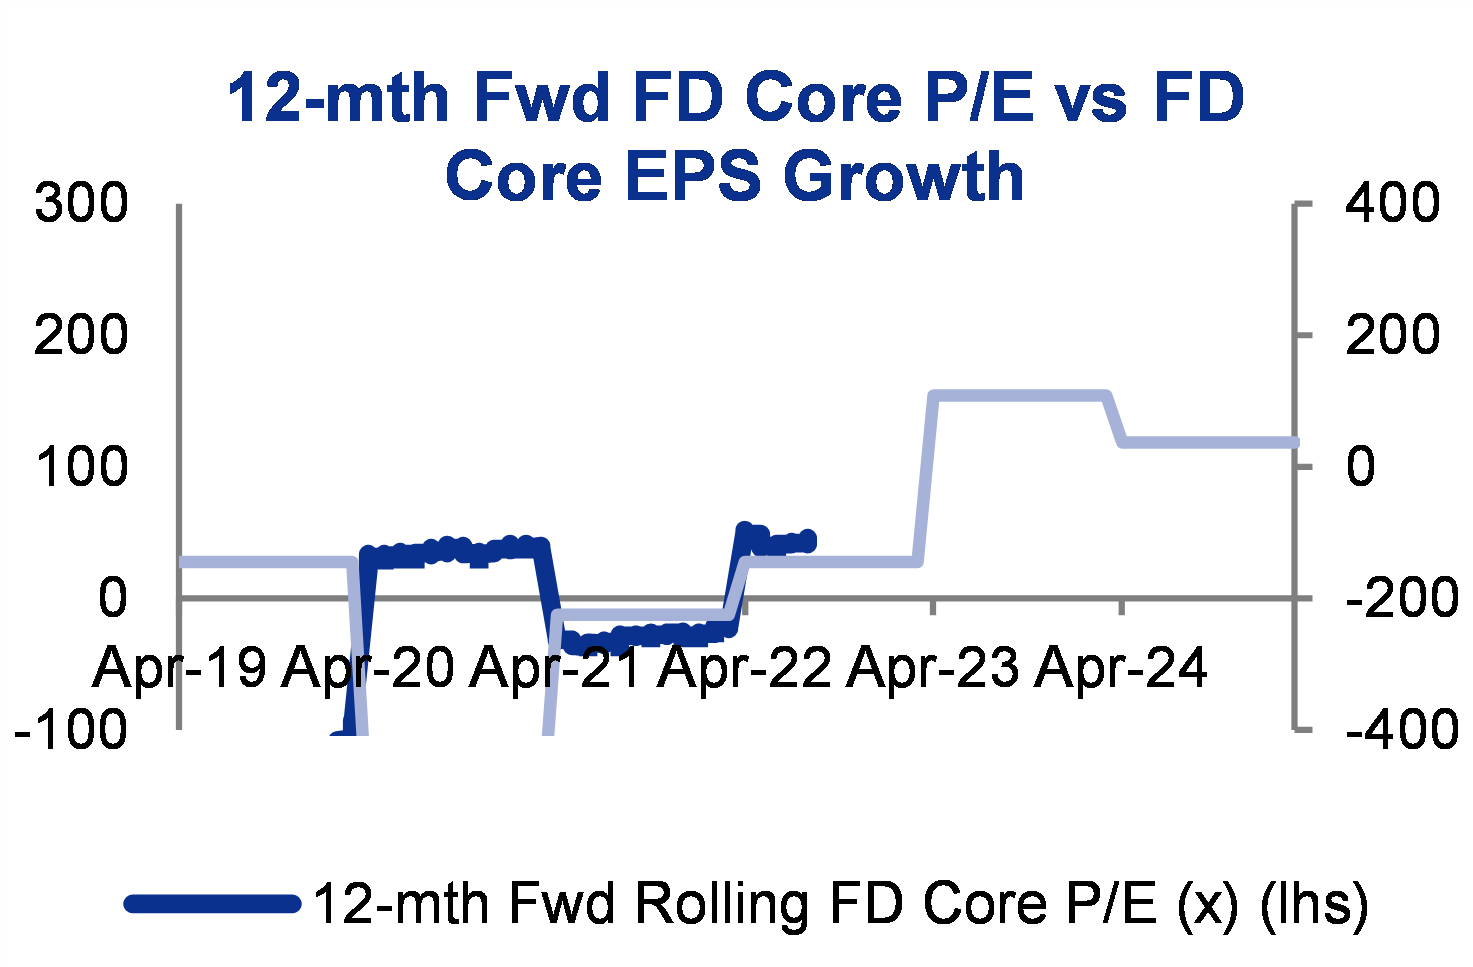
Lupin trades at 49x our revised FY23F and 21x FY24F core earnings estimates. We continue our preference to wait on the sidelines for better visibility of improvement in base business profitability and high-value product upside. We maintain Hold rating on Lupin with an unchanged target price of Rs664, which is 21.6x FY24F core earnings plus cash per share. Faster rebound in base business profitability and value unlocking through corporate actions will be key upside risks. Continued subdued profitability of the base business and further delay in gSpiriva approval will be key downside risks.    

Financial Summary
Mar-21A Mar-22A Mar-23F Mar-24F Mar-25F
Revenue (Rsm) 151,630 164,055 166,485 184,330 203,427
Operating EBITDA (Rsm) 25,669 20,972 19,155 29,659 37,003
Net Profit (Rsm) 12,165 (15,280) 6,965 14,462 19,739
Core EPS (Rs) 26.7 23.3 15.3 31.8 43.4
Core EPS Growth 151.7% (12.9%) (34.2%) 107.6% 36.5%
FD Core P/E (x) 24.86 28.55 43.38 20.89 15.31
DPS (Rs) 7.5 10.5 7.5 7.5 8.5
Dividend Yield 1.13% 1.58% 1.13% 1.13% 1.28%
EV/EBITDA (x) 11.36 15.49 17.25 11.16 8.80
P/FCFE (x) 18.90 (21.75) 38.83 22.01 13.27
Net Gearing (7.7%) 18.3% 22.3% 20.8% 15.0%
P/BV (x) 2.19 2.49 2.44 2.25 2.01
ROE 9.2% 8.2% 5.7% 11.2% 13.8%
% Change In Core EPS Estimates (27.11%)
InCred Research/Consensus EPS (x)
INCRED RESEARCH, COMPANY REPORTS, PRICED AS AT January 01, 0001
Figure 1: Core valuation table


FY21

FY22

FY23F

FY24F

FY25F

Core EPS (Rs)

24.4

19.1

12.6

29.7

41.2

Core EPS growth

227.0%

-22.0%

-33.8%

135.2%

38.9%

Cash per share (Rs)

90.6

42.1

21.0

12.3

9.8

Current core P/E (Rs)

25.4

32.6

49.3

20.9

15.1

Core ROIC

11.7%

9.0%

6.7%

13.1%

16.5%

SOURCE: INCRED RESEARCH, COMPANY REPORTS


BY THE NUMBERS

Profit & Loss
(Rs mn) Mar-21A Mar-22A Mar-23F Mar-24F Mar-25F
Total Net Revenue 151,630 164,055 166,485 184,330 203,427
Gross Profit 98,007 99,242 99,211 113,717 126,105
Operating EBITDA 25,669 20,972 19,155 29,659 37,003
Depreciation And Amortization (8,874) (9,510) (9,428) (9,700) (10,000)
Operating EBIT 16,795 11,462 9,727 19,959 27,003
Financial Income/(Expense) (1,406) (1,428) (1,628) (1,400) (1,300)
Pre-tax Income/(Loss) from Assoc.
Non-Operating Income/(Expense) 1,363 2,101 1,639 1,200 1,200
Profit Before Tax (pre-EI) 16,751 12,135 9,738 19,759 26,903
Exceptional Items
Pre-tax Profit 16,751 12,135 9,738 19,759 26,903
Taxation (4,485) (1,372) (2,640) (5,137) (6,995)
Exceptional Income - post-tax 13 (25,861)
Profit After Tax 12,279 (15,097) 7,099 14,622 19,909
Minority Interests (114) (183) (134) (160) (170)
Preferred Dividends
FX Gain/(Loss) - post tax
Other Adjustments - post-tax
Net Profit 12,165 (15,280) 6,965 14,462 19,739
Recurring Net Profit 12,152 10,580 6,965 14,462 19,739
Fully Diluted Recurring Net Profit 12,152 10,580 6,965 14,462 19,739
Cash Flow
(Rs mn) Mar-21A Mar-22A Mar-23F Mar-24F Mar-25F
EBITDA 25,669 20,972 19,155 29,659 37,003
Cash Flow from Invt. & Assoc.
Change In Working Capital (1,925) 150 (3,737) (10,269) (9,431)
(Incr)/Decr in Total Provisions
Other Non-Cash (Income)/Expense
Other Operating Cashflow 3,035 (16,679) (1,134) (4,372) (5,654)
Net Interest (Paid)/Received (1,406) (1,428) (1,628) (1,125) (1,611)
Tax Paid (7,155) 658 (12) 200 100
Cashflow From Operations 18,217 3,673 12,645 14,093 20,408
Capex (6,776) (8,980) (10,000) (11,000) (11,500)
Disposals Of FAs/subsidiaries
Acq. Of Subsidiaries/investments (1,468) (3,250)
Other Investing Cashflow
Cash Flow From Investing 11,441 (6,775) (605) 3,093 8,908
Debt Raised/(repaid) (13,677) (10,787) (4,259) (3,457) (6,543)
Proceeds From Issue Of Shares 106 2
Shares Repurchased
Dividends Paid (2,723) (2,951) (4,771) (3,408) (3,408)
Preferred Dividends
Other Financing Cashflow 21,656 (1,606) 12 (200) (100)
Cash Flow From Financing 5,361 (15,343) (9,019) (7,065) (10,051)
Total Cash Generated 16,803 (22,117) (9,624) (3,972) (1,144)
Free Cashflow To Equity 15,982 (13,888) 7,780 13,728 22,772
Free Cashflow To Firm 31,065 (1,674) 13,667 18,586 30,615

BY THE NUMBERS…cont’d

Balance Sheet
(Rs mn) Mar-21A Mar-22A Mar-23F Mar-24F Mar-25F
Total Cash And Equivalents 41,346 19,228 9,604 5,632 4,488
Total Debtors 44,743 42,619 49,945 55,299 61,028
Inventories 40,920 46,307 34,962 38,709 42,720
Total Other Current Assets 12,855 16,422 38,292 42,396 46,788
Total Current Assets 139,864 124,577 132,803 142,036 155,024
Fixed Assets 52,344 53,973 54,545 55,845 57,345
Total Investments 319 303 303 303 303
Intangible Assets 37,126 31,306 34,556 34,556 34,556
Total Other Non-Current Assets 6,451 8,053 8,053 8,053 8,053
Total Non-current Assets 96,241 93,635 97,457 98,757 100,257
Short-term Debt 30,494 37,946 37,946 10,000 10,000
Current Portion of Long-Term Debt
Total Creditors 20,144 22,829 26,519 27,841 29,956
Other Current Liabilities 33,722 21,990 32,413 34,028 36,613
Total Current Liabilities 84,361 82,764 96,877 71,868 76,570
Total Long-term Debt 161 3,638 (621) 23,867 17,324
Hybrid Debt - Debt Component
Total Other Non-Current Liabilities 13,001 9,590 9,590 9,590 9,590
Total Non-current Liabilities 13,162 13,227 8,968 33,457 26,913
Total Provisions
Total Liabilities 97,523 95,992 105,846 105,325 103,483
Shareholders’ Equity 138,031 121,533 123,593 134,487 150,647
Minority Interests 550 687 821 981 1,151
Total Equity 138,581 122,220 124,414 135,467 151,798
Key Ratios
(Rs mn) Mar-21A Mar-22A Mar-23F Mar-24F Mar-25F
Revenue Growth (7.5%) 8.2% 1.5% 10.7% 10.4%
Operating EBITDA Growth 3.7% (18.3%) (8.7%) 54.8% 24.8%
Operating EBITDA Margin 16.9% 12.8% 11.5% 16.1% 18.2%
Net Cash Per Share (Rs) 23.53 (49.20) (61.01) (62.14) (50.26)
BVPS (Rs) 303.78 267.47 272.00 295.98 331.54
Gross Interest Cover 11.94 8.03 5.98 14.26 20.77
Effective Tax Rate 26.8% 11.3% 27.1% 26.0% 26.0%
Net Dividend Payout Ratio
Accounts Receivables Days 119.40 97.19 101.47 104.20 104.36
Inventory Days 256.92 245.62 220.46 190.40 192.19
Accounts Payables Days 150.66 121.01 133.87 140.49 136.42
ROIC (%) 8.9% 5.6% 4.5% 8.6% 11.0%
ROCE (%) 9.9% 6.9% 6.0% 12.1% 15.5%
Return On Average Assets 5.5% 5.2% 3.7% 6.7% 8.4%
Key Drivers
(Rs mn) Mar-21A Mar-22A Mar-23F Mar-24F Mar-25F
Outstanding Orderbook N/A N/A N/A N/A N/A
Order Book Depletion N/A N/A N/A N/A N/A
Orderbook Replenishment N/A N/A N/A N/A N/A
ASP (% chg, main prod./serv.) N/A N/A N/A N/A N/A
Unit sales grth (%, main prod./serv.) N/A N/A N/A N/A N/A
Util. rate (%, main prod./serv.) N/A N/A N/A N/A N/A
ASP (% chg, 2ndary prod./serv.) N/A N/A N/A N/A N/A
Unit sales grth (%,2ndary prod/serv) N/A N/A N/A N/A N/A
Util. rate (%, 2ndary prod/serv) N/A N/A N/A N/A N/A
SOURCES: INCRED RESEARCH, COMPANY REPORTS

DISCLAIMER

This report (including the views and opinions expressed therein, and the information comprised therein) has been prepared by Incred Research Services Private Ltd.(formerly known as Earnest Innovation Partners Private Limited) (hereinafter referred to as “ IRSPL”). IRSPL is registered with SEBI as a Research Analyst vide Registration No. INH000007793. Pursuant to a trademark agreement, IRSPL has adopted “Incred Equities ” as its trademark for use in this report.

The term “IRSPL” shall, unless the context otherwise requires, mean IRSPL and its affiliates, subsidiaries and related companies. This report is not directed or intended for distribution to or use by any person or entity resident in a state, country or any jurisdiction, where such distribution, publication, availability or use would be contrary to law, regulation or which would subject IRSPL and its affiliates/group companies to registration or licensing requirements within such jurisdictions.

This report is being supplied to you strictly on the basis that it will remain confidential. No part of this report may be (i) copied, photocopied, duplicated, stored or reproduced in any form by any means; or (ii) redistributed or passed on, directly or indirectly, to any other person in whole or in part, for any purpose without the prior written consent of IRSPL.

The information contained in this report is prepared from data believed to be correct and reliable at the time of issue of this report.

IRSPL is not required to issue regular reports on the subject matter of this report at any frequency and it may cease to do so or change the periodicity of reports at any time. IRSPL is not under any obligation to update this report in the event of a material change to the information contained in this report. IRSPL has not any and will not accept any, obligation to (i) check or ensure that the contents of this report remain current, reliable or relevant; (ii) ensure that the content of this report constitutes all the information a prospective investor may require; (iii) ensure the adequacy, accuracy, completeness, reliability or fairness of any views, opinions and information, and accordingly, IRSPL and its affiliates/group companies (and their respective directors, associates, connected persons and/or employees) shall not be liable in any manner whatsoever for any consequences (including but not limited to any direct, indirect or consequential losses, loss of profits and damages) of any reliance thereon or usage thereof.

Unless otherwise specified, this report is based upon reasonable sources. Such sources will, unless otherwise specified, for market data, be market data and prices available from the main stock exchange or market where the relevant security is listed, or, where appropriate, any other market. Information on the accounts and business of company(ies) will generally be based on published statements of the company(ies), information disseminated by regulatory information services, other publicly available information and information resulting from our research. Whilst every effort is made to ensure that statements of facts made in this report are accurate, all estimates, projections, forecasts, expressions of opinion and other subjective judgments contained in this report are based on assumptions considered to be reasonable as of the date of the document in which they are contained and must not be construed as a representation that the matters referred to therein will occur. Past performance is not a reliable indicator of future performance. The value of investments may go down as well as up and those investing may, depending on the investments in question, lose more than the initial investment. No report shall constitute an offer or an invitation by or on behalf of IRSPL and its affiliates/group companies to any person to buy or sell any investments.

The opinions expressed are based on information which are believed to be accurate and complete and obtained through reliable public or other non-confidential sources at the time made. (Information barriers and other arrangements may be established where necessary to prevent conflicts of interests arising. However, the analyst(s) may receive compensation that is based on his/their coverage of company(ies) in the performance of his/their duties or the performance of his/their recommendations. In reviewing this report, an investor should be aware that any or all of the foregoing, among other things, may give rise to real or potential conflicts of interest. Additional information is, subject to the duties of confidentiality, available on request.

The report is not a “prospectus” as defined under Indian Law, including the Companies Act, 2013, and is not, and shall not be, approved by, or filed or registered with, any Indian regulator, including any Registrar of Companies in India, SEBI, any Indian stock exchange, or the Reserve Bank of India. No offer, or invitation to offer, or solicitation of subscription with respect to any such securities listed or proposed to be listed in India is being made, or intended to be made, to the public, or to any member or section of the public in India, through or pursuant to this report.

The research analysts, strategists or economists principally responsible for the preparation of this research report are segregated from the other activities of IRSPL. Information barriers and other arrangements have been established, as required, to prevent any conflicts of interests.

The research analysts, strategists or economists principally responsible for the preparation of this research report are segregated from the other activities of IRSPL. Information barriers and other arrangements have been established, as required, to prevent any conflicts of interests.

IRSPL may have issued other reports (based on technical analysis, event specific, short term views etc.) that are inconsistent with and reach different conclusion from the information presented in this report.

Holding of Analysts/Relatives of Analysts, IRSPL and Associates of IRSPL in the covered securities, as on the date of publishing of this report

Analyst/ Relative Entity/ Associates
any financial interests in the company covered in this report (subject company) and nature of such financial interest NO NO
actual/beneficial ownership of 1% or more in securities of the subject company at the end of the month immediately preceding the date of publication of the research report or date of the public appearance; NO NO
any other material conflict of interest at the time of publication of the research report or at the time of public appearance NO NO
received any compensation from the subject company in the past twelve months for investment banking or merchant banking or brokerage services or investment advisory or depository or distribution from the subject company in the last twelve months for products/services other than investment banking or merchant banking or broker- age services or investment advisory or depository or distribution from the subject company in the last twelve months NO NO
managed or co-managed public offering of securities for the subject company in the last twelve months NO NO
received any compensation or other benefits from the subject company or third party in connection with the research report NO NO
served as an officer, director or employee of the subject company NO NO
been engaged in market making activity for the subject company NO NO
Analyst declaration
  • The analyst responsible for the production of this report hereby certifies that the views expressed herein accurately and exclusively reflect his or her personal views and opinions about any and all of the issuers or securities analysed in this report and were prepared independently and autonomously in an unbiased manner.
  • No part of the compensation of the analyst(s) was, is, or will be directly or indirectly related to the inclusion of specific recommendations(s) or view(s) in this report or based any specific investment banking transaction.
  • The analyst(s) has(have) not had any serious disciplinary action taken against him/her(them). • The analyst, strategist, or economist does not have any material conflict of interest at the time of
  • publication of this report.
  • The analyst(s) has(have) received compensation based upon various factors, including quality, accuracy and value of research, overall firm performance, client feedback and competitive factors.

IRSPL and/or its affiliates and/or its Directors/employees may own or have positions in securities of the company(ies) covered in this report or any securities related thereto and may from time to time add to or dispose of, or may be materially interested in, any such securities.

IRSPL and/or its affiliates and/or its Directors/employees may do and seek to do business with the company(ies) covered in this research report and may from time to time (a) buy/sell the securities covered in this report, from time to time and/or (b) act as market maker or have assumed an underwriting commitment in securities of such company(ies), and/or (c) may sell them to or buy them from customers on a principal basis and/or (d) may also perform or seek to perform significant investment banking, advisory, underwriting or placement services for or relating to such company(ies) and/or (e) solicit such investment, advisory or other services from any entity mentioned in thisreport and/or (f) act as a lender/borrower to such company and may earn brokerage or other compensation. However, Analysts are forbidden to acquire, on their own account or hold securities (physical or uncertificated, including derivatives) of companies in respect of which they are compiling and producing financial recommendations or in the result of which they play a key part.